
Quantization method of light space distribution of crop population

A technology of spatial distribution and quantitative method, which is applied in the field of agricultural planting, can solve problems such as large deviations, errors, and inability to accurately describe the characteristics of spatial distribution, and achieve the effect of convenient moving distance and convenient testing

Active Publication Date: 2015-07-01
ANYANG XIAOKANG PESTICIDE
View PDF4 Cites 0 Cited by
  • Summary
  • Abstract
  • Description
  • Claims
  • Application Information

AI Technical Summary

Problems solved by technology

[0004] The above measurement and quantification methods have made great progress in the light transmission and distribution in the canopy, which laid a theoretical foundation for the accurate simulation and quantification of canopy photosynthetic productivity, and has been widely used; however, the previous canopy light distribution Most of the models are one-dimensional or two-dimensional, and are usually applied to crop populations that assume horizontal homogeneity, which is contrary to the high spatial heterogeneity of the actual crop plant structure, and cannot accurately describe the spatial distribution characteristics, and thus cannot accurately quantify the crop population The distribution of light energy at any point in space often leads to large deviations or wrong conclusions, which have a wrong impact on the evaluation of crop variety characteristics, vegetation ecological environment, and crop growth.

Method used


Image

  • Quantization method of light space distribution of crop population
  • Quantization method of light space distribution of crop population
  • Quantization method of light space distribution of crop population

Examples


Embodiment 1

[0045] The test was carried out in Anyang City, Henan Province (36°06′N, 114°21′E) in 2011 and 2012 at the Cotton Research Institute of the Chinese Academy of Agricultural Sciences. The test cotton variety was Lumianyan 28, and six different planting Density of cotton population, respectively 15000, 33000, 51000, 69000, 87000, 105000 plants / hm 2 ;The experiment adopts random block design, repeats 4 times, and the area of ​​each plot is 66.6m 2 , row spacing is 0.80m, 20 rows for each plot. The 2011 planting time is April 20, and the 2012 planting time is April 22.

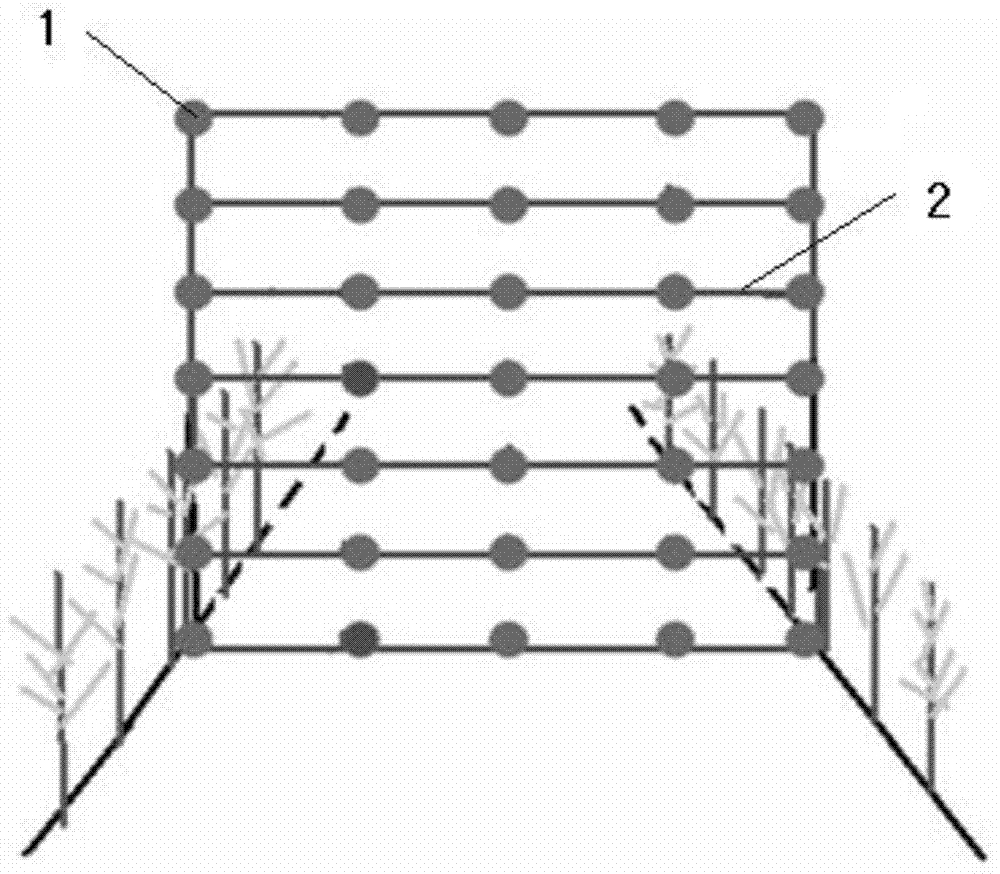
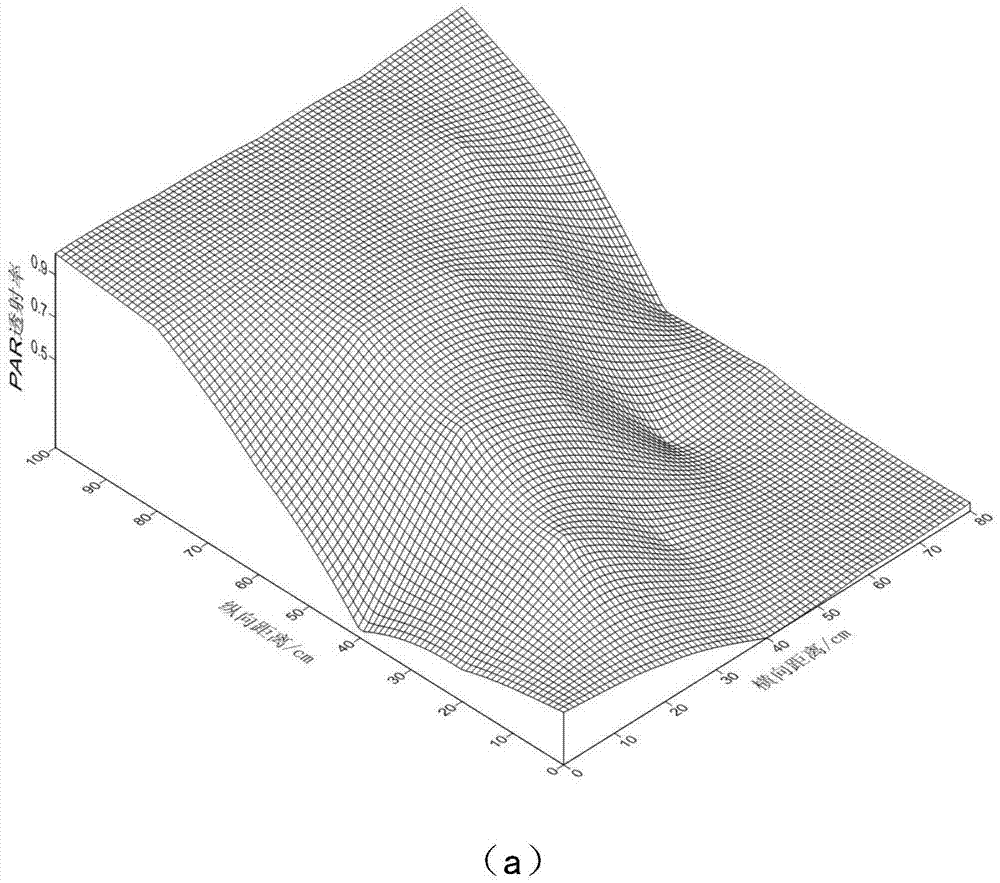
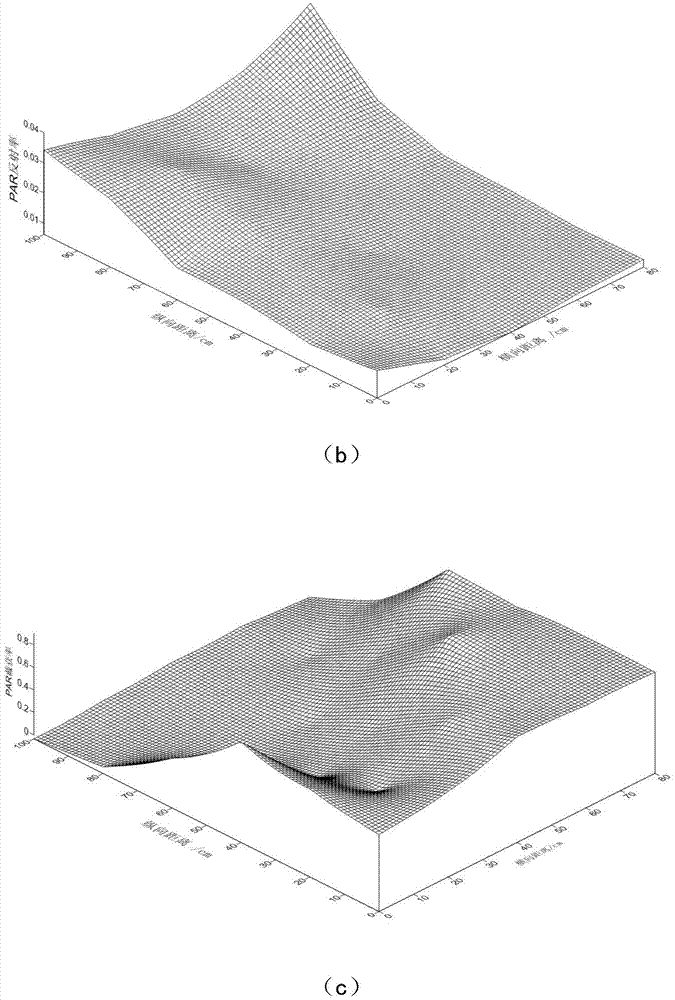
[0046] Photosynthetically active radiation PAR data collection uses the principle of spatial statistics. Firstly, the sampling method of spatial grid method is used to select 2 representative cotton rows in each density group, and a test frame is placed in the longitudinal section area between the cotton rows to measure each The PAR value of the test point: the probe is horizontally upward to measure the transmis...

Embodiment 2

[0058] Cotton group photosynthetically active radiation PAR data collection method and group PAR transmittance, PAR reflectance calculation method are the same as embodiment 1; the difference is that the present embodiment 2 selects 9 cotton varieties and new lines with different plant types, which are respectively cotton Institute 79, China Cotton Institute 60, Lumian 28, Ji 228, Ji 958, ZM3799, ZM120, ZM113, DG002 constructed 9 different types of cotton populations by using 9 different cotton varieties. The test was carried out in Anyang City, Henan Province (36°06′N, 114°21′E) in 2012 at the Cotton Research Institute of the Chinese Academy of Agricultural Sciences, and the design test planting density was 90,000 plants / hm 2 , the row spacing is 0.8m and other row settings, the sowing period is April 22, the plot is 10 rows, the row length is 8m, the width is 0.8m, and the plot area is 64.0㎡. For different cotton populations constructed with different plant types (lines), qu...

Embodiment 3

[0061] Cotton population photosynthetically active radiation PAR data collection method and population PAR transmittance, PAR reflectance calculation method are the same as in Example 1, the difference is that this embodiment 3 selects a cotton variety Zhongmian Institute 79, adopts different row spacing configurations, Constructed 6 different cotton populations, 6 different row spacing configurations are: 80cm equal row spacing planting and 90cm+20cm, 90cm+10cm, 80cm+20cm, 80cm+10cm, 70cm+20cm and other 5 wide and narrow row double row configuration mode. The experiment was carried out in 2012 in Anyang City, Henan Province (36°06′N, 114°21′E) at the Cotton Research Institute of the Chinese Academy of Agricultural Sciences. The field sowing period is April 22, the plot is 8m long, 8m wide, and the planting density is 90,000 plants / hm 2 . Quantify the light energy distribution of six cotton populations constructed with different plant row spacing configurations, and provide ...


PUM


Abstract

The invention relates to a quantization method of the light space distribution of a crop population. The quantization method comprises the steps of: (1) selecting a tested crop population by utilizing a space lattice sampling method, uniformly distributing test points in a longitudinally tested section region of a canopy of the tested crop population, and testing PAR (photosynthetically active radiation) values of each test point by utilizing a PAR test instrument, wherein the tested PAR values of each test point include a transmission PAR value and a reflection PAR value; (2) solving the PAR values of other to-be-tested points in the longitudinally tested section region by utilizing a kriging interpolation method according to the tested PAR values of each test point obtained in the step (1); (3) establishing a coordinate system in the longitudinally tested section region, carrying out numbering on the test points and to-be-tested points in the longitudinally tested section region so as to generate Grid files; (4) after acquiring interpolation Grid files of the transmission and reflection, solving the light interception rate corresponding to each element in the Grid files by utilizing a matrix manipulation method; (5) obtaining the whole light use efficiency of the population based on the solved light interception rates of the test points and to-be-tested points in the longitudinally tested section region.

Description

technical field [0001] The invention relates to the field of agricultural planting, in particular to a method for quantifying the spatial distribution of light energy of crop groups. Background technique [0002] Since the quantification of the spatial distribution of light energy in crop populations is an old scientific and technical problem that has not been effectively resolved, how to quantify the light distribution in the canopy, improve the light-receiving ability of the crop canopy, and create a reasonable population structure has become a major issue in crop production and ecology. An important field of systems research. Monsi and Saeki (1953) first applied the Beer-Lambert law of light propagation in a randomly distributed medium to the study of light transmission in the plant canopy, assuming that the leaves in the canopy were randomly distributed, divided into many layers according to the height layer, and measured each Leaf area and light intensity in the layer,...

Claims


Application Information

Patent Timeline
Patent Type & Authority Patents(China)
IPC IPC(8): G01N21/59G01N21/47
Inventor 李亚兵韩迎春毛树春范正义王国平冯璐杨北方
Owner ANYANG XIAOKANG PESTICIDE
Learn More