Visualized detection method for online abnormal movements of power distribution automation graph and model

A technology of power distribution automation and detection methods, applied in the direction of instruments, data processing applications, calculations, etc., can solve problems such as safety hazards in the production process, affect the efficiency and accuracy of abnormal debugging execution, and achieve improved efficiency and accuracy, and improved synchronization Sexuality, the effect of reducing investment and maintenance costs

Inactive Publication Date: 2016-08-31
STATE GRID FUJIAN ELECTRIC POWER CO LTD +2
View PDF3 Cites 16 Cited by
  • Summary
  • Abstract
  • Description
  • Claims
  • Application Information

AI Technical Summary

Problems solved by technology

[0004] The above method, on the one hand, will directly skip the offline pattern review process due to the negligence of the operator, which will bring safety hazards to the production process; verification, seriously affecting the execution efficiency and accuracy of daily transaction debugging

Method used


Image

  • Visualized detection method for online abnormal movements of power distribution automation graph and model

Examples


Embodiment Construction

[0032] The present invention will be further described below in conjunction with the accompanying drawings and embodiments.

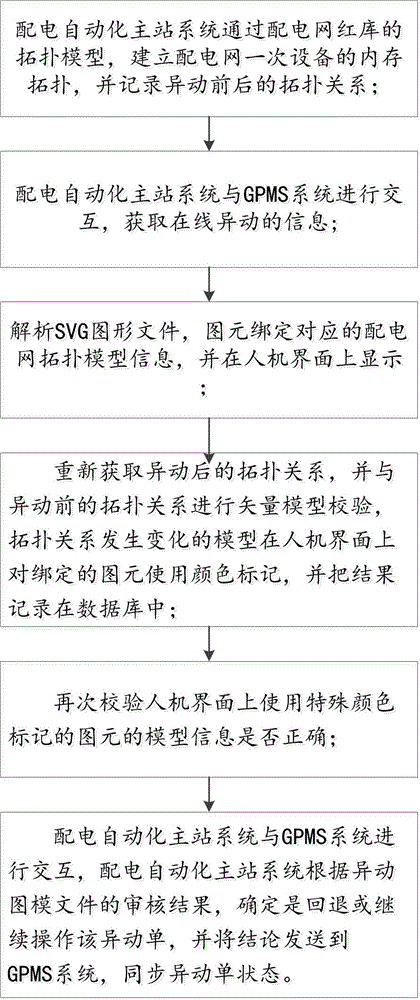
[0033] Such as figure 1 As shown, this embodiment provides a visual detection method for online abnormality of distribution automation graphics, which specifically includes the following steps:

[0034] Step S1: The distribution automation master station system establishes the memory topology of the primary equipment of the distribution network through the topology model of the distribution network red library, and records the topology relationship before and after the change;

[0035] Step S2: The distribution automation master station system interacts with the GPMS system to obtain online transaction information, the online transaction information includes a transaction message body, an SVG graphic file, and a CIM model file;

[0036] Step S3: Analyze the SVG graphic file in step S2, bind the graphic elements to the corresponding distribution network...


PUM


Abstract

The invention discloses a visualized detection method for online abnormal movements of a power distribution automation graph and model, comprising steps of using a topology model of a power distribution network red database in a power distribution automation master station to establish a memory topology of a primary device of the power distribution network, recording topology relations before the abnormal movement and after the abnormal movement, performing interaction with a GPMS system by the power distribution automation master station system to obtain an abnormal movement file, analyzing an SVG graph file to display on a man-machine interface, binding with corresponding topology model information by a primitive, performing verification on consistency of the graph and the model and using a color mark on the primitive according to the verification result, timely, fast and directly displaying the graph and model abnormal movement conditions to automation staff before a process of performing automation debugging, performing verification on consistency of the model topology, the graph and the model, and synchronizing an abnormal movement single condition to the GPMS system. The visualized detection method disclosed by the invention improves accuracy and timeliness of abnormal movements and greatly improves working efficiency of scheduling staff and automation staff.

Description

technical field [0001] The invention relates to the field of power system distribution automation, in particular to a visual detection method for online abnormality of a distribution automation graph. Background technique [0002] With the construction of power system distribution network system, there are more and more power grid equipment, and the frequency of abnormal changes is getting higher and higher, which puts forward higher and higher requirements for distribution network scheduling and automatic operation and maintenance, especially for the timeliness of graph and model changes , accuracy have put forward a lot of assessment indicators. [0003] It is mainly aimed at the graphic review environment of online changes in distribution network automation. Usually, the graphic review method for online changes in distribution network automation is: copy the online transaction graphic file to offline and use other tools for graphic review, or in the transaction When the...

Claims


Application Information

Patent Timeline
Patent Type & Authority Applications(China)
IPC IPC(8): G06Q50/06
CPCG06Q50/06
Inventor 李晨殷自力陈宇星宋福海李吉昌吴振文
Owner STATE GRID FUJIAN ELECTRIC POWER CO LTD
Why Eureka
Try Eureka