Blast vibration prediction system based on VB and Matlab
A prediction system and blasting vibration technology, applied in special data processing applications, instruments, biological neural network models, etc., can solve problems such as heavy workload, increased difficulty, and inconvenience in developing commercial software, and achieve convenient development and prediction calculations. Effect
- Summary
- Abstract
- Description
- Claims
- Application Information
AI Technical Summary
Problems solved by technology
Method used
Image

Examples
Embodiment 1
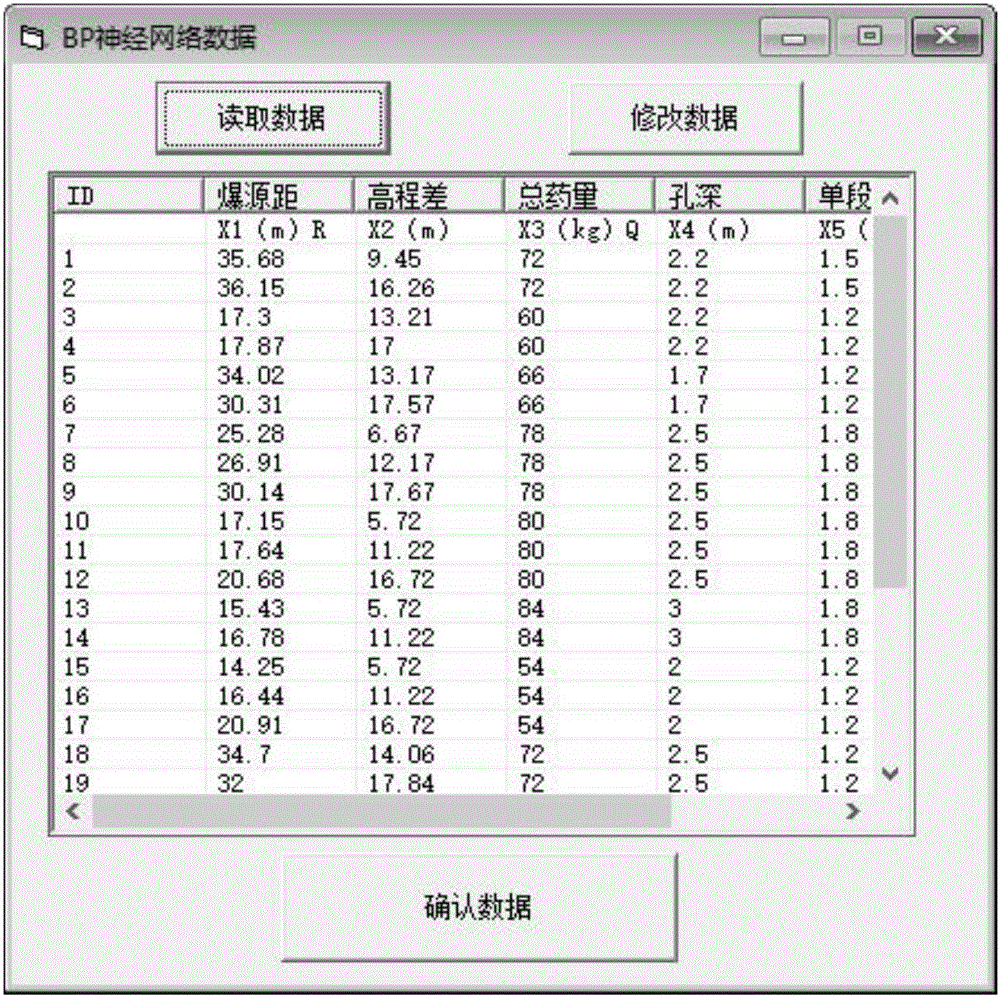
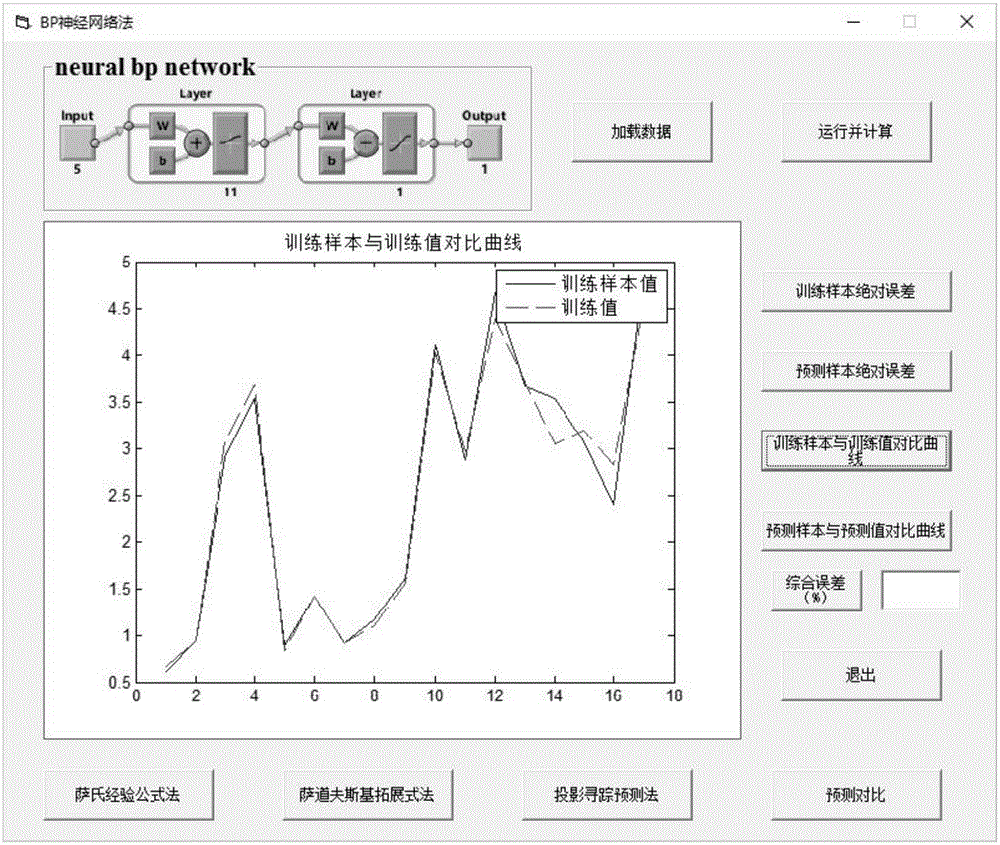
[0032] by figure 1 The login interface shown is to log in to the blasting vibration prediction system. The data needs to be loaded before the calculation of the BP neural network method. You can load and modify the BP data by clicking "Load Data" on the BP main interface. The BP neural network data form is designed as figure 2 As shown, after loading the data, you can call matlab to calculate, click "Run and calculate", the system will automatically perform the calculation, and the calculation result will be displayed on the main interface of the BP neural network method, such as image 3 As shown, the sample value can be obtained through calculation, and the comparison curve with the predicted value can be analyzed to determine the accuracy of the method by analyzing the prediction error, and the comprehensive error of the prediction can be accurately displayed.
Embodiment 2
[0034] Import data through VB, analyze the data, get the projection value and projection coefficient, and then predict and analyze the forecast data. The specific process of the system is as follows Figure 4 . The main interface of projection pursuit method can be obtained through software calculation, such as Figure 5 Shown. Through calculation, the sample value and the comparison curve with the predicted value can be obtained, the prediction error can be analyzed to judge the accuracy of the method, and the comprehensive error of the prediction can be accurately displayed.
Embodiment 3
[0036] By using the least squares method to fit the first 16 sets of data, the K and α values in the Sadowski formula are obtained. Then you can set up simple controls, enter the maximum charge of a single segment and the distance of the explosion source, calculate the peak value of the vibration speed, and display it as Image 6 The Sadowski formula method shown on the main interface. Through calculation, the sample value and the comparison curve with the predicted value can be obtained, the prediction error can be analyzed to judge the accuracy of the method, and the comprehensive error of the prediction can be accurately displayed.
PUM
 Abstract
Description
Claims
Application Information
 - R&D
- Intellectual Property
- Life Sciences
- Materials
- Tech Scout
- Unparalleled Data Quality
- Higher Quality Content
- 60% Fewer Hallucinations
Browse by: Latest US Patents, China's latest patents, Technical Efficacy Thesaurus, Application Domain, Technology Topic, Popular Technical Reports.
© 2025 PatSnap. All rights reserved.Legal|Privacy policy|Modern Slavery Act Transparency Statement|Sitemap|About US| Contact US: help@patsnap.com