Quantitative analysis method of metal phase volume fraction gradient distribution of cutting surface layer of duplex titanium alloy

A cutting and volume fraction technology, applied in material analysis using measurement of secondary emissions, material analysis, material analysis using wave/particle radiation, etc. resolution and other issues, to achieve the effect of high-precision identification, significant progress, and highlighting substantive characteristics

Active Publication Date: 2018-11-06
ANHUI UNIVERSITY
View PDF4 Cites 1 Cited by
  • Summary
  • Abstract
  • Description
  • Claims
  • Application Information

AI Technical Summary

Problems solved by technology

[0004] At present, the method for quantitative analysis of the metallographic volume fraction is mainly the X-ray diffraction method (XRD), but this method cannot be used to quantitatively describe the metallographic gradient distribution of the side section of the cutting sample. On the one hand, the X-ray diffractometer The focus size of the laser is relatively large, generally a long and narrow rectangle (millimeter level), and the measured metallographic volume fraction is the average value of this rectangular area. Micron scale), X-ray diffractometer is difficult to achieve such a high resolution

Method used


Image

  • Quantitative analysis method of metal phase volume fraction gradient distribution of cutting surface layer of duplex titanium alloy
  • Quantitative analysis method of metal phase volume fraction gradient distribution of cutting surface layer of duplex titanium alloy
  • Quantitative analysis method of metal phase volume fraction gradient distribution of cutting surface layer of duplex titanium alloy

Examples


Embodiment Construction

[0042] In order to clearly illustrate the technical features of the solution, the solution will be described below through a specific implementation mode combined with the accompanying drawings.
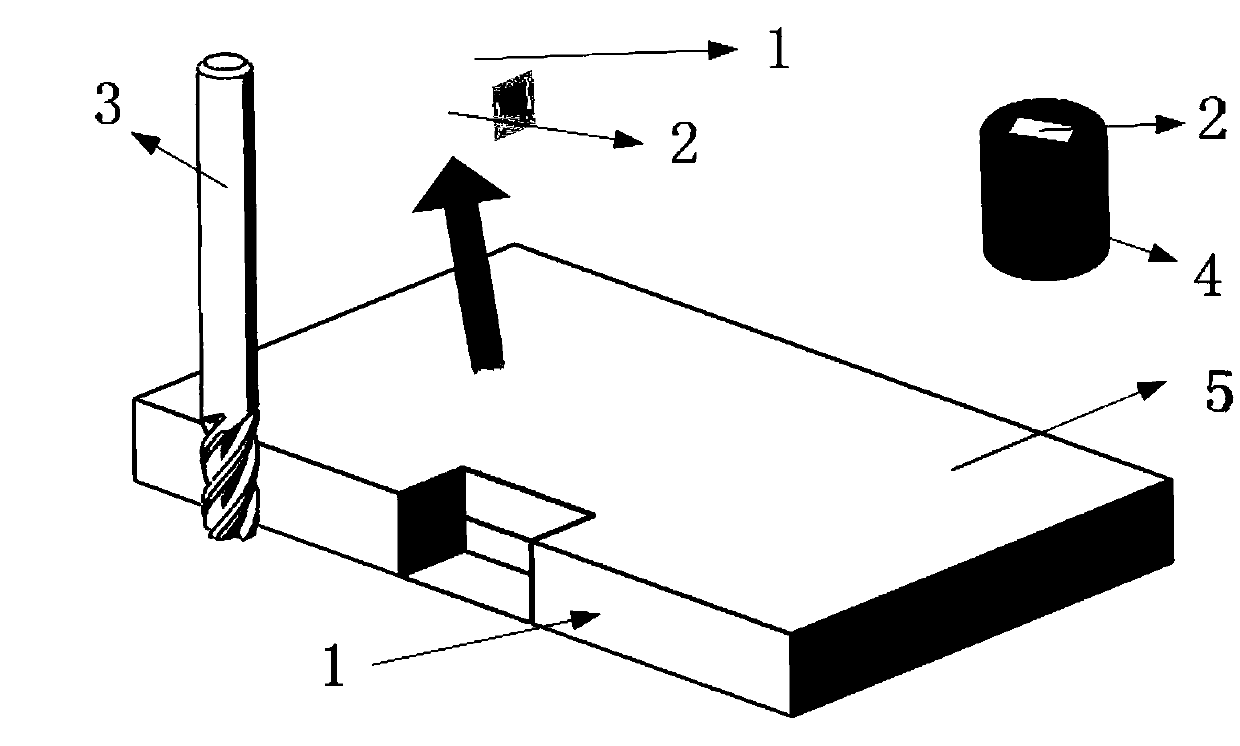
[0043] The middle area of ​​the processed surface of the workpiece is selected to make a rectangular sample by wire cutting, and the side sections are respectively used as the detection surface to inlay the test block. The schematic diagram of the test block sampling process is as follows: figure 1 shown. figure 1 The middle arrow 1 points to the cutting surface, the arrow 2 points to the side profile, the arrow 3 points to the cutting tool, the arrow 4 points to the mosaic test block, and the arrow 5 points to the processed titanium alloy material.

[0044] After grinding (2000 mesh sandpaper) and polishing, the test piece test surface was put into the corrosive solution at room temperature for 10 seconds. The formula and performance parameters of the corrosive solution are listed i...


PUM


Abstract

The invention discloses a quantitative analysis method of metal phase volume fraction gradient distribution of a cutting surface layer of a duplex titanium alloy. The method comprises: processing a titanium alloy cut sample into a test piece through wire-electrode cutting and inset, polishing and corroding the test piece to obtain a surface to be detected, scanning the surface to be detected through a scanning electron microscope to obtain an electron microscope image, converting the electron microscope image into a gray image through gray scale processing, trimming the electron microscope image to obtain an effective electron microscope image, dividing the effective electron microscope image into a phase region alpha and a phase region beta according to gray scales, carrying out binarization processing on the effective electron microscope image, carrying out dissociation layering along the cutting depth direction, counting the number of phase alpha pixels and phase beta pixels in eachlayered image, wherein the percentage of the phase alpha pixels and phase beta pixels in total pixels in each layered image is a volume fraction of the phase alpha and the phase beta in layered images, and acquiring the characteristic of the metal phase volume fraction gradient distribution of the side profile of a cut test sample according to the volume fractions of the phase alpha and phase beta in each layered image.

Description

technical field [0001] The invention relates to the technical field of characterization and evaluation of microstructure distribution characteristics of a metal material cutting surface layer, in particular to a quantitative analysis method for the metallographic volume fraction gradient distribution of a duplex titanium alloy cutting surface layer. Background technique [0002] According to the different metallographic types, titanium alloys can be divided into α-type titanium alloys, β-type titanium alloys and α+β-type titanium alloys. The physical and mechanical properties of the α+β duplex titanium alloy are not only affected by the properties of the α and β phases themselves, but also depend on the volume fraction of the α and β phases. [0003] The high temperature, high stress and high strain rate generated by the cutting process lead to phase transition of the machined surface layer material, resulting in the volume fraction of α and β phases in the machined surface ...

Claims


Application Information

Patent Timeline
Patent Type & Authority Applications(China)
IPC IPC(8): G01N23/22G01N23/227
CPCG01N23/22G01N23/2273
Inventor 杨东刘玉磊耿林陈蔚
Owner ANHUI UNIVERSITY
Why Eureka
Try Eureka