Gene expression time series data classification method based on visibility graph algorithm

A technology of gene expression and time series data, applied in the field of biological information, can solve the problems of noise interference, inability to mine and analyze time series data, etc.

Active Publication Date: 2018-11-20
ZHEJIANG UNIV OF TECH
View PDF4 Cites 9 Cited by
  • Summary
  • Abstract
  • Description
  • Claims
  • Application Information

AI Technical Summary

Problems solved by technology

[0004] However, time-series data usually has high-dimensional and large-scale features, and there is noise interference. Therefore, traditional data analysis and commonly used classic data mining algorithms cannot mine and analyze time-series data with complex structures well.

Method used


Image

  • Gene expression time series data classification method based on visibility graph algorithm
  • Gene expression time series data classification method based on visibility graph algorithm
  • Gene expression time series data classification method based on visibility graph algorithm

Examples


Embodiment Construction

[0081] In order to make the object, technical solution and advantages of the present invention clearer, the present invention will be further described in detail below in conjunction with the accompanying drawings and embodiments. It should be understood that the specific embodiments described here are only used to explain the present invention, and do not limit the protection scope of the present invention.

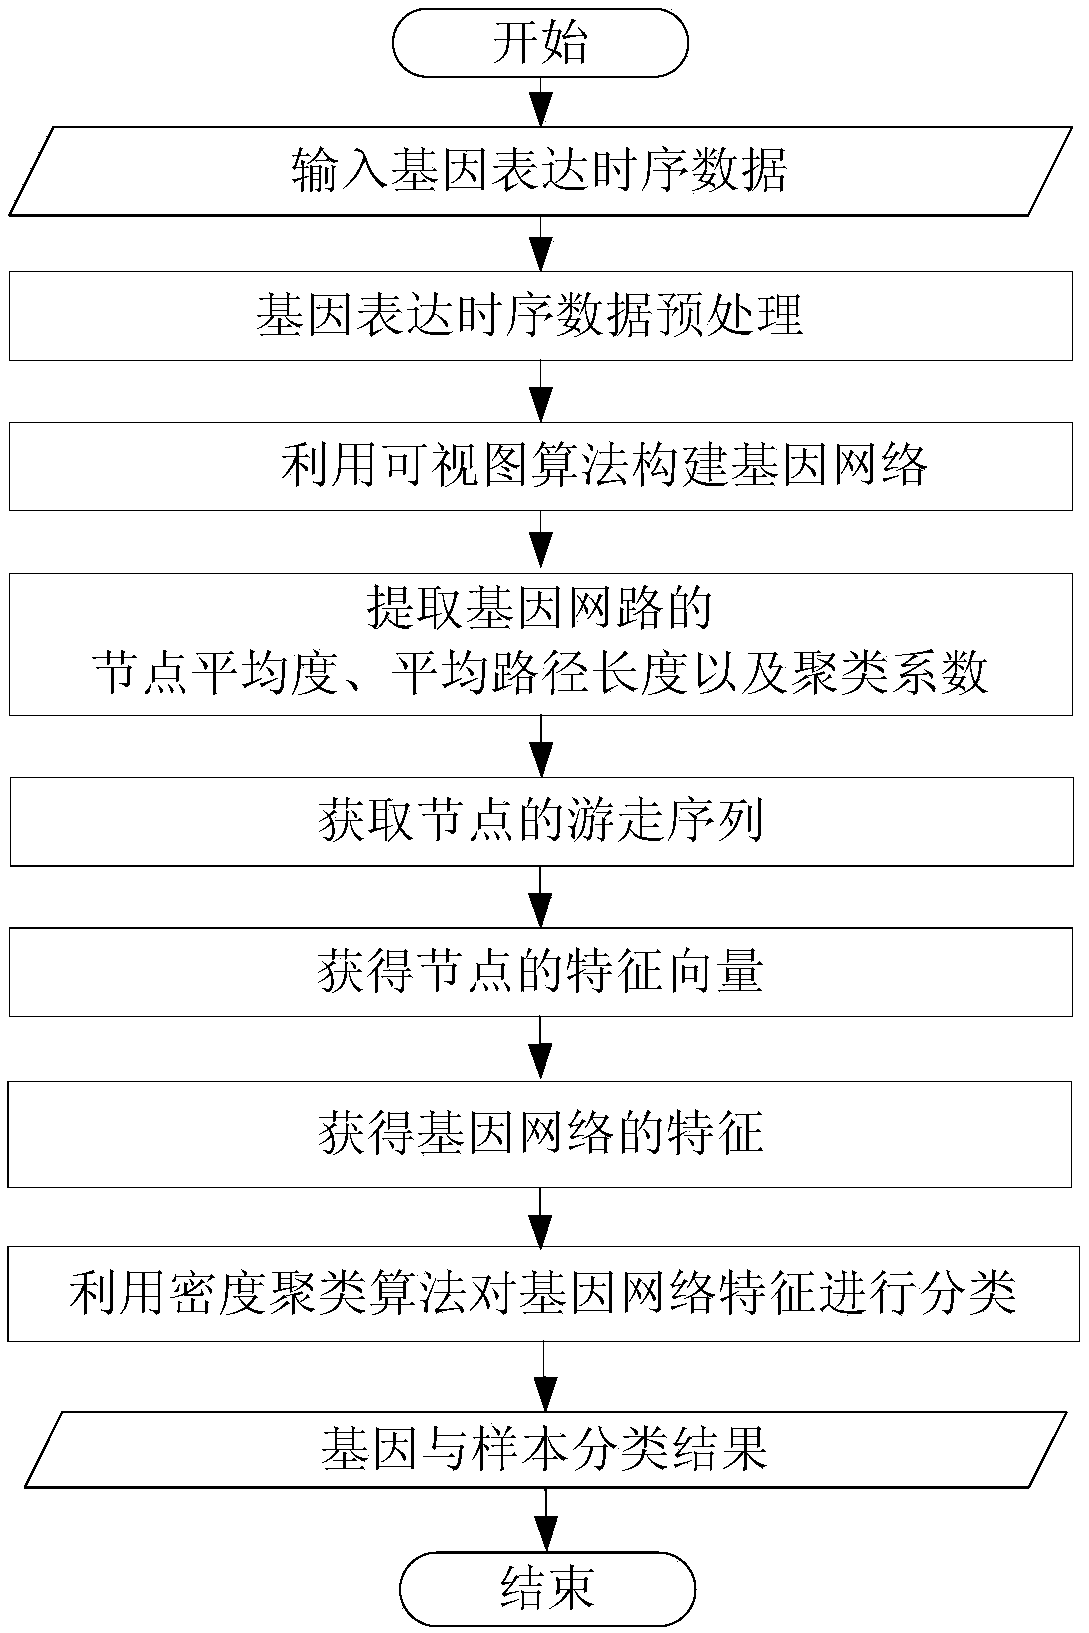
[0082] figure 1 It is a flow chart of the gene expression time-series data classification method based on the visualization algorithm provided by the present invention, see figure 1 The gene expression time-series data classification method based on the visualization algorithm provided in this embodiment includes the following steps:

[0083] S101, preprocessing the original gene expression time series data, the process is as follows:

[0084] First, clear the noise data with obvious abnormal expression level, and the gene expression time-series data is defined as GETD...


PUM


Abstract

The invention discloses a gene expression time series data classification method based on a visibility graph algorithm. The method comprises the steps of (1) constructing a basic network, selecting adata strip according to preprocessed gene expression time series data, constructing a visibility graph and a connection graph by using the visibility graph algorithm, and determining a basic structureof a co-expression network, (2) extracting relevant traditional features according to the obtained basic network, (3) obtaining a feature vector of each gene node in the basic network by using second-order random walk and neural network model learning, and (4) integrating features of the basic network and using different strategies based on the obtained features of the basic network through a density clustering algorithm to complete the classification of gene expression time series data. The invention provides a method for realizing the gene expression time series data classification by usingvisibility graph foundation network construction, node feature vector extraction and the density clustering algorithm, and the method has good precision and practical performance.

Description

technical field [0001] The invention belongs to the technical field of biological information, and in particular relates to a gene expression time-series data classification method based on a visual map algorithm. Background technique [0002] In today's medical research field and big data analysis field, genetic data plays a vital role as the data basis. Among them, gene expression data, as a reflection of the abundance of gene transcription product mRNA in cells, can be used to analyze changes in gene expression, inter-gene relationships, and environmental factors that affect gene expression. They have important applications in medical clinical diagnosis, judgment of drug efficacy, and revealing the mechanism of disease occurrence. [0003] At present, the methods for high-throughput detection of genomic mRNA abundance are mainly cDNA microarrays and oligonucleotide chips. Quantitative or qualitative detection of gene transcription product mRNA. Due to the variety of ce...

Claims


Application Information

Patent Timeline
Patent Type & Authority Applications(China)
IPC IPC(8): G06F19/24G06F19/22
Inventor 陈晋音郑海斌王桢应时彦李南
Owner ZHEJIANG UNIV OF TECH
Why Eureka
Try Eureka