

Method for detecting faulty operation of gas blower driven by DC motor
A technology of DC motors and electric motors, which is applied in the direction of motor control, motor generator testing, and transmission machinery dedicated to glass blowing machines. It can solve problems such as increased bearing friction, decreased magnet strength, and weakened magnetic field to prevent excessive heating. , reducing the effect of the application
- Summary
- Abstract
- Description
- Claims
- Application Information
AI Technical Summary
Problems solved by technology
Method used
Image

Examples
Embodiment Construction
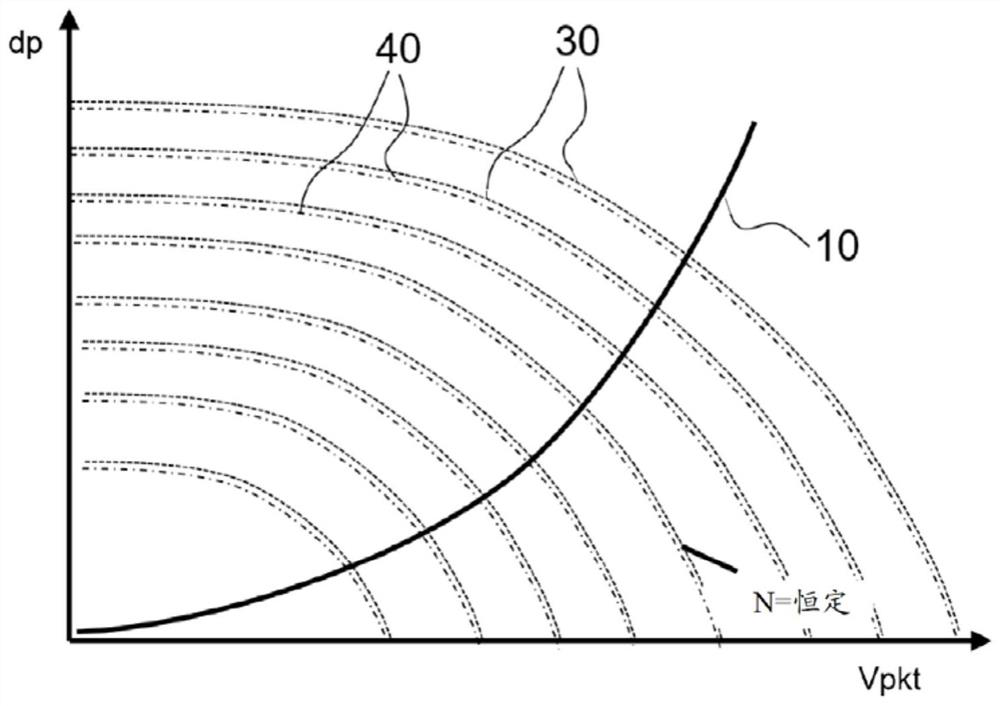
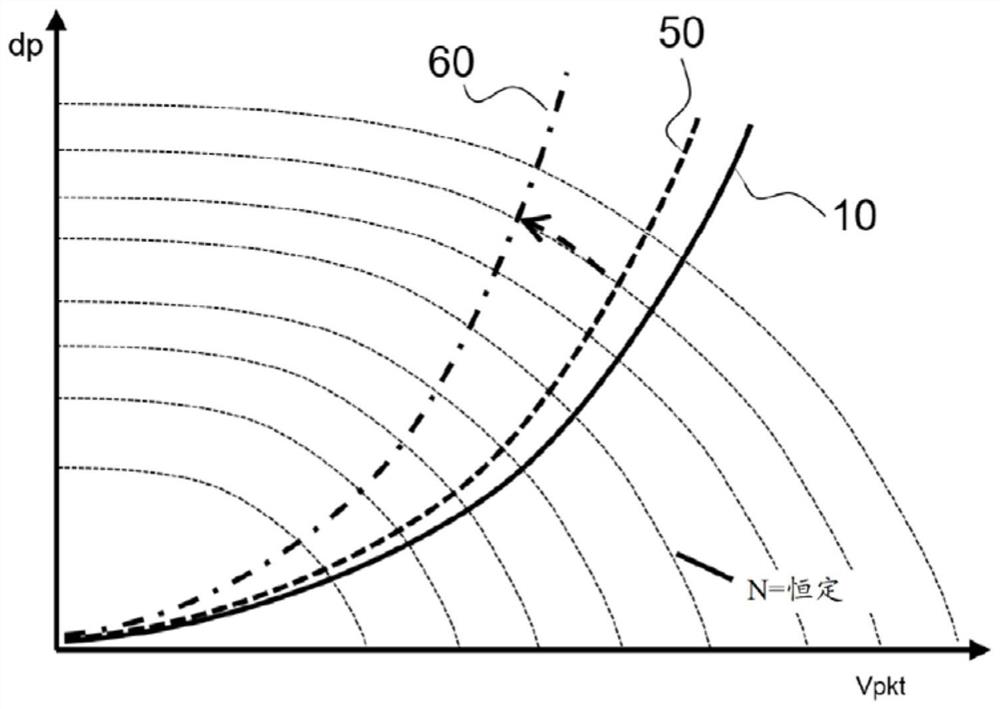
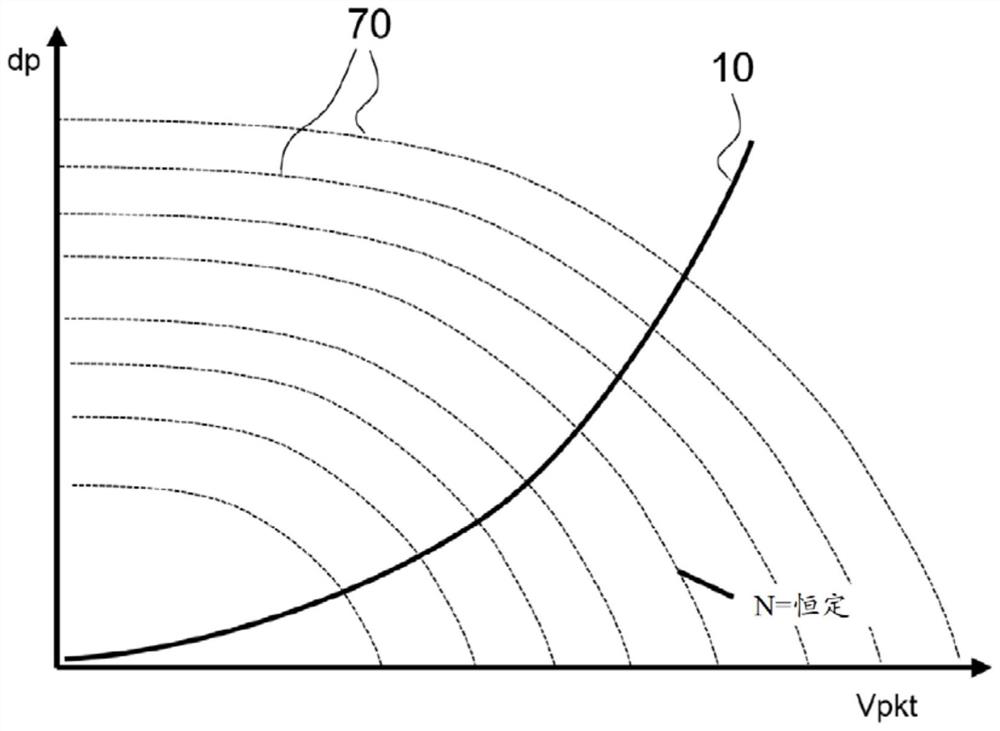
[0022] Figure 1 to Figure 3 The graphs respectively show the fan characteristic curve and the plant characteristic curve of a gas fan formed as a radial fan in the presence of various defect types as influencing variables, wherein the ordinate is the boost dp, and the abscissa is the delivery volume flow Vpkt.
[0023] figure 1 The disadvantageous case of a change in air density is shown schematically as an example. The plant characteristic curve 10 (also called "system characteristic curve") is simply assumed to be constant. Furthermore, the reference characteristic curve 30 and the lower air density characteristic curve 40 are each represented as a reference variable at a constant rotational speed N.
[0024] figure 2 shows the rising pressure loss due to a system-related defect situation (such as a clogged exhaust pipe on the heating boiler or a dirty heat exchanger) that makes the nominal plant characteristic curve 10 when the gas blower starts with the heating boiler...
PUM
 Abstract
Description
Claims
Application Information