Biomarkers and their applications for diagnosing the onset of nervonic acid in maple seed oil

A biomarker and nervonic acid technology, applied in biological testing, instruments, measuring devices, etc., can solve problems that are unclear and rarely studied

Active Publication Date: 2020-11-20
BAO FENG BIOTECH (BEIJING) CO LTD
4 Cites 0 Cited by

AI-Extracted Technical Summary

Problems solved by technology

After taking Yuanbao Maple Seed Oil, whether the unique ingredient contained in it-neuric acid can be absorbed and utilized by the body, and at the same time, what structural metabolites w...

Abstract

The present invention provides biomarkers for diagnosing the onset of nervonic acid in Ingot maple seed oil, the biomarkers include SM(d17:1/24:1) or/and Cer(d18:1/24:1(15Z )). The invention also provides the application of the biomarker in the preparation of detection reagents. The biomarkers provided by the present invention for diagnosing the onset of nervonic acid in maple seed oil can be used to judge whether nervonic acid is absorbed and transformed by the body, and provide guidance for whether nervonic acid plays a role after eating maple seed oil .

Application Domain

Component separationBiological testing

Technology Topic

Nervonic acidAcer truncatum +3

Image

  • Biomarkers and their applications for diagnosing the onset of nervonic acid in maple seed oil
  • Biomarkers and their applications for diagnosing the onset of nervonic acid in maple seed oil
  • Biomarkers and their applications for diagnosing the onset of nervonic acid in maple seed oil

Examples

  • Experimental program(4)
  • Effect test(1)

Example Embodiment

[0028] Example 1
[0029] 1. Sample collection
[0030] Thirty male SD rats aged 5-6 weeks were randomly divided into 2 groups: Acer truncatum seed oil group (NA group) and normal control group (CK group). Rats in each group were adaptively fed for 1 week and then entered the experiment. Acer truncatum seed oil group calculated the dosage according to the method of drug dosage conversion between human and rat. The dosage was 0.03g/kg/d of nervonic acid contained in gavage, once a day, and blood was collected after 1 day of continuous administration. The normal control group was raised routinely and the sampling method was the same as above.
[0031] 2. Experimental equipment and reagents:
[0032] laboratory apparatus:
[0033] 1. Refrigerated centrifuge: Model D3024R, Scilogex, USA;
[0034] 2. Vortex oscillator: model MX-S, Scilogex, USA;
[0035] 3. High resolution mass spectrometer: ESI-QTOF/MS; Model: Xevo G2-S Q-TOF; Manufacturer: Waters, Manchester, UK;
[0036] 4. Ultra performance liquid chromatography: UPLC; Model: ACQUITY UPLC I-Class system; Manufacturer: Waters, Manchester, UK;
[0037] 5. Data acquisition software: MassLynx4.1; Manufacturer: Waters
[0038] 6. Analysis and identification software: Progenesis QI; Manufacturer: Waters;
[0039] Experimental reagents:
[0040] Isopropanol, acetonitrile, formic acid, ammonium formate, leucine enkephalin, sodium formate. All manufacturers are Fisher.
[0041] 3. Experimental method
[0042] 1. Sample pretreatment
[0043] The collected serum samples were thawed on ice, 200μL of plasma was extracted with 600μL of pre-chilled isopropanol, vortexed for 1min, incubated at room temperature for 10min, then the extraction mixture was stored at -20℃ overnight, centrifuged at 4000r for 20min, and the supernatant Transfer to a new centrifuge tube and dilute to 1:10 with isopropanol/acetonitrile/water (2:1:1, v:v:v). The samples were stored at -80°C before LC-MS analysis. In addition, 10 μL of each extraction mixture was combined to prepare a mixed plasma sample.
[0044] 2. Lipidomics Ultra Performance Liquid Chromatography-Mass Spectrometry Method
[0045] The mixed plasma samples were analyzed by ACQUITY UPLC (Waters, USA) connected to a Xevo-G2XS high resolution time-of-flight (QTOF) mass spectrometer (Waters) with ESI. Using CQUITY UPLC BEH C18 column (2.1×100 mm, 1.7μm, Waters), the mobile phase is 10 mM ammonium formate-0.1% formic acid-acetonitrile (A, 60:40, v/v) and 10 mM ammonium formate- 0.1% formic acid-isopropanol-acetonitrile (B, 90:10, v/v). Prior to the large-scale study, pilot experiments including washout periods of 10 minutes, 15 minutes, and 20 minutes were conducted to evaluate the potential impact of mobile phase composition and flow rate on lipid retention time. In PIM, the abundant lipid precursor ions and fragments are separated in the same order, with similar peak shapes and ionic strengths. In addition, the mixed quality control (QC) with a 10-minute washout period also showed the base peak intensity of precursors and fragments similar to the test sample. The mobile phase flow rate is 0.4 mL/min. The column was initially eluted with 40% B, then a linear gradient to 43% B within 2 minutes, and then the percentage of B was increased to 50% within 0.1 min. In the next 3.9 minutes, the gradient further increased to 54% B, and then the amount of B increased to 70% in 0.1 minutes. In the last part of the gradient, the amount of B increased to 99% in 1.9 minutes. Finally, solution B returned to 40% within 0.1 minutes, and the column was equilibrated for 1.9 minutes before the next injection. Each injection volume is 5μL, and Xevo-G2XS QTOF mass spectrometer is used to detect lipids in both positive and negative modes. The acquisition range is m/z50~1200, and the acquisition time is 0.2s/time. The ion source temperature is 120°C, the desolventizing temperature is 600°C, the gas flow rate is 1000L/h, and nitrogen is used as the flowing gas. The capillary voltage is 2.0kV(+)/the cone voltage is 1.5kV(-), and the cone voltage is 30V. The standard mass was measured with leucine enkephalin and corrected with sodium formate solution. The samples are sorted randomly. Every 10 samples are injected into a quality control (QC) sample and analyzed to investigate the repeatability of the data.
[0046] Fourth, the result
[0047] 1. Use multivariate statistics to find serum differences
[0048] Orthogonal Partial Least Squares Discriminant Analysis (OPLS-DA) combines orthogonal signal correction (OSC) and Partial Least Squares Regression Analysis (PLS-DA) methods to screen difference variables by removing irrelevant differences. As shown in the attached picture: figure 1 It is a metabolite with VIP>1 in positive and negative ion mode, where A is positive ion mode, B is negative ion mode, VIP value is the variable importance projection of the first principal component of orthogonal partial least squares discriminant analysis (OPLS-DA), Usually with VIP> 1 is a commonly used evaluation criterion for metabolomics, as one of the criteria for screening differential metabolites; figure 2 The score graph of (O)PLS-DA in positive and negative ion mode, C is the score graph of (O)PLS-DA in positive ion mode, (in the figure, NA represents the Acer truncatum seed oil group, CK represents the blank control group) and D is The score map of (O)PLS-DA in negative ion mode, that is, the score map of the first principal component and the second principal component in the two groups through dimensionality reduction. The abscissa indicates the difference between the groups, and the ordinate indicates the intra-group The difference and the good separation of the two sets of results indicate that this scheme can be used. image 3 S-plot in the positive and negative ion mode, E is the S-plot in the positive ion mode, and the S-plot in the negative ion mode. The abscissa represents the co-correlation coefficient between the principal component and the metabolite, and the ordinate represents the principal component and metabolism. The correlation coefficient of objects, while satisfying p <0.05, VIP> Under the condition of 1, there are 24 differences in the negative ion mode and 49 differences in the positive ion mode. In order to further narrow the scope, the VIP threshold was increased to 5, and at the same time, it reflected that the multiple difference between normal and model was less than 0.7 times, or increased by more than 1.4 times, and finally the following 5 compounds were obtained: TG(16:1(9Z)/22 :5(7Z,10Z,13Z,16Z,19Z)/22:6(4Z,7Z,10Z,13Z,16Z,19Z)), TG(18:3(6Z,9Z,12Z)/20:3(8Z) ,11Z,14Z)/20:4,(5Z,8Z,11Z,14Z)), TG(14:1(9Z)/20:2(11Z,14Z)/22:5(7Z,10Z,13Z,16Z ,19Z)), TG(16:0/20:3(8Z,11Z,14Z)/22:6(4Z,7Z,10Z,13Z,16Z,19Z)), TG(16:1(9Z)/18 :4(6Z,9Z,12Z,15Z)/22:1(11Z)).
[0049] 2. Yoden analysis
[0050] For 5 compounds, calculate the Youden Index, and use AUC to reflect the overall diagnostic and predictive effect of a single index, so as to determine that these indexes are molecular markers. The results are shown in Table 1.
[0051] Table 1 Yoden index analysis of related lipids after supplementation of Acer truncatum seed oil for 1 day
[0052] Numbering Compound name AUC value Specificity Sensitivity R1 TG(16:1(9Z)/22:5(7Z,10Z,13Z,16Z,19Z)/22:6(4Z,7Z,10Z,13Z,16Z,19Z)) 0.96 0.8 1 R2 TG(18:3(6Z,9Z,12Z)/20:3(8Z,11Z,14Z)/20:4(5Z,8Z,11Z,14Z)) 0.96 0.8 1 R3 TG(14:1(9Z)/20:2(11Z,14Z)/22:5(7Z,10Z,13Z,16Z,19Z)) 1 1 1 R4 TG(16:0/20:3(8Z,11Z,14Z)/22:6(4Z,7Z,10Z,13Z,16Z,19Z)) 0.92 0.8 1 R5 TG(16:1(9Z)/18:4(6Z,9Z,12Z,15Z)/22:1(11Z)) 0.88 0.8 1
[0053] Table 1 lists the area under the curve (AUC), sensitivity, and specificity of a single metabolite that is predicted to be supplemented with Acer truncatum seed oil for one day. The relevant parameters show that among the above five lipids, R3 has the best predictive ability (AUC=1 ).
[0054] The results proved that the above 5 compounds are the molecular markers specifically appearing in the blood after taking Acer truncatum seed oil for one day, and they do not contain the 24:1 structure compound, indicating that they have not yet worked.

Example Embodiment

[0055] Example 2
[0056] In this example, on the basis of Example 1, blood collected after 3 consecutive days of administration was used to analyze the test results. The experimental operation and method are the same as in Example 1. The results are as follows:
[0057] 1. Use multivariate statistics to find serum differences
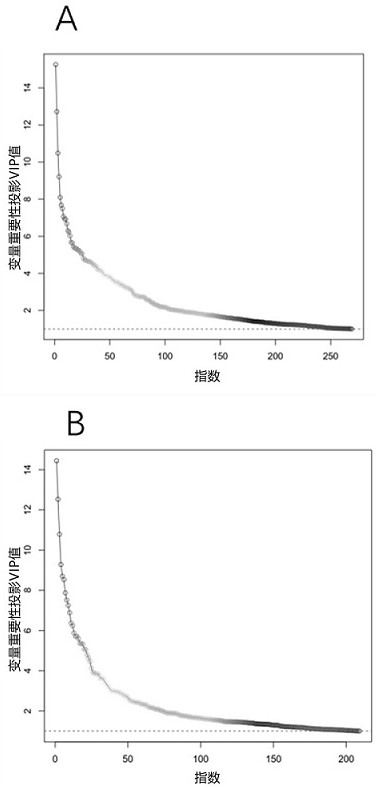
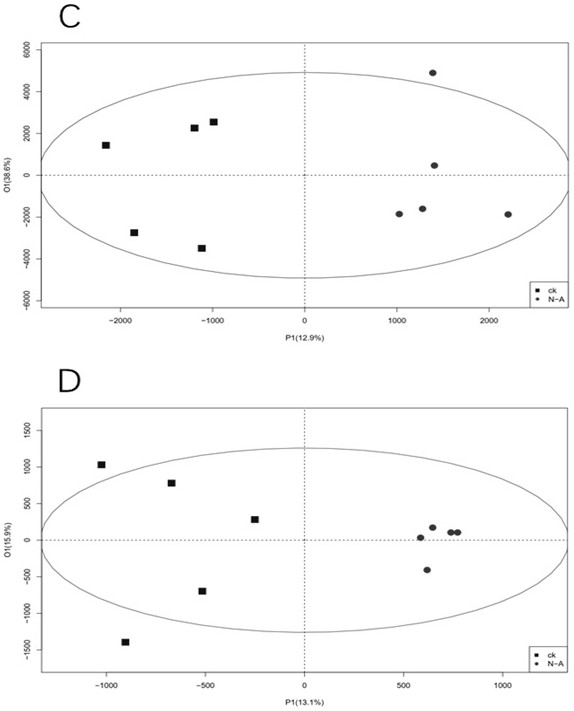
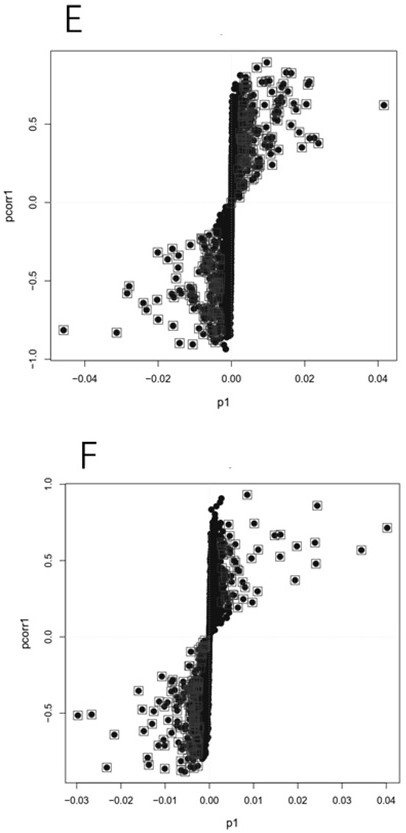
[0058] Orthogonal Partial Least Squares Discriminant Analysis (OPLS-DA) combines orthogonal signal correction (OSC) and Partial Least Squares Regression Analysis (PLS-DA) methods to screen difference variables by removing irrelevant differences. The result is Figure 4 , Where A is VIP in positive ion mode> Metabolite of 1, B is VIP in negative ion mode> 1 metabolite, VIP value is the variable importance projection of the first principal component of orthogonal partial least squares discriminant analysis (OPLS-DA), usually VIP> 1 is a commonly used evaluation criterion for metabolomics, as one of the criteria for screening differential metabolites; Figure 5 It is the score map of the first principal component and the second principal component in the two groups of Acer truncatum seed oil group (NA) and the blank control group (CK) through dimensionality reduction, where C is the positive ion mode (O) PLS-DA score chart, D is the score chart of (O) PLS-DA in negative ion mode; the abscissa represents the difference between groups, the ordinate represents the difference within the group, and the two groups are separated well, indicating this plan can use. Image 6 S-plot, E is the S-polt chart in the positive ion mode, F is the S-polt chart in the positive ion mode, the abscissa represents the co-correlation coefficient between the principal component and the metabolite, and the ordinate represents the principal component and metabolism The correlation coefficient of objects, while satisfying p <0.05, VIP> Under the condition of 1, there are 73 differences in the negative ion mode and 65 differences in the positive ion mode. In order to further narrow the scope, the VIP threshold was increased to 5, and it also reflected that the multiple difference between the normal and the model was less than 0.7 times, or increased by more than 1.4 times, and finally the following 9 compounds were obtained: SM(d17:1/24:1) , 18:1-Glc-Campesterol; Cer(d18:1/24:1(15Z)); PI(18:0/20:3(8Z,11Z,14Z)); PS(21:0/20:2 (11Z,14Z)); SM(d18:2/24:0); TG(17:2(9Z,12Z)/18:1(9Z)/22:1(11Z))[iso6]; PC(20 :5(5Z,8Z,11Z,14Z,17Z)/20:3(8Z,11Z,14Z)); PC(20:3(5Z,8Z,11Z)/18:0).
[0059] 2. Yoden analysis
[0060] Then calculate the Youden Index for 9 compounds to reflect the overall diagnostic and predictive effect of a single index and determine the molecular markers. The results are shown in Table 2.
[0061] Table 2 Yoden index analysis of related lipids after 3 days of supplementation of Acer truncatum seed oil
[0062]
[0063] Table 2 lists the area under the curve (AUC), sensitivity and specificity of single metabolites predicted to take supplemented Acer truncatum seed oil for 3 days. The relevant parameters show that among the above 9 lipids, R1, R2, R3, R6 and R7 The prediction ability is the best (AUC=1), indicating that they are molecular markers in the blood. The content of 24:1 in R1 and R3 means that it contains nervonic acid chain, which means that taking Acer truncatum seed oil starts to have an effect.

Example Embodiment

[0064] Example 3
[0065] In this example, on the basis of Example 1, blood collected after 7 days of continuous administration was used to analyze the test results. The experimental operation and method are the same as in Example 1. The results are as follows:
[0066] 1. Use multivariate statistics to find serum differences
[0067] Orthogonal Partial Least Square Discriminant Analysis (OPLS-DA) combines orthogonal signal correction (OSC) and PLS-DA methods to screen difference variables by removing irrelevant differences. The result is Figure 7 It is a metabolite with VIP>1 in the positive and negative ion mode, where A is the positive ion mode, B is the negative ion sample, and the VIP value is the variable importance projection of the first principal component of the orthogonal partial least squares discriminant analysis (OPLS-DA) , Usually with VIP> 1 is a commonly used evaluation criterion for metabolomics, as one of the criteria for screening differential metabolites; Figure 8 The score map of (O)PLS-DA in the positive and negative ion mode, where C is the score map of (O)PLS-DA in the positive ion mode, (NA in the figure represents the Acer truncatum seed oil group, CK represents the blank control group) and D is the score chart of (O)PLS-DA in the negative ion mode, that is, the first and second principal components in the two groups of the Acer truncatum seed oil group (NA) and the blank control group (CK) In the score chart obtained by the way of dimensionality, the abscissa indicates the difference between the groups, and the ordinate indicates the difference within the group, and the results of the two groups are well separated, indicating that this scheme can be used. Picture 9 It is the S-plot diagram in the positive and negative ion mode, where E is the S-polt diagram in the positive ion mode, F is the S-polt diagram in the negative ion mode, the abscissa represents the co-correlation coefficient of the principal component and the metabolite, and the ordinate Represents the correlation coefficient between the principal component and the metabolite, and satisfies p <0.05, VIP> Under the condition of 1, there are 51 differences in the negative ion mode and 21 differences in the positive ion mode. In order to further narrow the scope, the VIP threshold was increased to 5, and at the same time, it reflected that the multiple difference between the normal and the model was less than 0.7 times, or increased by more than 1.4 times, and finally the following 4 compounds were obtained: SM(d17:1/24:1) , 1,2-didocosanoyl-sn-glycero-3-phosphosulfocholine, Cer (d18:1/24:1(15Z)), SM (d18:2/24:0).
[0068] 2. Yoden analysis
[0069] Then calculate the Youden Index for these 4 compounds to reflect the overall diagnostic and predictive effect of a single index. The results are shown in Table 3.
[0070] Table 3 Yoden index analysis of related lipids 7 days after supplementation of Acer truncatum seed oil
[0071] Numbering Compound name AUC value Specificity Sensitivity R1 SM(d17:1/24:1) 1 1 1 R2 1,2-didocosanoyl-sn-glycero-3-phosphosulfocholine 1 1 1 R3 Cer(d18:1/24:1(15Z)) 1 1 1 R4 SM(d18:2/24:0) 1 1 1
[0072] Table 3 lists the area under the curve (AUC), sensitivity and specificity of a single metabolite predicted to take supplemented Acer truncatum seed oil for 7 days. The relevant parameters show that among the above four lipids, SM (d17:1/24:1) , 1,2-didocosanoyl-sn-glycero-3-phosphosulfocholine, Cer(d18:1/24:1(15Z)) and SM(d18:2/24:0) have the best predictive ability (AUC=1), Explain that they are all molecular markers of blood. The SM (d17:1/24:1) and Cer (d18:1/24:1(15Z)) contain 24:1, which means that it contains nervonic acid chains, indicating that the effect has occurred after taking the Acer truncatum seed oil.

PUM

no PUM

Description & Claims & Application Information

We can also present the details of the Description, Claims and Application information to help users get a comprehensive understanding of the technical details of the patent, such as background art, summary of invention, brief description of drawings, description of embodiments, and other original content. On the other hand, users can also determine the specific scope of protection of the technology through the list of claims; as well as understand the changes in the life cycle of the technology with the presentation of the patent timeline. Login to view more.
Why Eureka
Try Eureka