Biosensor for targeting cancer cells based on DNA triangular prism structure conformation change
A technology for biosensors and cancer cells, applied in the field of biosensors, can solve the problems of excessive nanostructure stability and low space utilization, and achieve the effects of fast detection speed, fast response speed, and sensitive detection.
- Summary
- Abstract
- Description
- Claims
- Application Information
AI Technical Summary
Problems solved by technology
Method used
Image
Examples
Embodiment 1
[0035] Example 1 Preparation of triangular prism nanostructure
[0036] (1) Synthesize T1, T2, S1, S2, S3, and S4 according to the sequence of SEQ ID NO: 1-6, wherein the 5' and 3' ends of S4 are respectively modified with CY3 and CY5;
[0037] With 1× TAE solution (pH 8.0, containing 10 mM Mg 2+ ) were prepared into dilutions with a concentration of 100 µM;
[0038] (2) Take sterilized EP tubes, add 5 μL of T1, T2, S1, S2, S3, and S4 solutions respectively, make up to 50 μL with sterilized water, keep warm at 95°C for 10 min, gradually cool to room temperature, and anneal to obtain three Solution (10 µM) of prismatic nanostructures.
Embodiment 2
[0039] Embodiment 2 detects the screening of pH condition
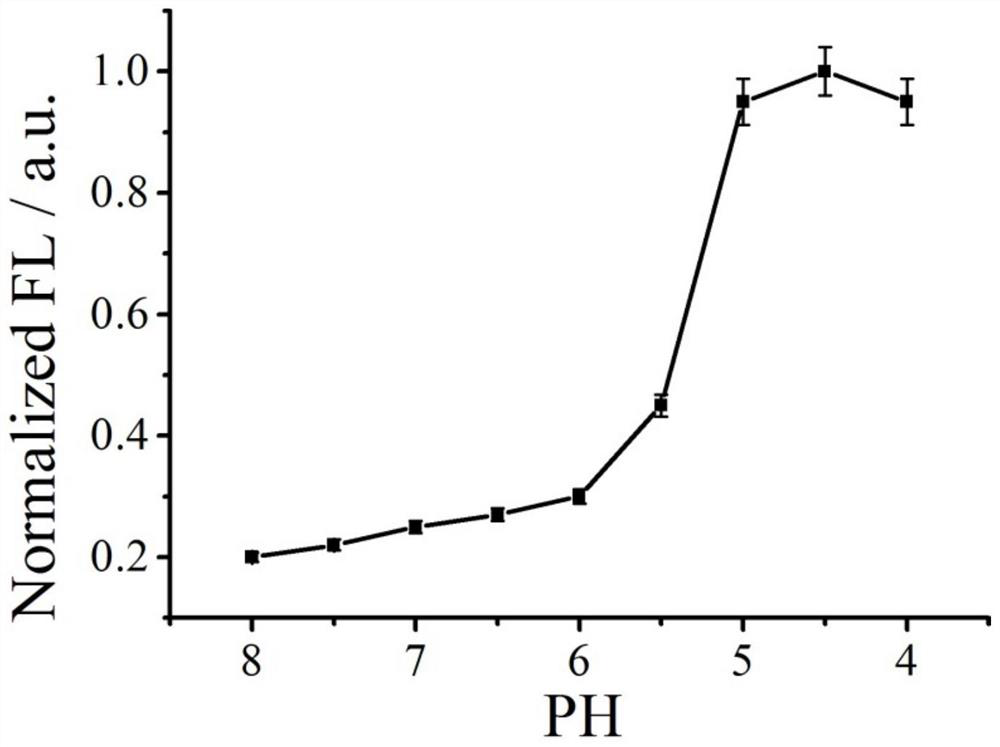
[0040] (1) Configuration buffer, containing MgAc 2 (10 mM), KAc 2 (140 nM), EDTA (0.1 mM), the pH of the solution was adjusted to 4, 4.5, 5, 5.5, 6, 6.5, 7, 7.5 and 8 with acetic acid or potassium hydroxide, respectively.
[0041] (2) Add 5 µL of buffer solutions with different pHs to 9 sterilized EP tubes, add 5 µL of the solution containing triangular prism nanostructures in Example 1, and shake for 30 s;
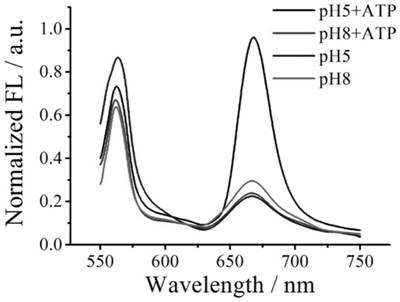
[0042] (3) Add 5 μL of 10 mM ATP solution, and place the centrifuge tube in a water bath at 37°C for 2 h; after the reaction, use F-4600 fluorescence spectrum detection at room temperature (excitation wavelength 525 nm, fluorescence emission spectrum scanning range 550 -750 nm, slit 1 nm);
[0043] The fluorescence intensity at 667nm of the pH 4.5 buffer is 1, and the normalized fluorescence intensity is calculated. See the results in figure 2 , it can be seen from the figure that the detected fluorescent si...
Embodiment 3
[0044] Example 3 ATP concentration screening
[0045] (1) Add 5 µL of the pH 5 buffer solution prepared in Example 2 to 12 sterilized EP tubes, add 5 µL of the solution containing triangular prism nanostructures in Example 1, and shake for 30 s;
[0046] (2) Add 5 μL of 0, 0.1, 0.2, 0.4, 0.6, 0.8, 1, 2, 4, 6, 8, 10 mM ATP solution, and place the centrifuge tube in a water bath at 37°C for 2 h; At room temperature, use F-4600 fluorescence spectrum detection (excitation wavelength 525 nm, fluorescence emission spectrum scanning range 550-750 nm, slit 1 nm);
[0047] Taking the fluorescence intensity at 667 nm of the test solution with an ATP concentration of 10 mM as 1, the normalized fluorescence intensity was calculated, and the results are shown in image 3 , it can be seen from the figure that the detected fluorescence signal increases as the concentration of ATP increases in the range of 0-10 mM, and when the concentration reaches 10 mM, the fluorescence signal reaches the...
PUM
 Abstract
Description
Claims
Application Information
 - R&D
- Intellectual Property
- Life Sciences
- Materials
- Tech Scout
- Unparalleled Data Quality
- Higher Quality Content
- 60% Fewer Hallucinations
Browse by: Latest US Patents, China's latest patents, Technical Efficacy Thesaurus, Application Domain, Technology Topic, Popular Technical Reports.
© 2025 PatSnap. All rights reserved.Legal|Privacy policy|Modern Slavery Act Transparency Statement|Sitemap|About US| Contact US: help@patsnap.com


