System and method for unsupervised anomaly detection

a technology of anomaly detection and system, applied in the field of systems and methods, can solve the problems of difficult task of detecting anomalies, difficult and most of the time impossible for an ai engineer to obtain examples of labeled anomalous data, and anomalies can occur in data, so as to improve the true positive rate of the model, improve the accuracy of the model, and improve the effect of the true positive ra

Active Publication Date: 2021-03-23
EUGENIE AI INC
View PDF1 Cites 19 Cited by
  • Summary
  • Abstract
  • Description
  • Claims
  • Application Information

AI Technical Summary

Benefits of technology

[0028]The present invention provides a Deep-UAD architecture which is an ensemble of five different GANs namely, LSTM-LSTM, GRU-LSTM, GRU-GRU LSTM-MLP, GRU-MLP GANs. It has been demonstrated through rigorous experimentations that, the GAN architectures wherein the discriminator network is an LSTM / GRU network, the performance is far better compared to the case when the discriminator network is an MLP. Although MLP based generator, when used in conjunction with LSTM / GRU based discriminator, performs far better. The threshold on the combined score is set using Youden's statistics to improve the true positive rate of the model without increasing the number of false alarms drastically. The proprietary Deep-UAD model gives good performance across metrics and this is achieved with a very good AUC score indicating the good class separation capabilities of the proposed model.

Problems solved by technology

For example in credit card fraud detection system anomalies can occur in the data because of malicious online activity, cyber-attacks, terrorist activity, and a system / sub-systems failure.
Since the occurrence of an anomaly is an example of a rare event so, it becomes hard and most of the time impossible for an AI engineer to obtain examples of labeled anomalous data.
Several factors make the task of detecting anomalies difficult as compared to the other binary classification problems.
First, defining a region in feature space which encompasses all the possible normal behavior is a very difficult task in itself.
Often, the observations coming from the sensing devices that are the part IoT network contains a lot of noise which can be misunderstood as an anomaly by the anomaly detection system.
So, there is also an obvious challenge that comes as a result of noise in the data.
These reasons along with several other factors render the task of anomaly detection a challenging problem.
In most of the practical situations occurrence of anomaly is a rare event so obtaining the labels for the anomalous data instance is not possible.
Principal component analysis (PCA), inherently being a linear-transformation, has shown to perform badly in the presence of trends or non-stationarity in the data.
The performance of detecting anomalies also reduces greatly when the data is de-rived from a distribution that deviates from multivariate Gaussian distribution.
These approaches, like their batch-processing counterparts, suffer a lot, performance-wise, in the presence of trend and non-stationary patterns present in the data.
In summary, anomaly detection approaches based on linear-models perform badly in the presence of trend and seasonal non-stationarity in the data and also when the data generating distribution deviates from multivariate Gaussian.
Distance-based anomaly detection approaches do not take into account the nature of data generating distribution.
As a result, distance-based approaches do not utilize the correlations between different attributes of the data.
Since these methods do not take into account the temporal correlations in the data, so these methods are not suitable for detecting anomalies in the time-series data.
Models based on auto-encoder architecture requires one to train these models on normal data instances and hence present operational constraints.
Although generative adversarial networks (GANs) have proven to be very successful in generating high-quality images using a lower-dimensional noise input, their use in generating good quality sequential data is still very limited.
As a result, detection of anomalies in these multivariate IoT time-series becomes a important but challenging task.

Method used


Image

  • System and method for unsupervised anomaly detection
  • System and method for unsupervised anomaly detection
  • System and method for unsupervised anomaly detection

Examples


example 1

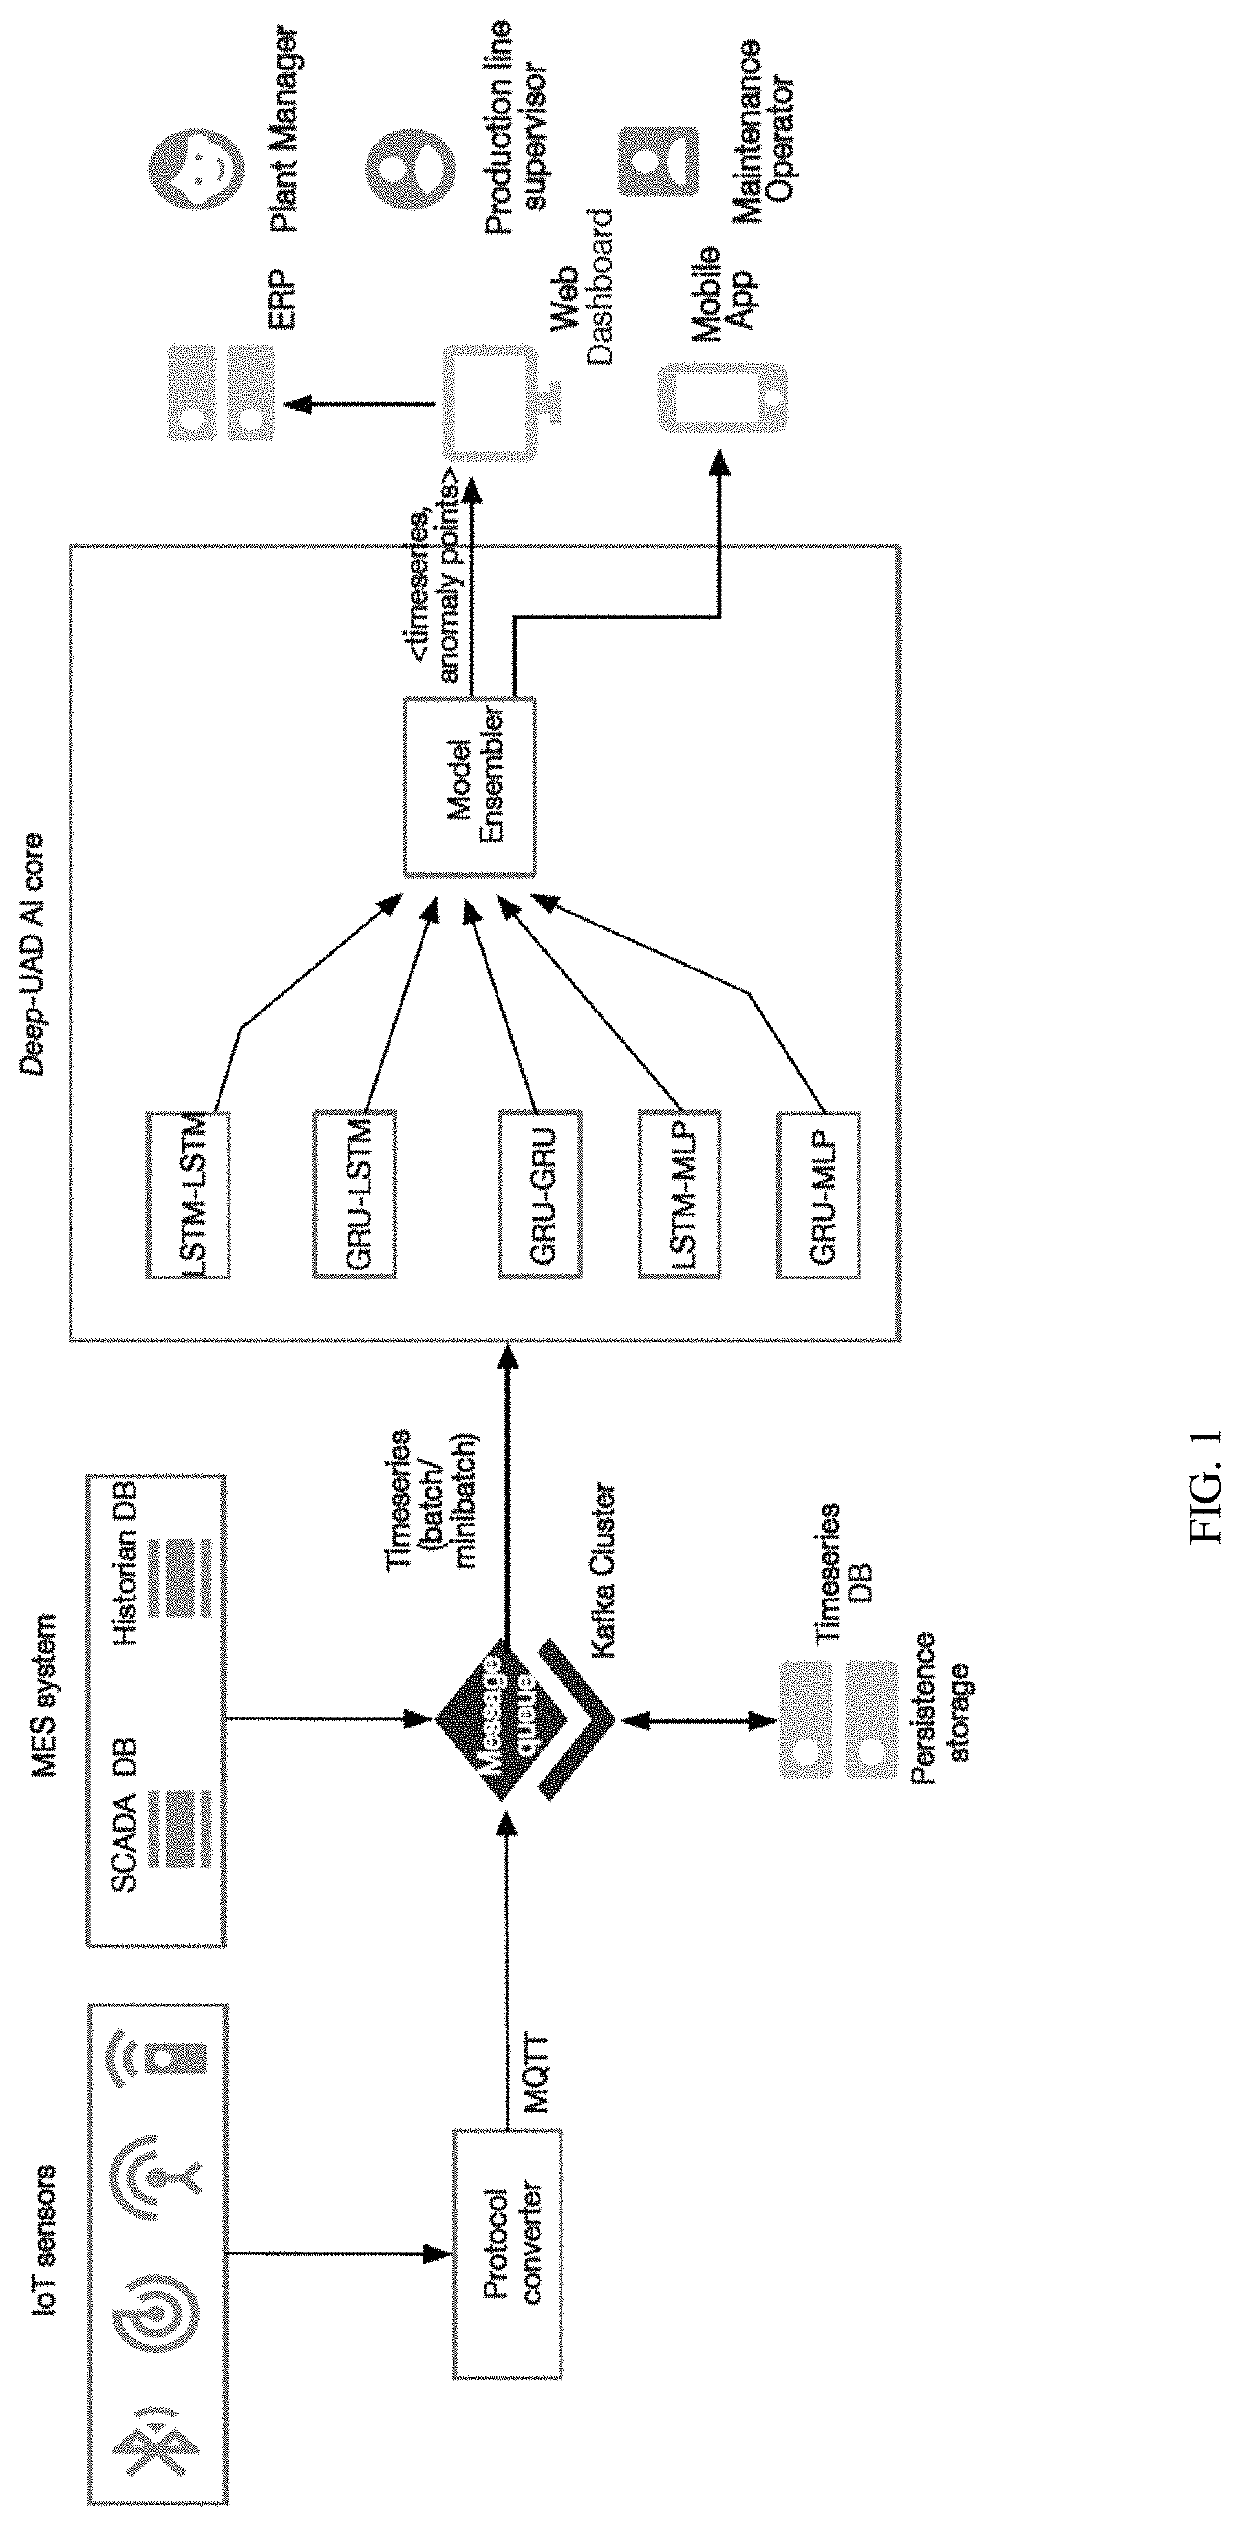
the Deep-UAD System in a Network of a Singapore Based Water Utility Company

[0104]The data set from a Singapore based water utility company (SWaT) contains the data collected from the test-bed with 11 days of continuous operation. This data set consisted of 7 days data was collected under normal operation, along with 4 days of data with attack scenarios. Details of the SWaT data set is shown in Table 1. More detail on the SWaT data-set can be found at, https: / / itrust.sutd.edu.sg / testbeds / secure-water-treatment-swat / .

[0105]

TABLE 1general information about the SWaT data setS. NumberItemsSWaT1Variables512Attacks363Attack Duration (Mins.)2-2.54Training (Normal) data size4968005Test-data size (data with attack)4499146Amount of normal data (in %)88.02

[0106]Tables 2a and 2b represent the results for applying different GAN architectures with binary cross-entropy loss and least square respectively to the SWaT data set to detect anomalies. In tables 2a and 2b, the names of the model are in the...

example 2

the Deep-UAD System in a Water Distribution (WADI) Data Set

[0112]Similar to the SWaT data set, the data collected from the water distribution test-bed with 16 days of continuous operation, out of which data of 14 days was collected under normal operation and data for 2 days was collected with attack scenarios. Details of the WADI data set is shown in Table 4. More details on the WADI data-set can be found on https: / / itrust.sutd.edu.sg / testbeds / water-distribution-wadi /

[0113]

TABLE 4general information about the WADI data setS. NumberItemsWDAI1Variables1032Attacks153Attack Duration (Mins.)1.5-304Training (Normal) data size10487515Test-data size (data with attack)1728016Amount of normal data (in %)94.01

[0114]Tables 5a and 5b show the detailed results for the WADI data set. This data set has very few instances of actual attack scenarios. The Deep-UAD-GAN shows the recall of 70.55% when models are trained using least-squares cost function. Accuracy improves when the models are trained wit...


PUM


Abstract

Some embodiments are associated with a system and method for deep learning unsupervised anomaly detection in Internet of Things (IoT) sensor networks or manufacturing execution systems. The system and method use an ensemble of a plurality of generative adversarial networks for anomaly detection.

Description

RELATED APPLICATIONS[0001]This application claims priority benefit of Indian Patent Application No. 202021003602, filed Jan. 27, 2020, which are incorporated entirely by reference herein for all purposes.FIELD[0002]The invention relates to systems and methods in the field of computer science, and in particular to the deep learning unsupervised anomaly detection in Internet of Things sensor networks.BACKGROUND ART[0003]Advancements in the field of sensor technology and communication networks have led to the development of Internet of Things (IoT) sensor networks. See Marjani Monsen, et. Al., Big IoT data analytics: architecture, opportunities, and open research challenges, IEEE Access 5, 2017. The IoT sensor networks consist of the systems of interconnected computing devices, mechanical and digital machines which are provided with unique identifiers (UIDs) and the ability to transfer data over a network without / with minimum human-human or human-machine interactions. This makes it ver...

Claims


Application Information

Patent Timeline
Patent Type & Authority Patents(United States)
IPC IPC(8): G06N3/04G06F16/2455G06N3/08
CPCG06N3/0454G06F16/24568G06N3/0445G06N3/088G06N3/047G06N3/044G06N3/045
Inventor BHARDWAJ, SHIVAMPANT, NITISHFERNANDES, NIKHILCHOWDHURY, SOUDIP ROY
Owner EUGENIE AI INC
Why Eureka
Try Eureka