Method and apparatus for analyzing building performance

a technology for building performance and performance analysis, applied in the direction of instruments, nuclear elements, analogue processes for specific applications, etc., can solve the problems of difficult to evaluate the level of fire safety of residence and residence performance, and achieve the effect of improving visual analysis of response 3

Inactive Publication Date: 2002-03-07
KAJIMA CORP
View PDF1 Cites 18 Cited by
  • Summary
  • Abstract
  • Description
  • Claims
  • Application Information

AI Technical Summary

Benefits of technology

0010] Referring to an embodiment of FIG. 1 and a flowchart of FIG. 2, a method for analyzing building performance according to the invention will be summarized. A response function 21 is stored in a memory means 20 of a computer 8. The function 21 describes the relationship between building structure, for instance, its design values 11, and the response 3 of the building and inside thereof (to be referred to as "the response 3 of the building", hereinafter) to a specific environmental change, such as occurrence of a fire, an earthquake of certain characteristics, and the like. As a part of initial conditions, a 3D simulation image Is1 of the building structure is computed by computer graphics or the like techniques while using, for example, the design values 11 of the building structure. Then, the

Problems solved by technology

However, it is sometimes difficult to evaluate the level of fire safety of residence based solely on the length of durable time against fire and r

Method used


Image

  • Method and apparatus for analyzing building performance
  • Method and apparatus for analyzing building performance
  • Method and apparatus for analyzing building performance

Examples


Embodiment Construction

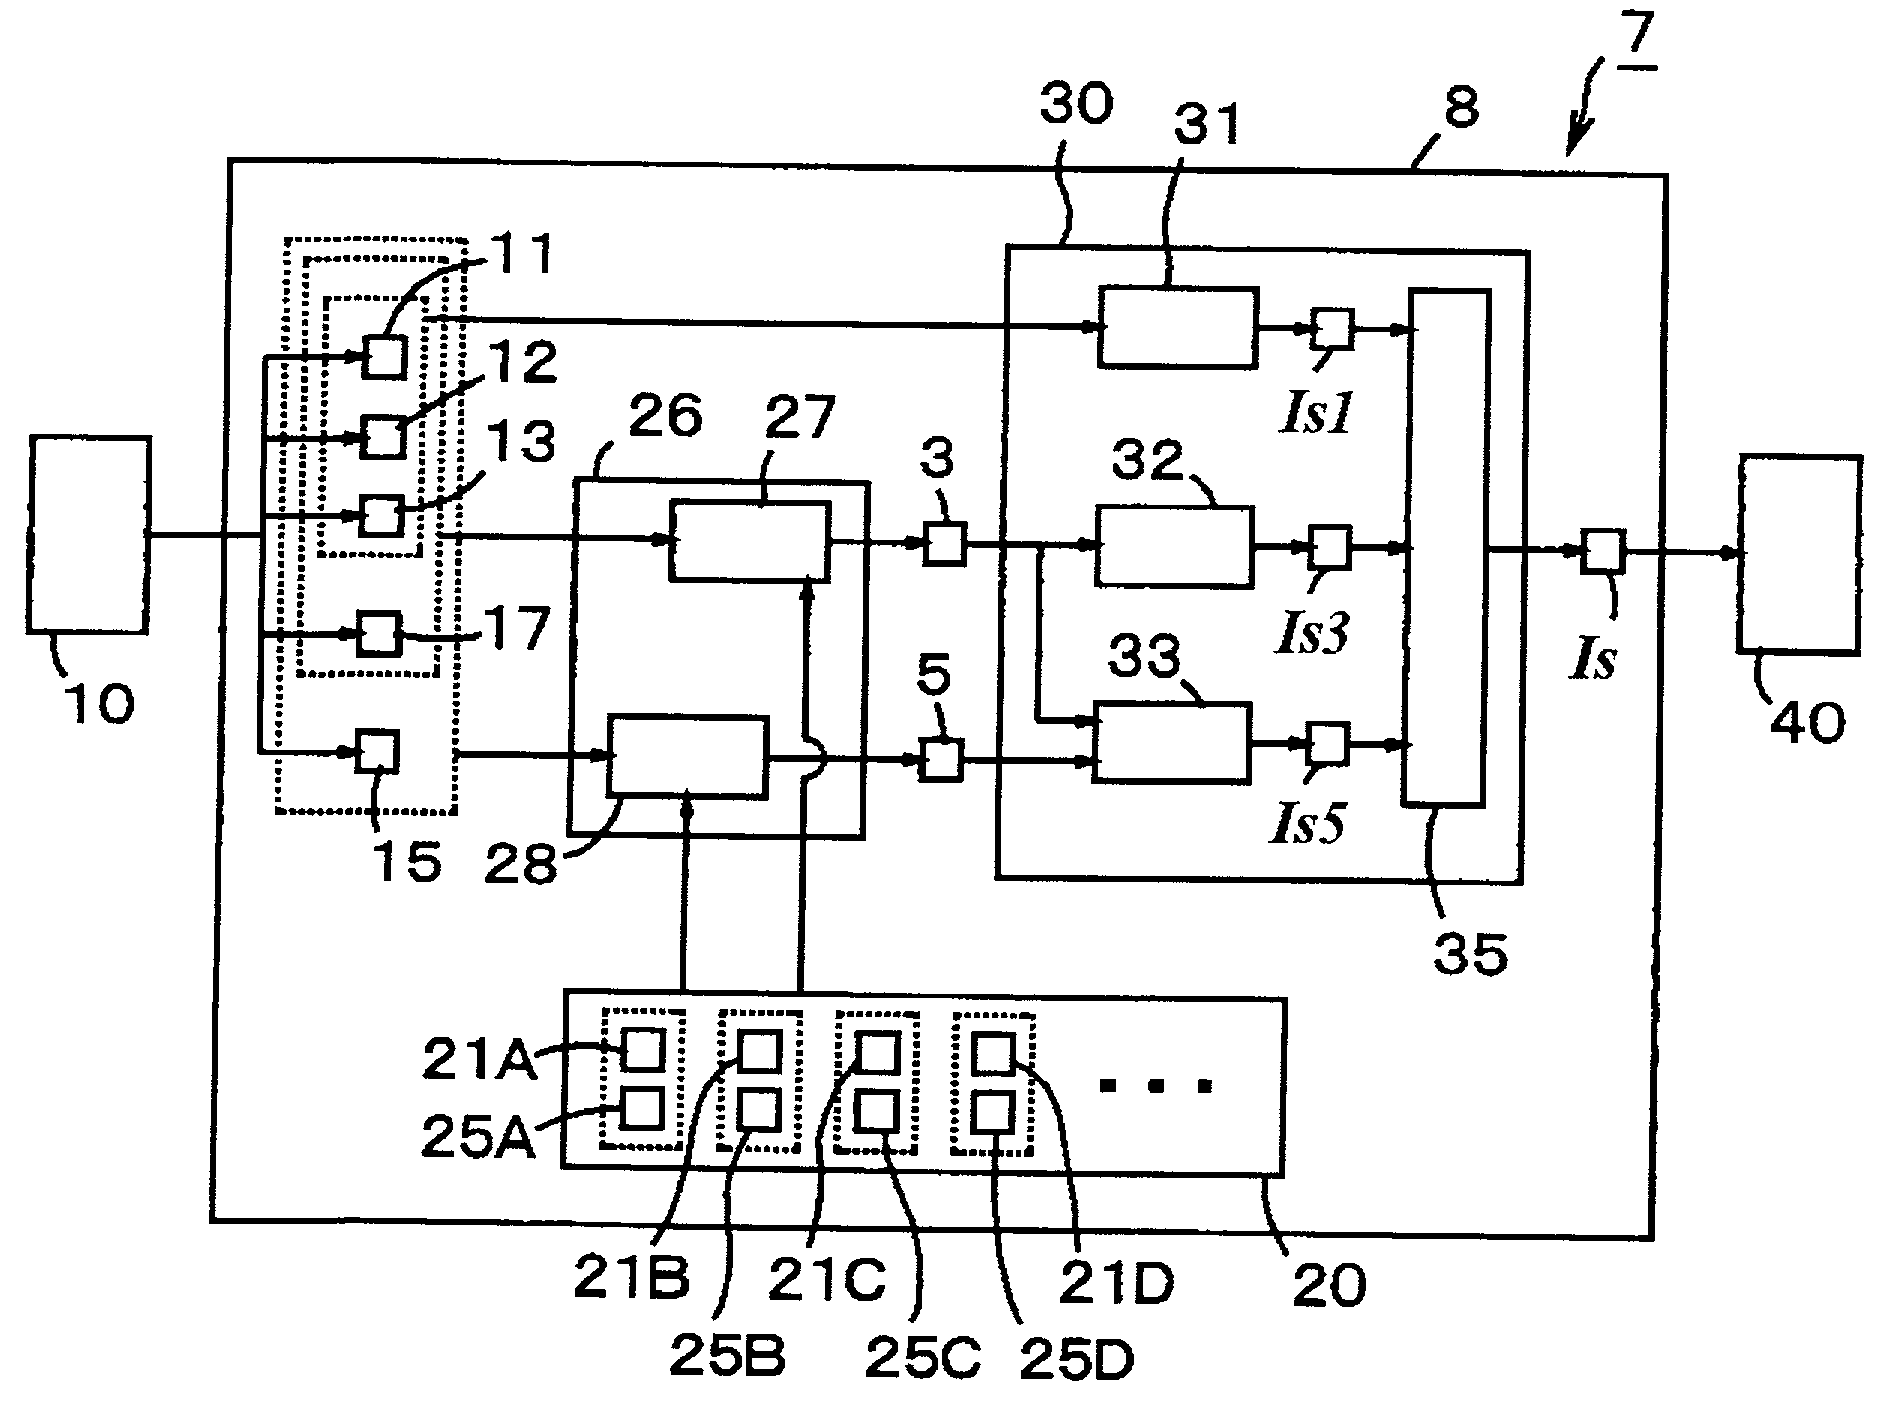
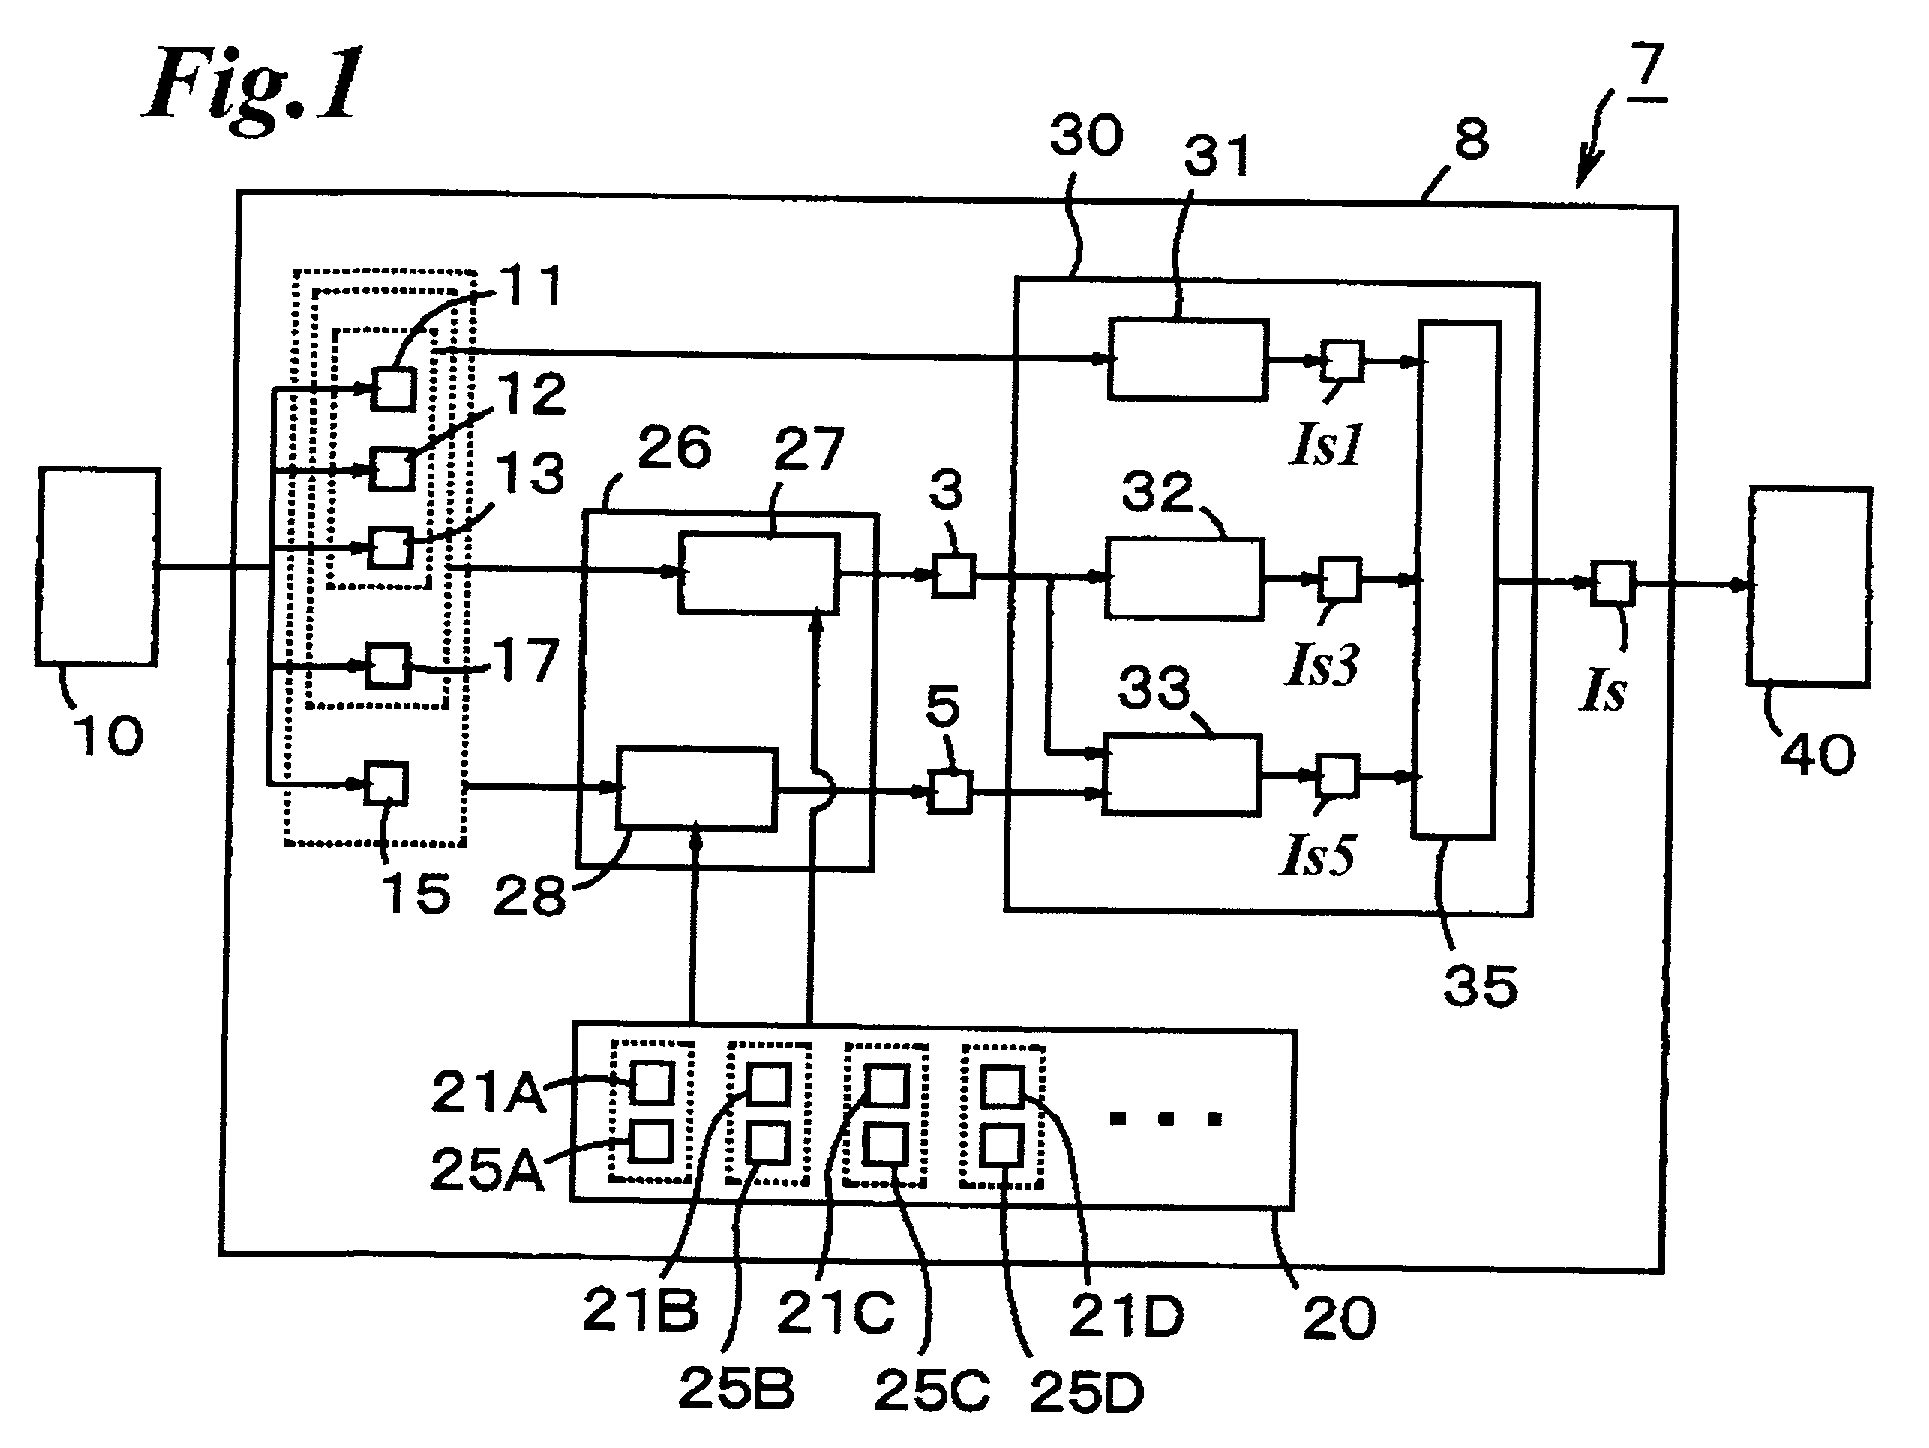
[0033] FIG. 1 shows a block diagram of a performance analysis system 7 according to the present invention. The system comprises a computer 8, an input means 10, a memory means 20, and a display means 40. The memory means 20 stores response functions 21 of a building and / or equipment therein to an environmental change. The response function 21 depends on variables including at least building structures and time, and generates a calculated response of the building to the environmental change with time. In the illustrated embodiment, the memory means 20 stores a plurality of response functions 21A, 21B, 21C, 21D for different environmental changes, such as fire, earthquake, strong wind, and the like. In practical applications, one or more response functions 21 are used depending on the range of analysis to be made. When a plurality of response functions 21 are used, corresponding selection values 17 are assigned to different response functions 21, respectively, and each response functi...


PUM


Abstract

A computer 8 stores a response function 21 defining relation between the structure of a building and response 3 of the building to an environmental change. A 3-dimensional (3D) simulation image Is1 of the building is computed based on design values 11 of the building structure. The response 3 is computed by substituting the design values 11 in the response function 21, and a 3D simulation image Is3 of the response 3 is computed. The two 3D simulation images Is1 and Is3 are superposed so as to produce a superposed 3D simulation image Is. With comparison the 3D images Is1 and Is, i.e., images before and after the change, the response 3 to the change is visualized and analyzed as performance of the building. Preferably, the response 3 is expressed as a function of both the structure and equipment installed therein, and the response 3 of the building is computed based on the structural design values 11 and equipment design values 12. More preferably, the response 3 is expressed as a function of the structure and the equipment and/or indoor goods, and the response 3 of the building is computed based on the structural design values 11 and equipment design values 12 and indoor goods attributes 13.

Description

[0001] 1. Field of the Invention[0002] This invention relates to a method and an apparatus for analyzing performance of building, and in particular, relates to such method and apparatus which analyze building performance by visualizing it in three-dimensional simulation images.[0003] 2. Prior Art[0004] Buildings are generally required to render certain level of performance in response to those changes in surrounding conditions that affect the safety and habitability. Examples of phenomena causing such changes are, for instance, fire, earthquake, strong wind, heavy rain, coldness, hotness, air pollution, noise, upstairs life noise, brightness, and the like (those phenomena causing changes in surrounding conditions will be collectively referred to as "environmental change", in the present text). Further, it is a recent trend for owners to ask designers and builders to explain performance of the building being designed or built in easily understandable terms, so that owners and expecte...

Claims


Application Information

Patent Timeline
IPC IPC(8): E04B1/00G06F19/00G06Q50/00G06Q50/08G06Q50/16G06T17/40G06T19/00
CPCG06F17/5004G06T19/00G06T2210/04G06F30/13
Inventor SATOH, HIROOMIISHIDO, NAOKIKURIOKA, HITOSHIKAKEI, HIDEKAZU
Owner KAJIMA CORP
Why Eureka
Try Eureka