Image processing of mass spectrometry data for using at multiple resolutions

a mass spectrometry and image processing technology, applied in the field of mass spectrometry, can solve the problems of limiting affecting the ability to process the data collected by mass spectrometers, and affecting the ability to identify various features in the data

Inactive Publication Date: 2004-05-27
EFECKTA TECH CORP
View PDF5 Cites 59 Cited by
  • Summary
  • Abstract
  • Description
  • Claims
  • Application Information

AI Technical Summary

Problems solved by technology

Processing the data collected by mass spectrometers has been difficult due to the volume of data collected during any given mass spectrometer run.
There are several limitations and problems arising from the high volume of raw data collected by mass spectrometers, including time-of-flight mass spectrometers.
First, viewing only the peak data signal 102 limits the ability to identify various features in the data.
Also, because of the large range of scale of the vertical axis generally necessary to display the peak data signal 102, smaller measured trace elements maybe difficult to distinguish from noise.
Second, most mass spectrometers are incapable of storing the large volume of raw data for later recovery or post processing investigation of the data.
Third, even if a mass spectrometer includes a large enough storage unit, handling and manipulating the large amount of stored raw data is excessively time consuming.
Moreover, the raw data typically proves to be difficult to use in distinguishing certain features.
Fourth, using the large amount of raw data for operations or applications, such as data mining, searching, and matching, for example, is time consuming to the point of being cost prohibitive.
Fifth, conventional data compression techniques, such as WINZIP, generally are complicated and do not afford benefits beyond data compression of datasets in their entirety, thereby limiting the amount of data compression possible.
Also, because FDA regulations are now requiring the complete raw data to be made available at later dates, lossless compression and higher levels of data compression than possible with conventional data compression techniques are needed.

Method used


Image

  • Image processing of mass spectrometry data for using at multiple resolutions
  • Image processing of mass spectrometry data for using at multiple resolutions
  • Image processing of mass spectrometry data for using at multiple resolutions

Examples


Embodiment Construction

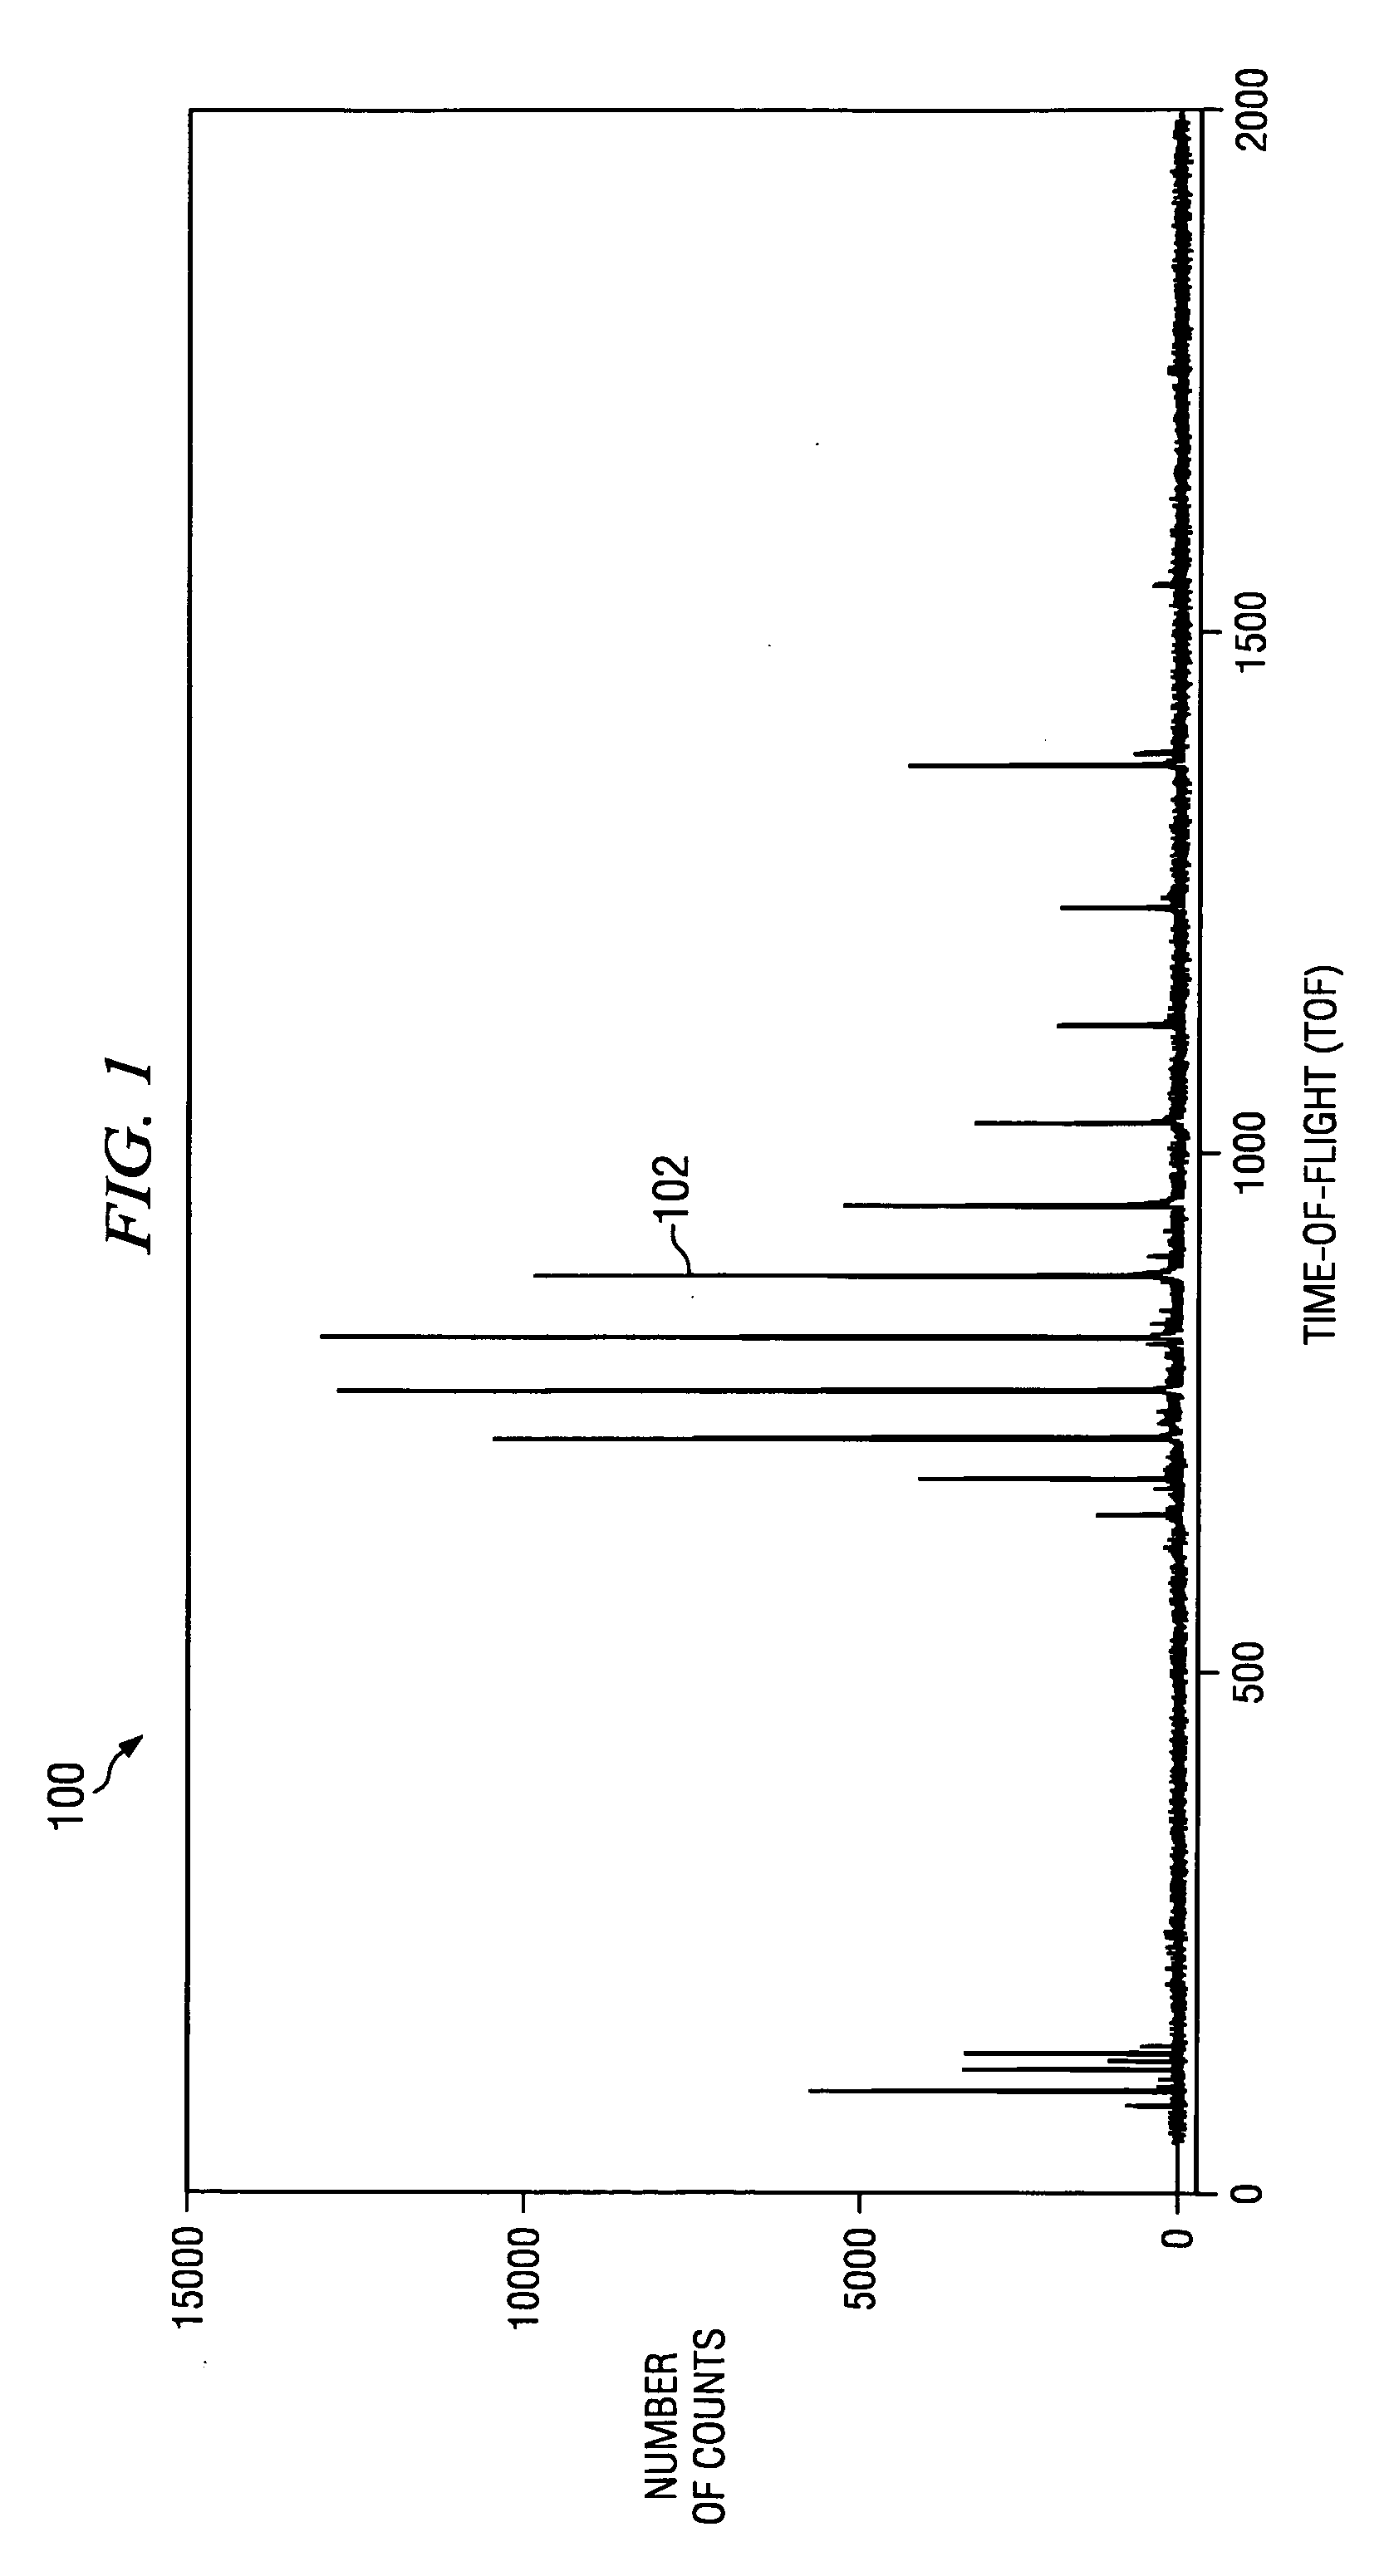
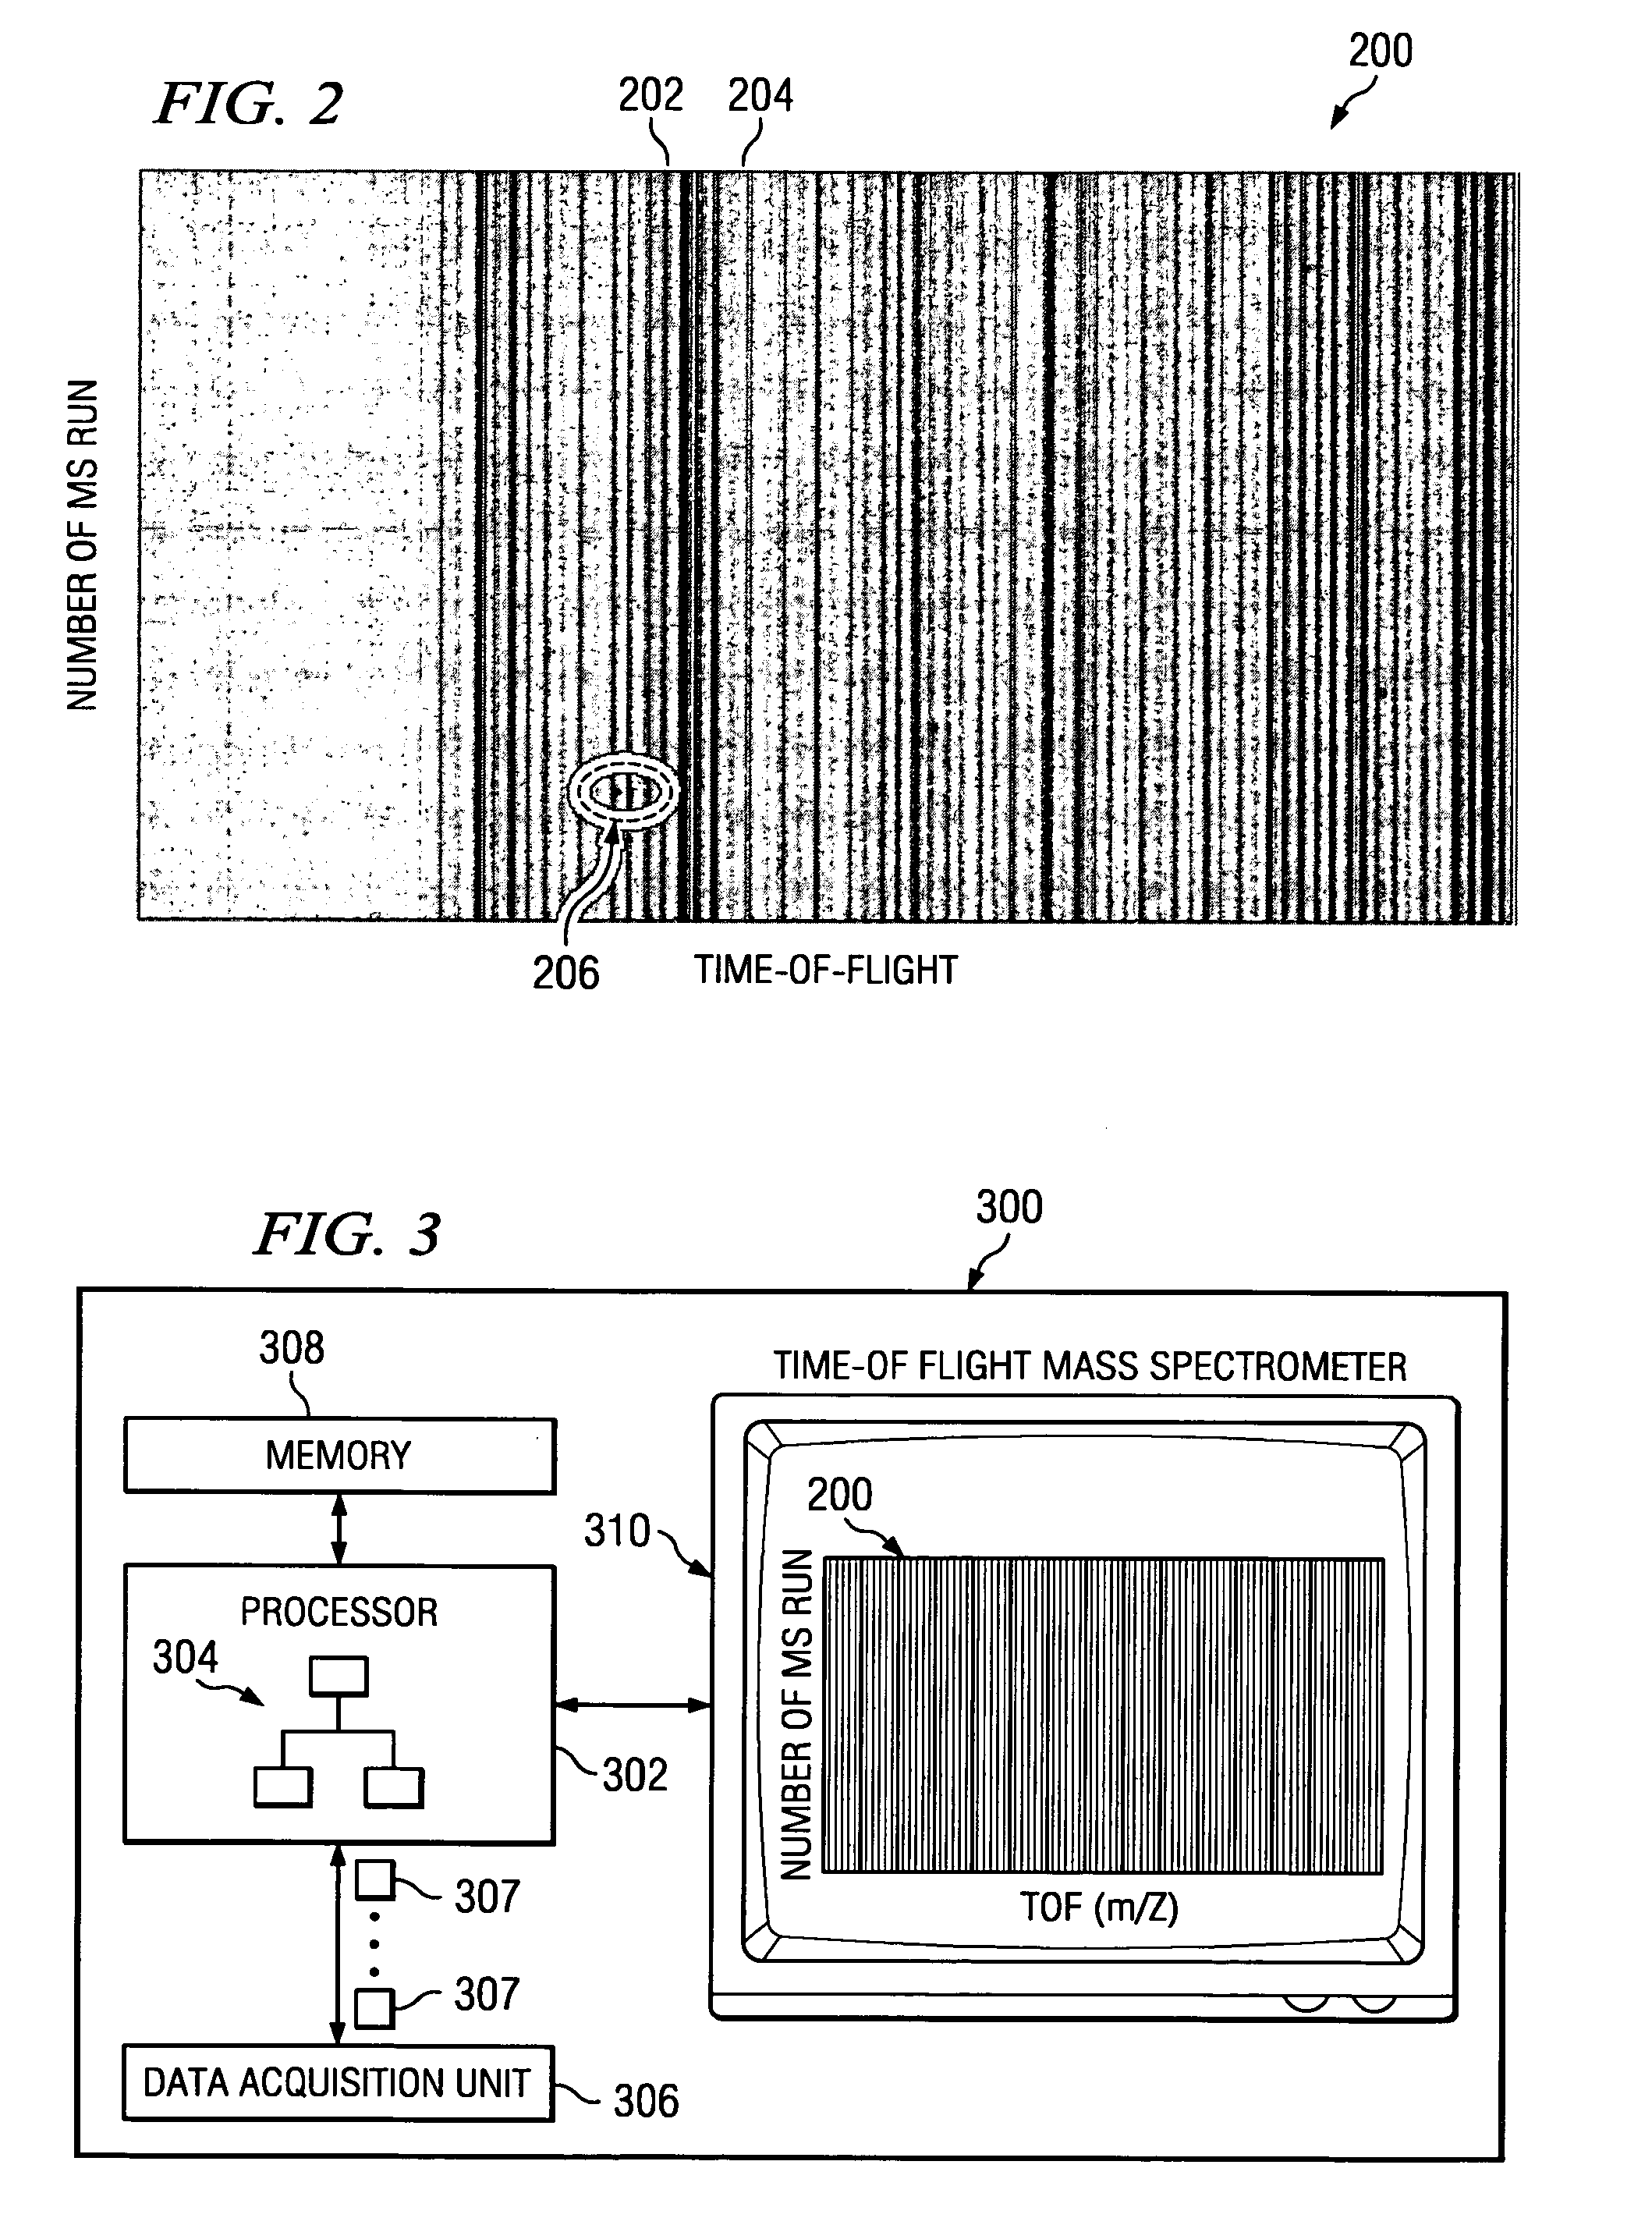
[0026] FIG. 1 is a graph or plot 100 of an exemplary peak data signal produced by a single time-of-flight mass spectrometer run. As shown, the plot 100 displays a peak data signal 102 representative of the sensed particles captured by the mass spectrometer. The peak data signal 102 is displayed as the number of counts versus time-of-flight. The time of flight of the sensed particles measures the M / Z ratio. The peak data signal 102 includes several peaks 104 that indicate that a certain number of particles (e.g., 12,500) took a certain amount of time to travel from an initiation point to a sensor of the mass spectrometer. The peak data signal 102 is formed essentially of the peak total counts produced by the cumulative sampling of ionized particles. As understood in the art, peak data signals 102 are based on a raw dataset as shown in FIG. 2 and are typically utilized because collecting and storing the total volume of raw data is generally prohibitive in terms of processing bandwidth...


PUM

PropertyMeasurementUnit
data compression ratiosaaaaaaaaaa
mass spectrometeraaaaaaaaaa
noiseaaaaaaaaaa

Abstract

A system and method for utilizing an image processing technique to transform raw data collected by a mass spectrometer into a hierarchical data format. The image processing technique may include the use of a wavelet transform. The hierarchical data format, provides for using the transformed data at multiple resolutions without data loss for such operations as data mining, matching, and displaying, for example. Further, the transformed data enables higher levels of data compression than generally possible from directly compressing the raw data. Additionally, the transformed data provides can be used to identify and suppress noise.

Description

CROSS REFERENCE TO PREVIOUS APPLICATION[0001] This application is related to, and claims the benefit of the filing date from, U.S. Provisional Patent Application Serial No. 60 / 405,399, filed Aug. 23, 2002, which is herein incorporated by reference.[0002] 1. Technical Field of the Invention[0003] The principles of the present invention relate to mass spectrometry, and more particularly, but not by way of limitation, to performing an image processing transform on raw data collected by a mass spectrometer.[0004] 2. Description of Related Art[0005] Modern mass spectrometry has developed greatly in terms of the breadth of industries and technologies that use mass spectrometers to identify compounds. Examples of uses of mass spectrometers include identifying chemical and biomaterial compounds, such as DNA and blood samples. Processing the data collected by mass spectrometers has been difficult due to the volume of data collected during any given mass spectrometer run. For Example, a singl...

Claims


Application Information

Patent Timeline
Patent Type & Authority Applications(United States)
IPC IPC(8): G01N30/72G06F19/00G06T9/00G16B40/10H01J49/04H04N7/26
CPCG01N30/7233G06F19/24H01J49/04H04N19/635H04N19/63H04N19/122H04N19/80G01N30/8617G16B40/00G16B40/10
Inventor RODER, HEINRICH
Owner EFECKTA TECH CORP
Why Eureka
Try Eureka