Method to measure gene expression ratio of key genes

Inactive Publication Date: 2004-07-08
FUJIREBIO DIAGNOSTICS
View PDF0 Cites 1 Cited by
  • Summary
  • Abstract
  • Description
  • Claims
  • Application Information

AI Technical Summary

Benefits of technology

[0023] With the here invented method it is possible to determine the ratio of two nucleic acids in biological test samples with unprecedented accuracy by taking into account the sample specific inhibition.
[0025] With the here invented method it is possible to determine the ratio of the expression of IgL.kappa. and IgL.lambda. genes thereby detecting clonality of B cells and classifying lymphoma.

Problems solved by technology

These were very difficult experiments, for several reasons: the concentrations of reagents in the hybridization reactions were often so low that the reassociation reaction required many hours--days in some cases--to generate significant amounts of hybrid.
Second, the hydroxyapatite columns routinely used to separate double-stranded and single-stranded nucleic acids were messy to work with, which made the whole procedure tedious.
In particular, nucleic acids <400 bases in length are retained inefficiently.
A disadvantage is that it works best with antisense probes that are exactly complementary to the target RNA, which is a problem if the experiment generates RNA-RNA hybrids containing mismatched base pairs that are susceptible to cleavage by RNase, for example, when analyzing families of related mRNAs.
This made quantification very uncertain, since the reaction usually ran short of some components giving rise to the same amount of product irrespectively of the amount of starting template.
The error introduced by such assumption may be substantial owing to accumulation effects.
The validity of this critical assumption has not been tested, because there has been no method to determine the PCR efficiencies of individual reactions in samples.

Method used


Image

  • Method to measure gene expression ratio of key genes
  • Method to measure gene expression ratio of key genes
  • Method to measure gene expression ratio of key genes

Examples


example 1

Experimental Reproducibility

[0057] Surgical lymph node biopsies from previously untreated patients were transported from the operation theatre in ice water chilled boxes and handled in the laboratory within 30 minutes. Material for the study was rapidly frozen in dry ice / isopentane and stored at -70.degree. C. Parts of the tissues were fixed in formalin and used for routine diagnostic analysis. Diagnosis was reached by a combination of microscopic evaluation of histology, immunostaining of several markers including the kappa and lambda chains (IHC) and in some cases flow cytometry. The samples were classified as lymphadenitis or malignant lymphoma according to the R.E.A.L.-terminology (Harris N H, Jaffe E S, Stein H, Banks P M, Chan J K, Cleary M L, Delsol G, De Wolf-Petters C, Falini B, Gatter K C: A proposal from the International Lymphoma Study Group. Blood 1994, 84:1361-1392).

[0058] RNA was extracted using the Fast Prep System (FastRNA Green, Qbiogene). Ten .mu.g of total RNA wa...

example 2

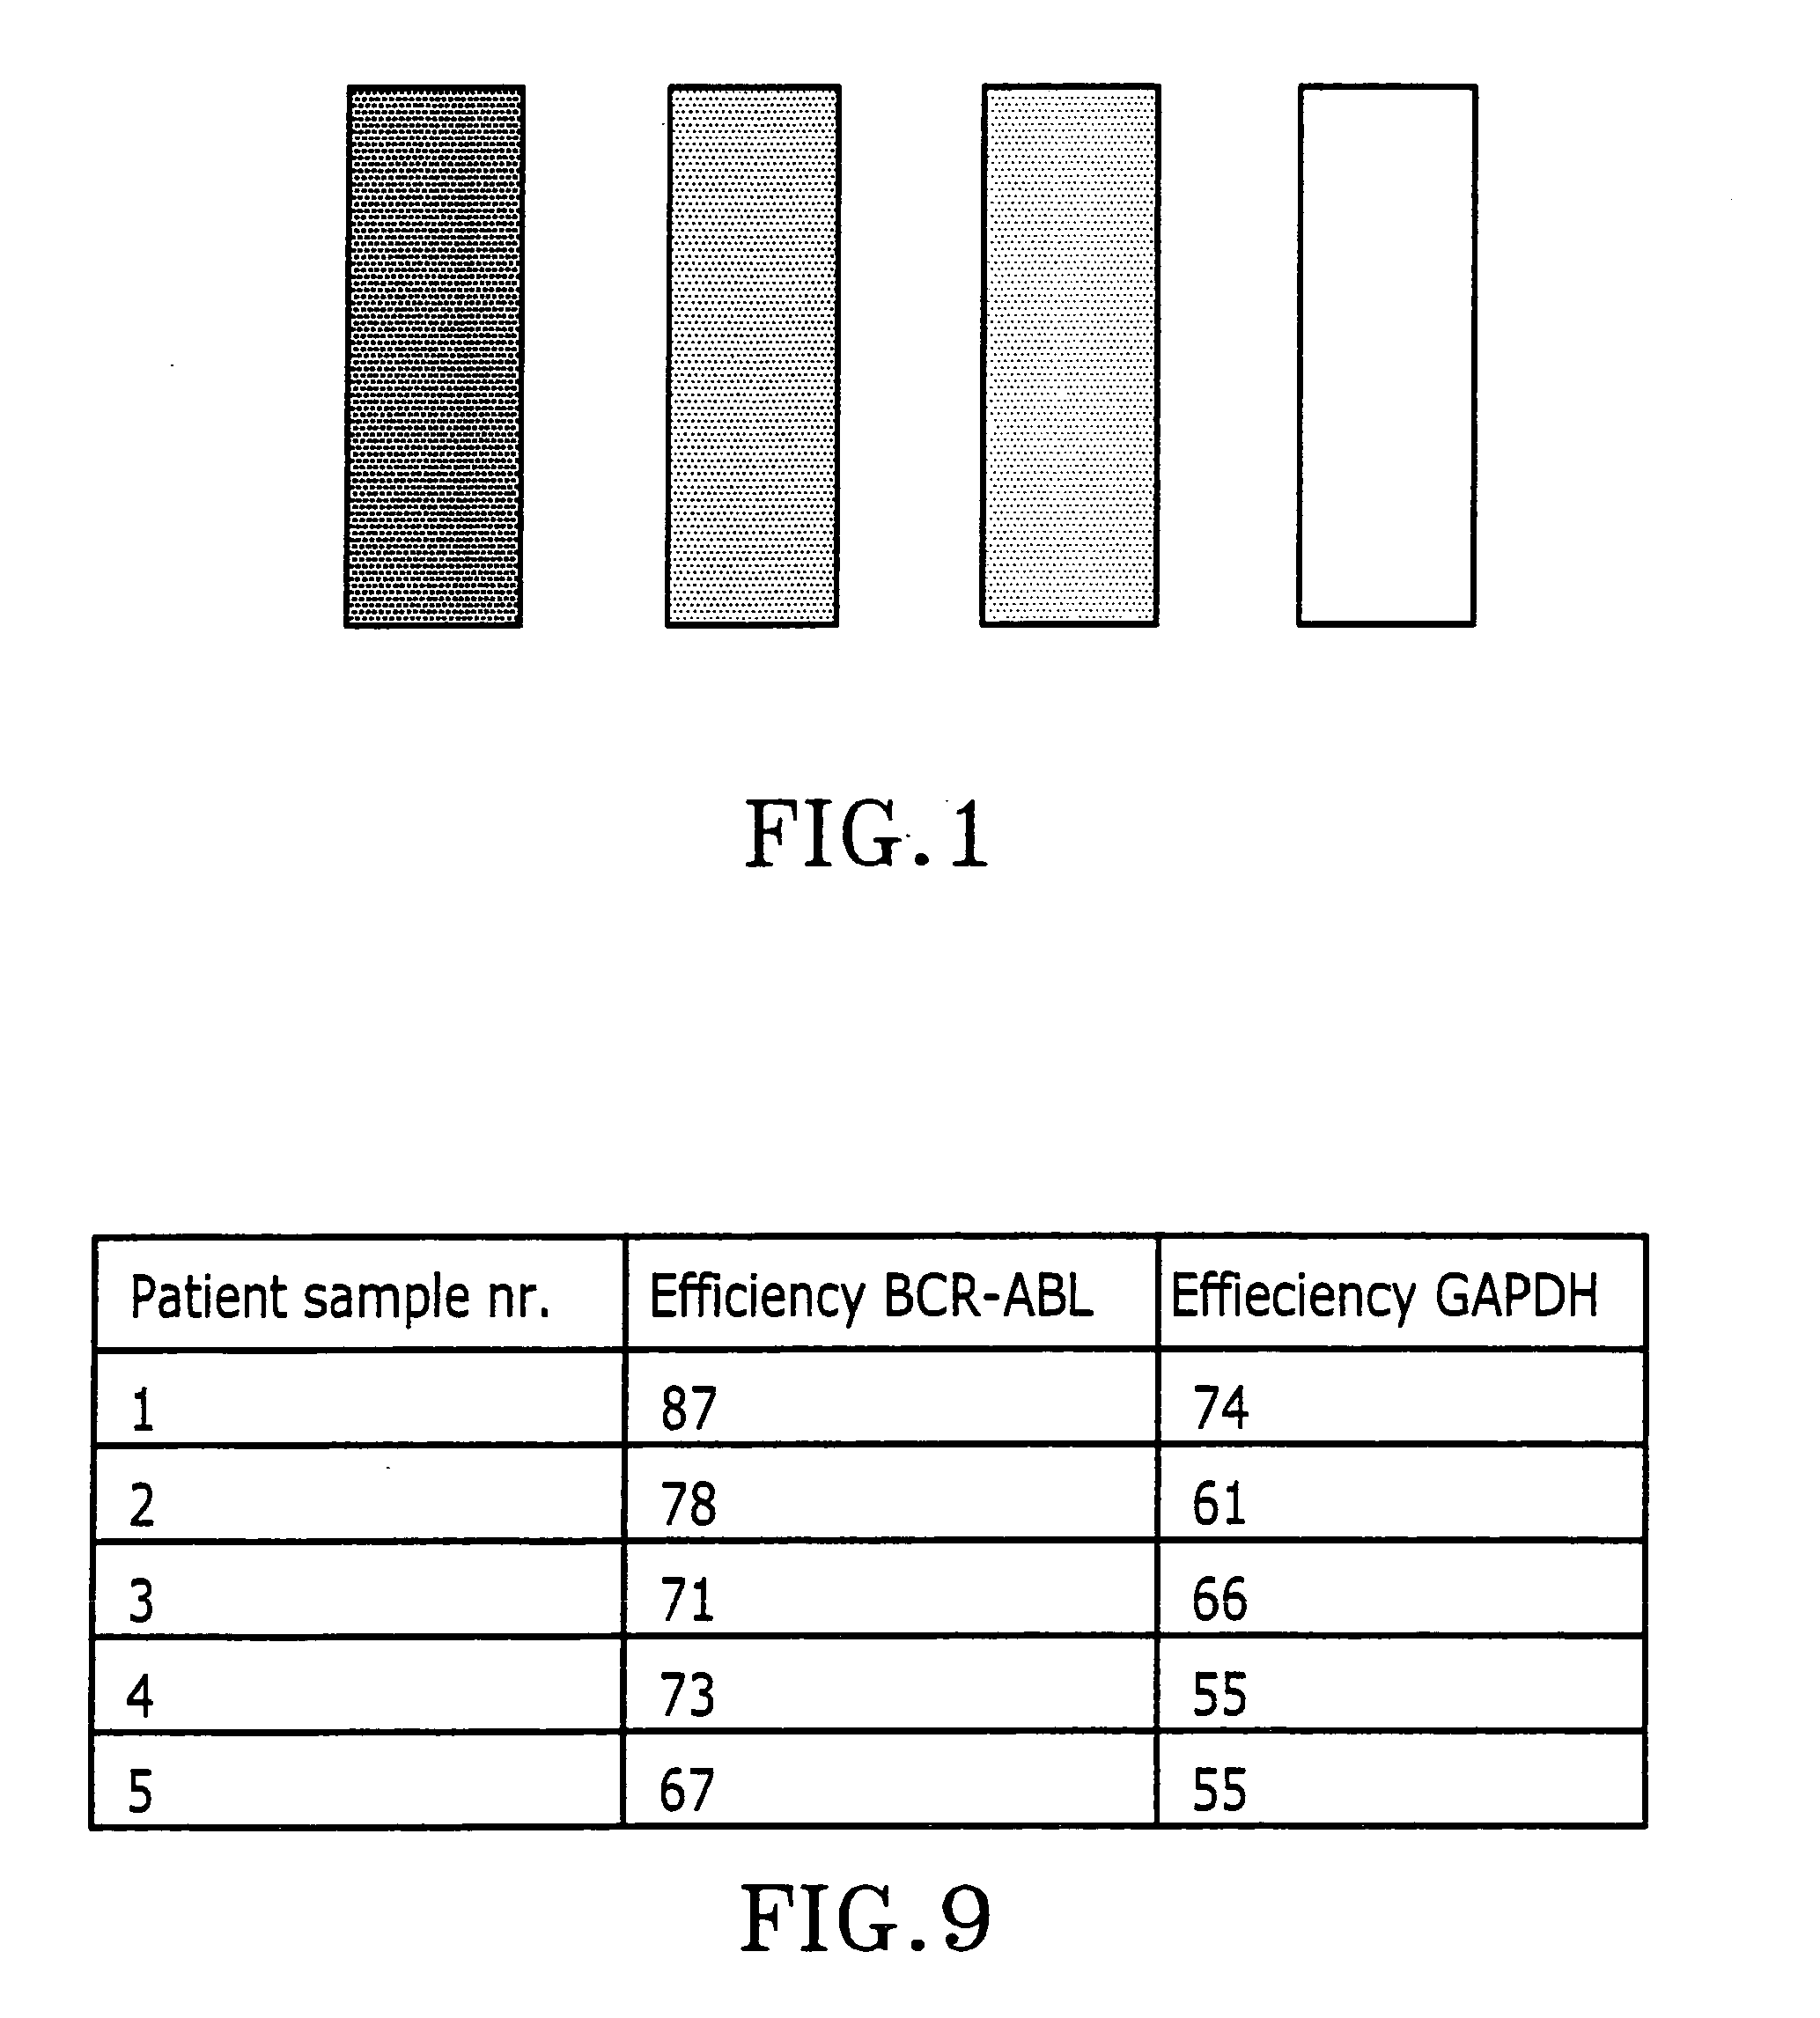
Determination of IgL.kappa. and IgL.lambda. PCR Efficiencies in Patient Samples

[0069] PCR efficiencies in seven patient samples were determined by diluting the test samples in steps and measuring CT value at each dilution. From these data intrinsic standard curves were constructed from which the PCR efficiencies are determined (FIG. 3). We chose to dilute the samples 64 times, in three steps of 4 times. The dilutions were performed in duplicates and the CT values were measured for both the IgL.kappa. and IgL.lambda. reactions determining the efficiencies of the two assays separately. Seven patient samples, four negative and three positive, were characterized this way, as well as purified template that should not contain any inhibitors.

[0070] The PCR efficiencies obtained when amplifying purified template were E.sub.IgL.kappa.=94.7% and E.sub.IgL.lambda.=93.2% signifying that both reactions proceed with very high efficiencies as expected for optimised PCR assays. Six of the patient s...

example 3

Classification of NHL Lymphoma Patient Samples

[0075] A total of 20 patient samples were analyzed for B-cell lymphoma by the Q-PCR assay. All samples were run in duplicates including negative controls. The data plotted in FIG. 6 and summarized in FIG. 7. In the plot each symbol represents one sample and is positioned on the coordinates CT.sub.IgL.kappa., CT.sub.IgL.lambda.. The corresponding number of cDNA molecules of purified template, calculated assuming E.sub.IgL.kappa.=94.7% and E.sub.IgL.lambda.=93.2%, is indicated in logarithmic scale on the opposite axes. Samples considered negative by IHC analysis are shown as circles and positive samples are shown as squares.

[0076] Negative samples with IgL.kappa.:IgL.lambda. gene expression ratio of 60:40 are expected to lie on a straight line. Rewriting equation (9) gives (eq. 20):

N.sub.0.sub..sub.IgL.kappa.*(1+E.sub.IgL.kappa.).sup.CT.sup..sub.IgL.kappa-.=K.sub.RS*N.sub.0.sub..sub.IgL.lambda.*(1+E.sub.IgL.lambda.).sup.CT.sup..-sub.IgL.la...


PUM

PropertyMeasurementUnit
Forceaaaaaaaaaa
Forceaaaaaaaaaa
Fractionaaaaaaaaaa

Abstract

The invention is a method to determine the amounts, in particular the relative amounts, of nucleic acids in complex biological samples by means of real-time PCT. According to the invention the biological sample is systematically diluted and each dilution is studied by real-time PCR for all genes of interest. From the dependence of the threshold cycle on dilution factor for each of the genes, the PCR efficiencies of the reactions are determined in the particular samples, determining also the relative sensitivity of the real-time PCR assays compared, the relative amounts of two nucleic acids in complex biological samples are determined with unprecedented accuracy.

Description

DESCRIPTION[0001] 1. Technical Filed[0002] The invention belongs to the category methods for quantification of nucleic acids. Such methods are used to determine the amount of specific genes, gene segments, RNA molecules and other nucleic acids in samples. These methods are primarily used in clinical diagnosis, for example, to test tissue, blood and urine samples, and in food technology, agriculture and biomedicine.[0003] 2. Background of the Invention[0004] Methods to measure gene expression go back to the 1970s. The first method was based on measuring reassociation kinetics of complementary strands (Wetmur & Davidson, J. Mol. Biol., 1, 349, 1968). A radiolabeled single-stranded DNA probe was added and its association with complementary mRNA, when the mRNA was present in molar excess, was measured. These were very difficult experiments, for several reasons: the concentrations of reagents in the hybridization reactions were often so low that the reassociation reaction required many h...

Claims


Application Information

Patent Timeline
IPC IPC(8): C07K16/00C12N15/09C12Q1/68
CPCC12Q1/6851C12Q1/6886C12Q2600/158C12Q2561/113
Inventor AMAN, PIERRESTALBERG, ANDERSKUBISTA, MIKAEL
Owner FUJIREBIO DIAGNOSTICS
Why Eureka
Try Eureka