
Flows based visualization of packet networks with network performance analysis, troubleshooting, optimization and network history backlog

a flow-based visualization and packet network technology, applied in the field of computer and packet network, can solve the problems of inability to present near real-time flow related parameters, device inferiority, and network administrators and engineers have a rather limited set of tools to visualize and control their networks, and all mentioned prior art has failed to provide inexpensive and therefore affordable solutions. , to achieve the effect of improving network security

Inactive Publication Date: 2006-02-09
IAKOBASHVILI ROBERT +1
View PDF22 Cites 220 Cited by
  • Summary
  • Abstract
  • Description
  • Claims
  • Application Information

AI Technical Summary

Benefits of technology

[0030] Yet another aspect of the invention is deployment of the computer system physically on the packet routes (active deployment), enabling it not only to collect statistical information, store it to a database and analyze the traffic, but also to apply results of the analyses actively by performing traffic modifications, e.g. by dropping a worm related VFs to prevent the worm spreading.
[0032] Another aspect of the present invention relates to further processing VF-based information into the application, network protocols and host related information, by making application / protocols classification of all VFs in the network, whereas the destination / source address of each host (IP-address in ip-networks) is an integral part of VFID. Keeping all VF data, including VFID and statistics counters, in a searchable database enables an easy access to any application, network protocol or host based statistics. According to this aspect of the invention a topology of the networks, from which the system collects statistics, may be reconstructed using IP-addresses of all hosts, stored per each VF in the database, and either netmask inputs from network administrators, or netmask discovery techniques. A network topology map resulting from the reconstruction is a useful and convenient GUI, which in combination with the capability of the invented system to depict on the map in near real-time statistics regarding applications, protocols, throughputs, retransmissions, RTT (Round-Trip Time), numbers of connections and packets, other parameters with relation to network elements and their interconnections, creates real visualization of network dynamics. The invented system provides a network administrator or an engineer with the means necessary for real control of network, enables bottleneck analyses and troubleshooting, re-planning and network layout optimization.
[0033] It is yet another aspect of the present invention providing an analytical agent, which is capable of revealing network bottlenecks and / or network poor performance and of triggering relevant recommendations for network optimization. Statistical information regarding all VFs running in the network is collected for each time sampling period, which is normally configurable from seconds to tens of seconds. Data for each VF, which represents a collection of statistics for at least one time sampling period, is kept by the system long enough enabling historical searches. Thus, an administrator may easily obtain time-dependent throughput data for a very important long running VF including times when there was insufficient bandwidth. It is easy to figure out the sources and reasons of extra retransmissions, to locate the most bandwidth-consuming hosts and applications at peak hours and to gain deep understanding of the nature of the load on a web-server at different hours, etc.
[0035] Yet another aspect of the invention is an availability control of network elements and network services. Absence of VFs, originating from a certain network element (NE) and / or broken VFs full of retransmissions towards the NE, trigger configurable NE availability alerts. It may be easily configured to monitor availability of a certain type of applications / services, running on a NE or on a group of NE to trigger alerts when the applications / services are malfunctioning.
[0038] A one more aspect of the present invention relates to improving network security. Keeping a full VFs history backlog enables to reveal fingerprints (VFs) of an intrusion to a computer in the network, which occurred at a known time in the past. Spreading a worm in the network generates an anomalous flow with a great number of VFs from a worm-sourcing computer to all other NEs. Worm spreading pattern may be alerted, helping to prevent it and / or reveal computer from which the worm spreads. Patterns of DOS / DDOS attacks may be easily highlighted causing an alert for action to be undertaken.

Problems solved by technology

Network administrators and engineers have a rather limited set of tools to visualize and control their networks.
Although being very useful tools, the devices are inferior in their capability to present near real-time flow related parameters (e.g. throughput, number of packets per second) for all virtual flows running in the network.
All mentioned prior art has failed to provide inexpensive and, therefore, affordable solution for most companies for configurable presentation of the whole network picture in a near real-time and does not teach how to obtain detailed information necessary for networks troubleshooting and optimization, detection of anomalies and a time-sampled historical searchable view on the total network as well as on each individual VF, VSF, AGVF or any other logical flow.

Method used


Image

  • Flows based visualization of packet networks with network performance analysis, troubleshooting, optimization and network history backlog
  • Flows based visualization of packet networks with network performance analysis, troubleshooting, optimization and network history backlog
  • Flows based visualization of packet networks with network performance analysis, troubleshooting, optimization and network history backlog

Examples


Embodiment Construction

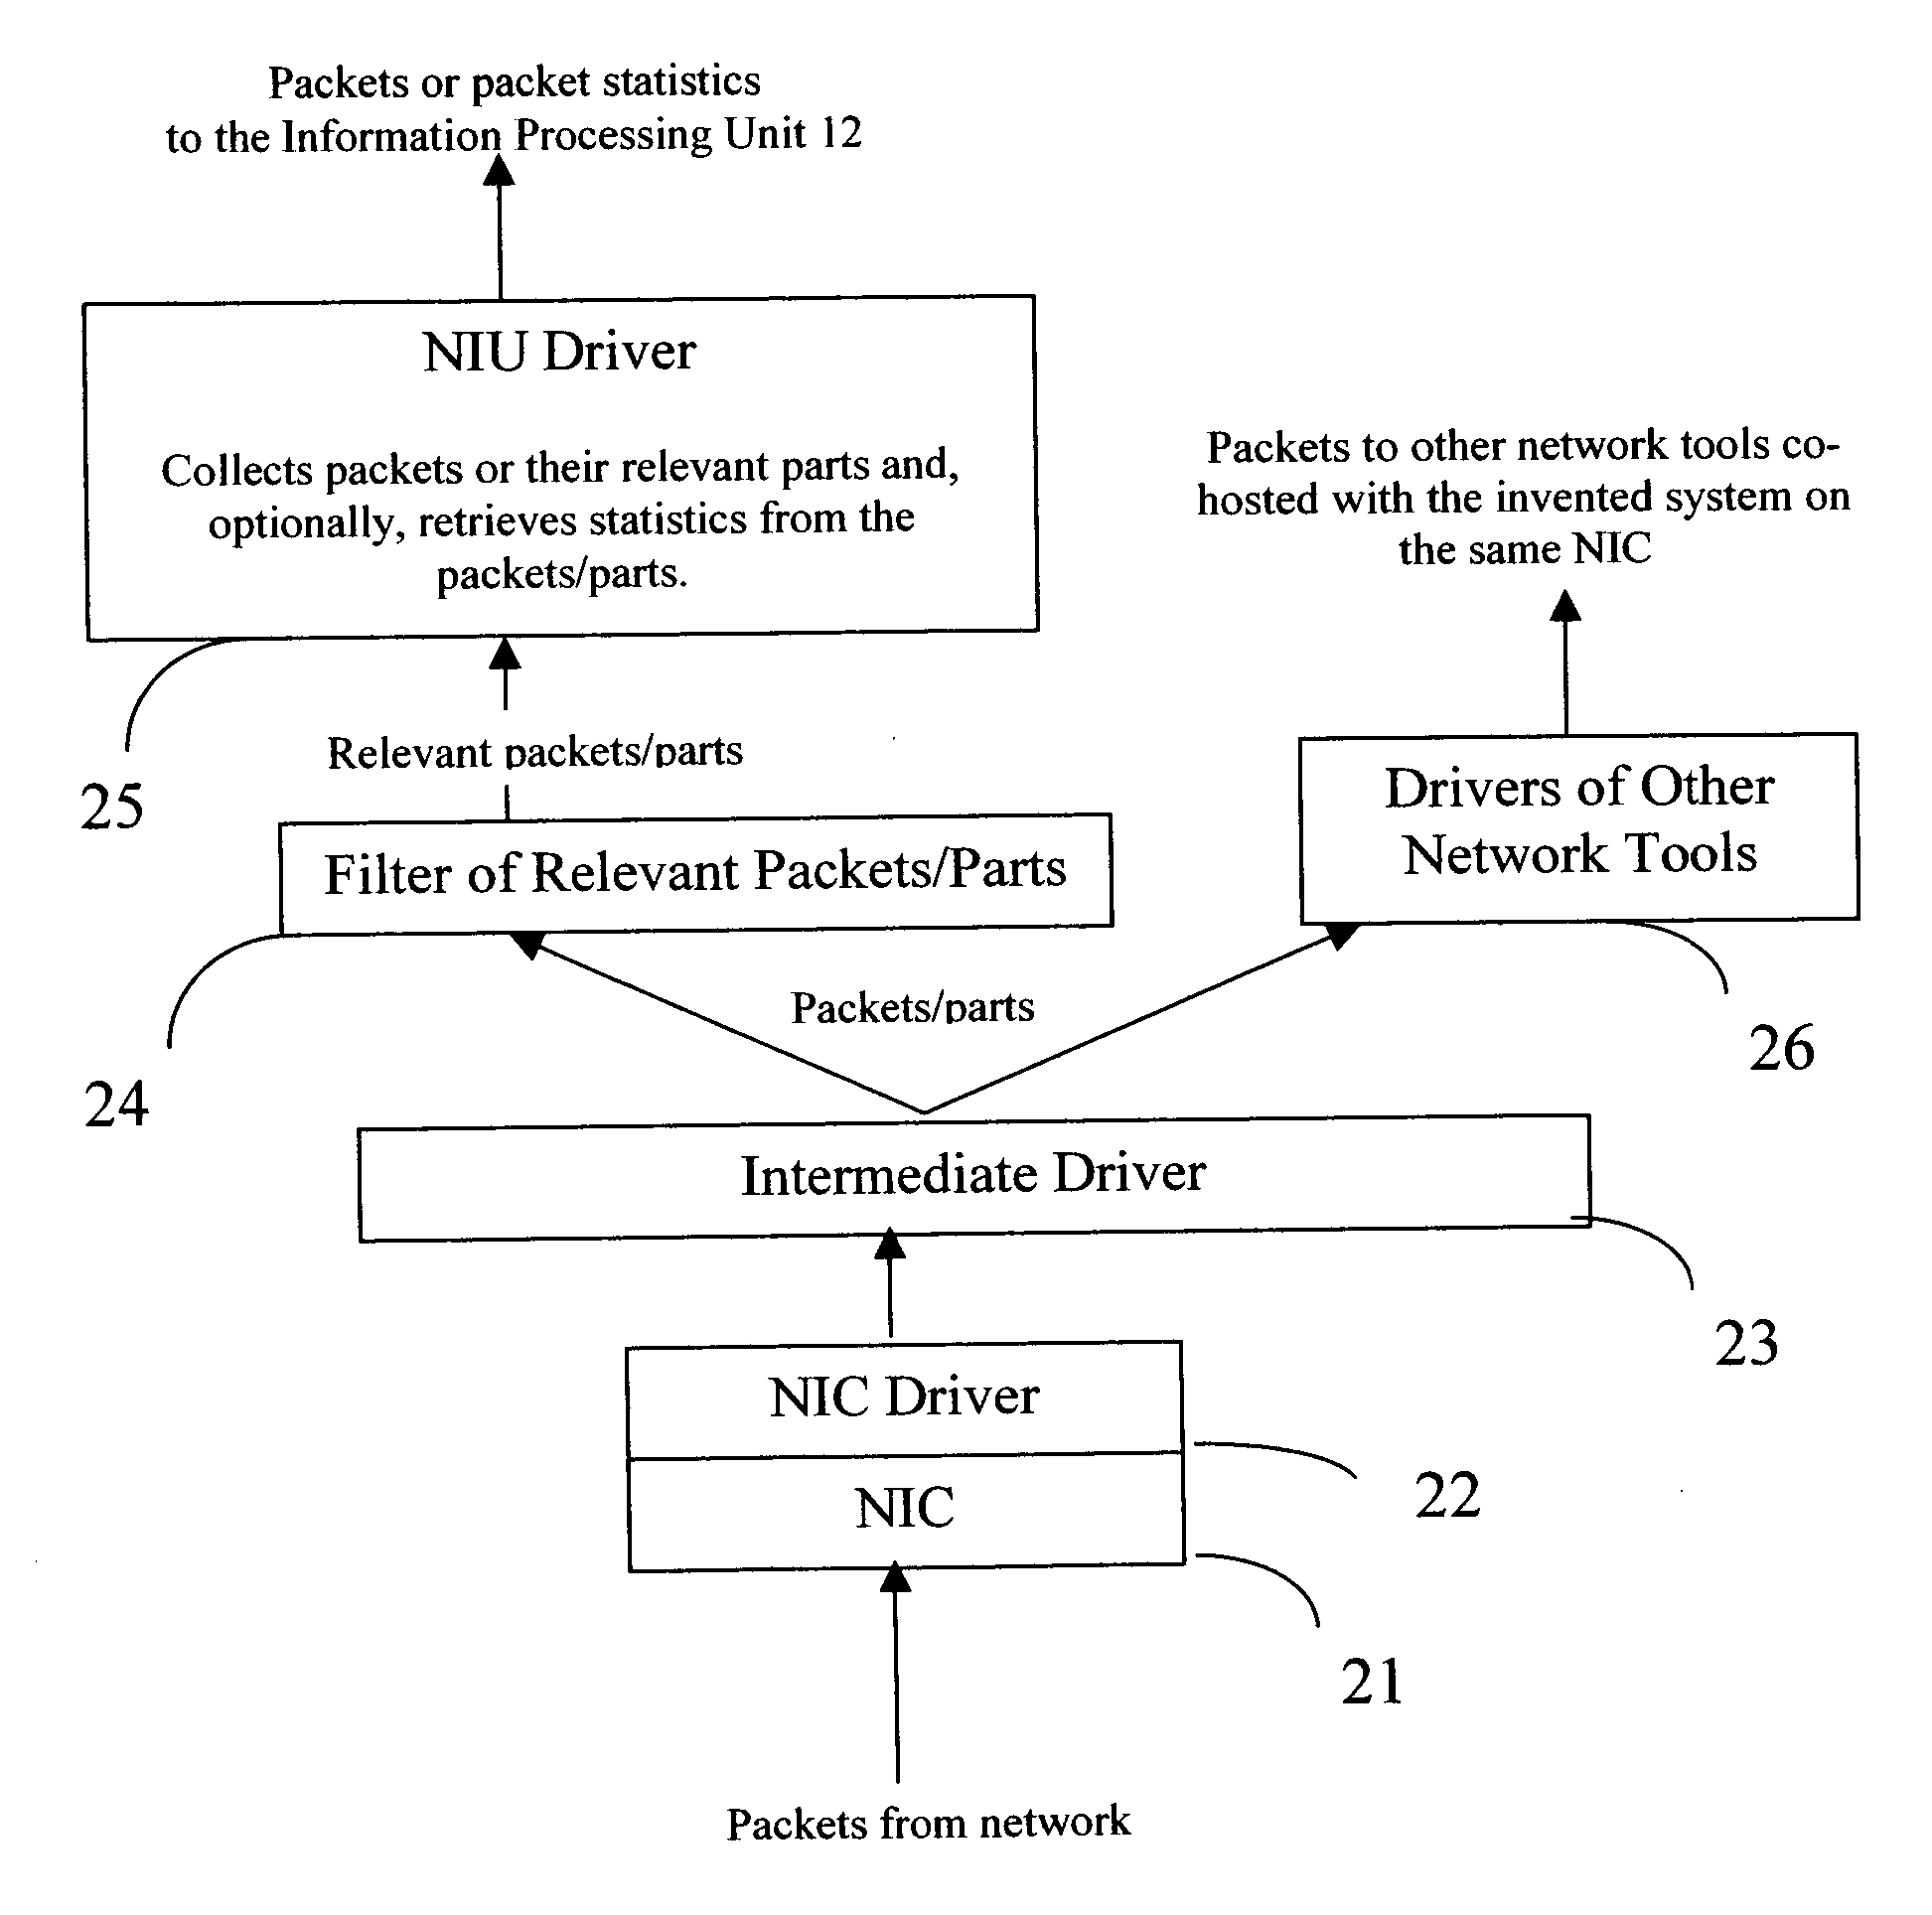
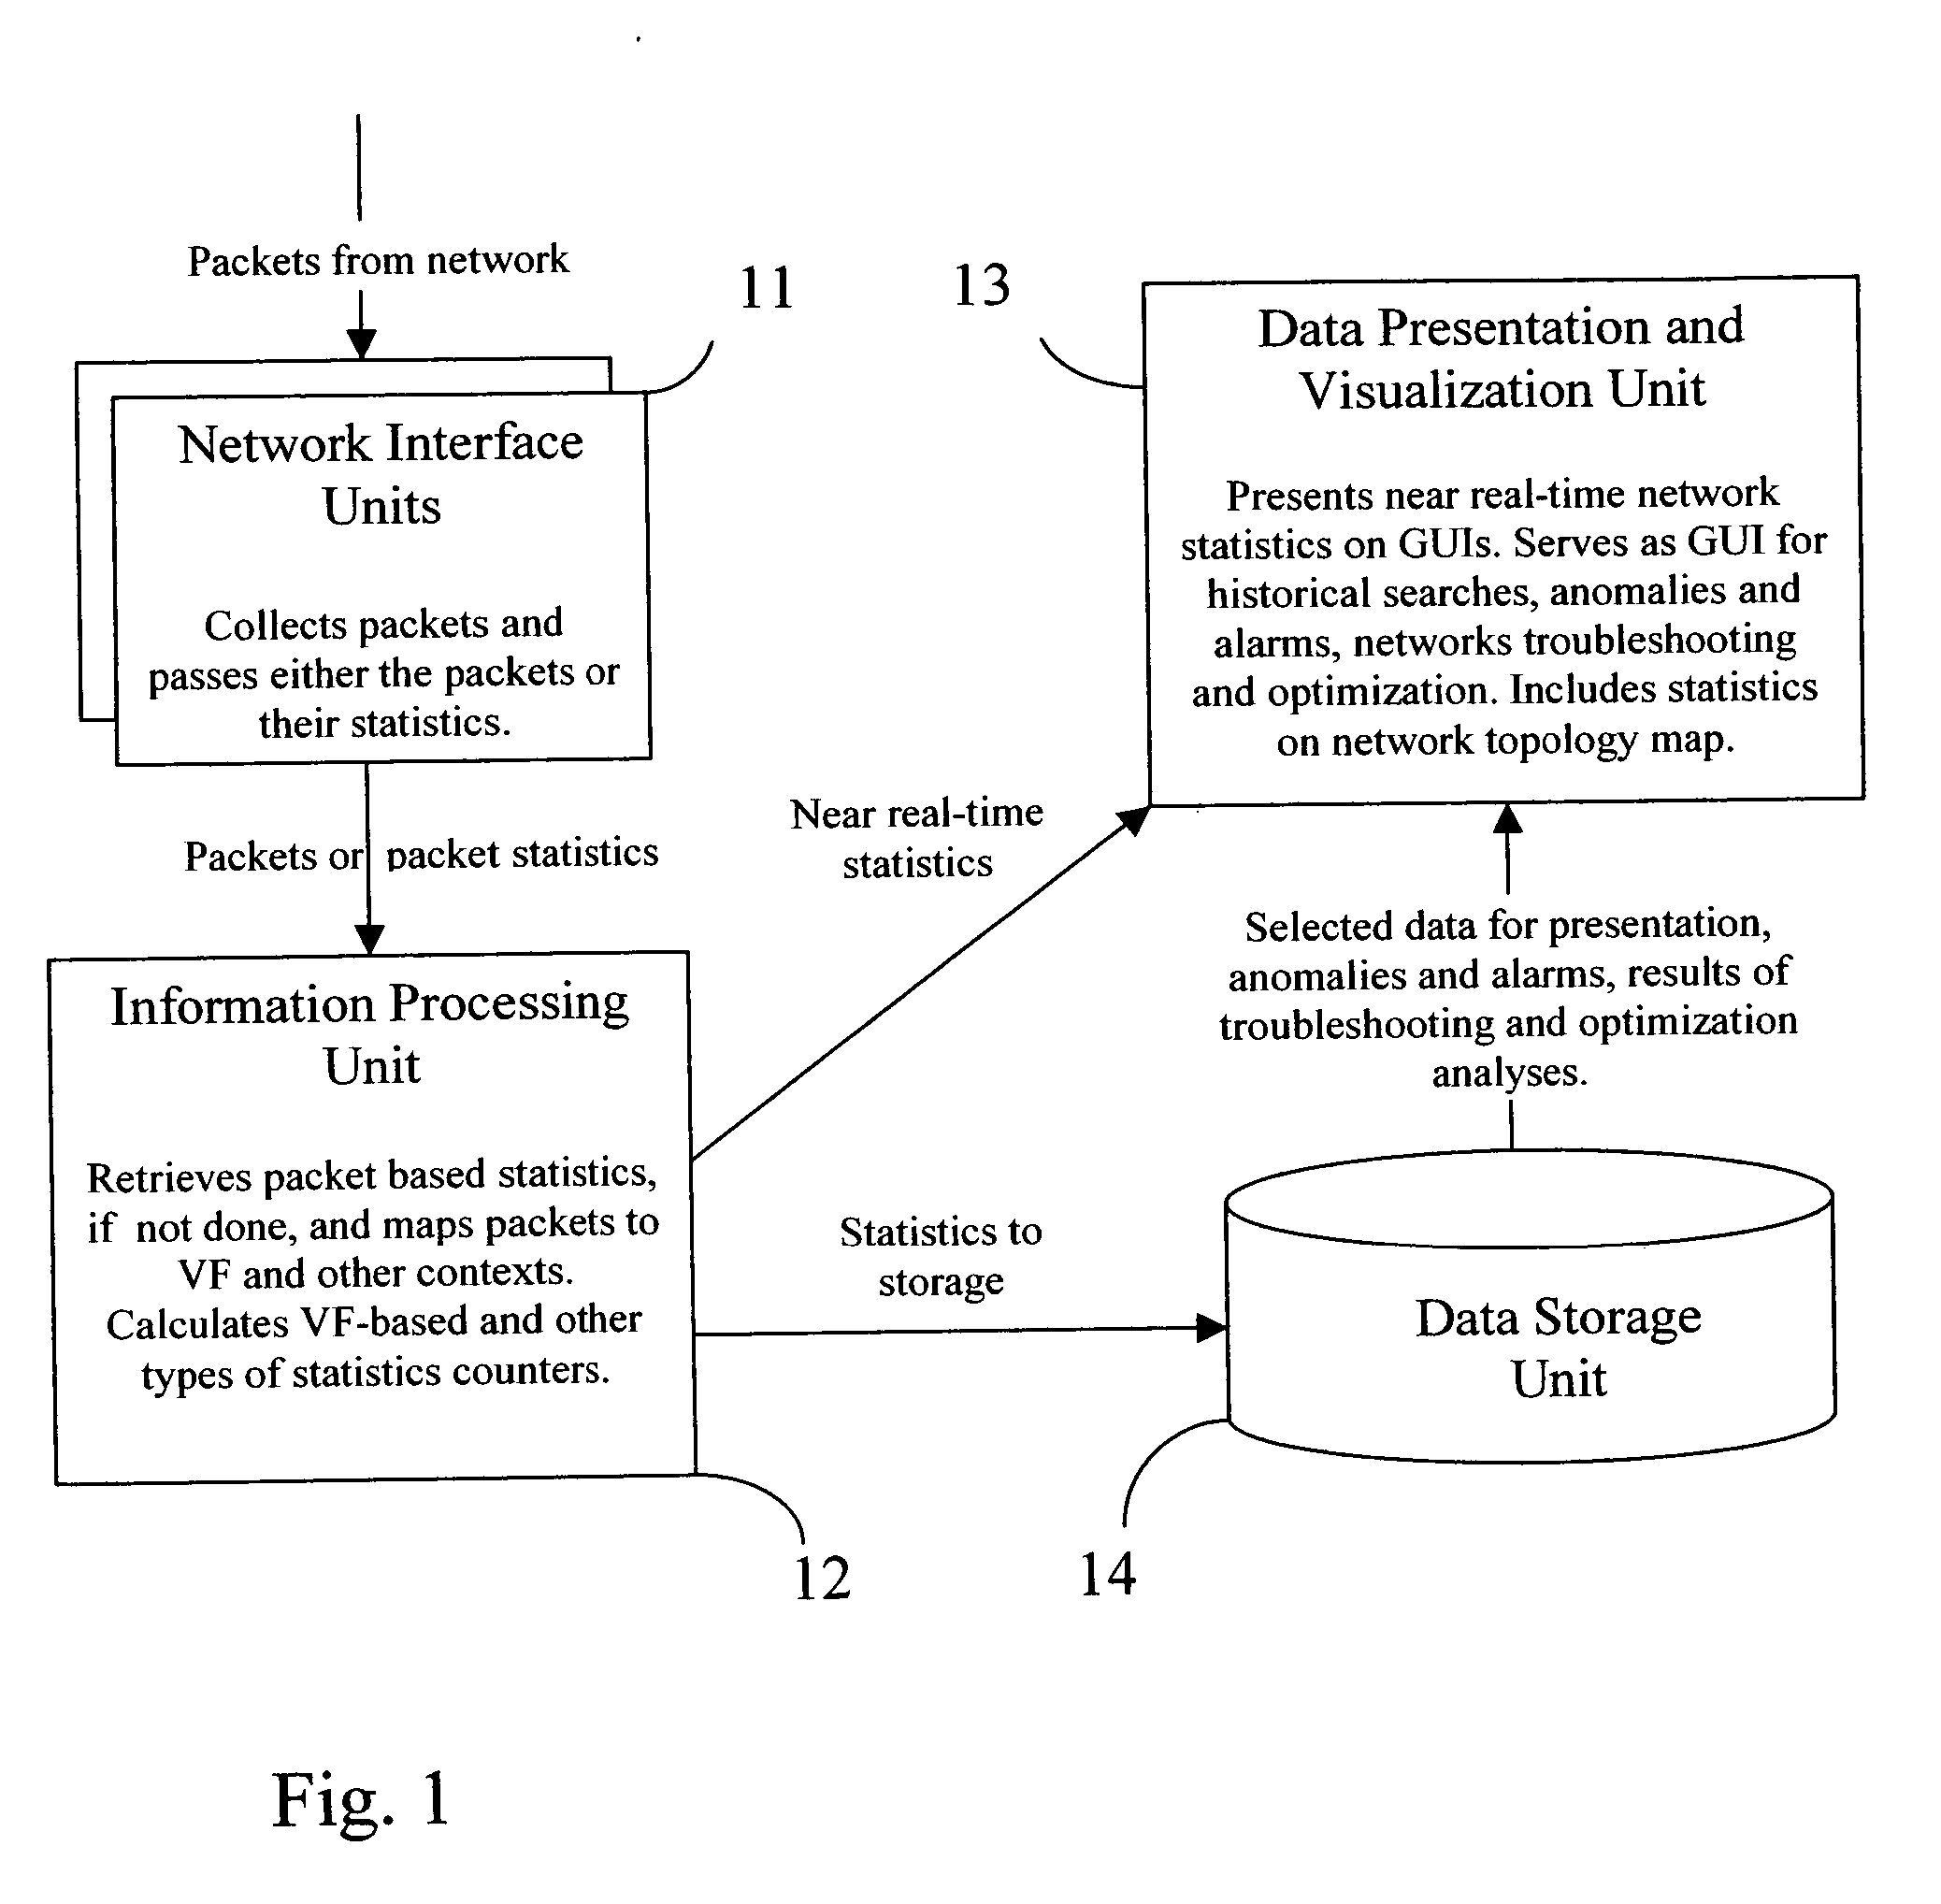
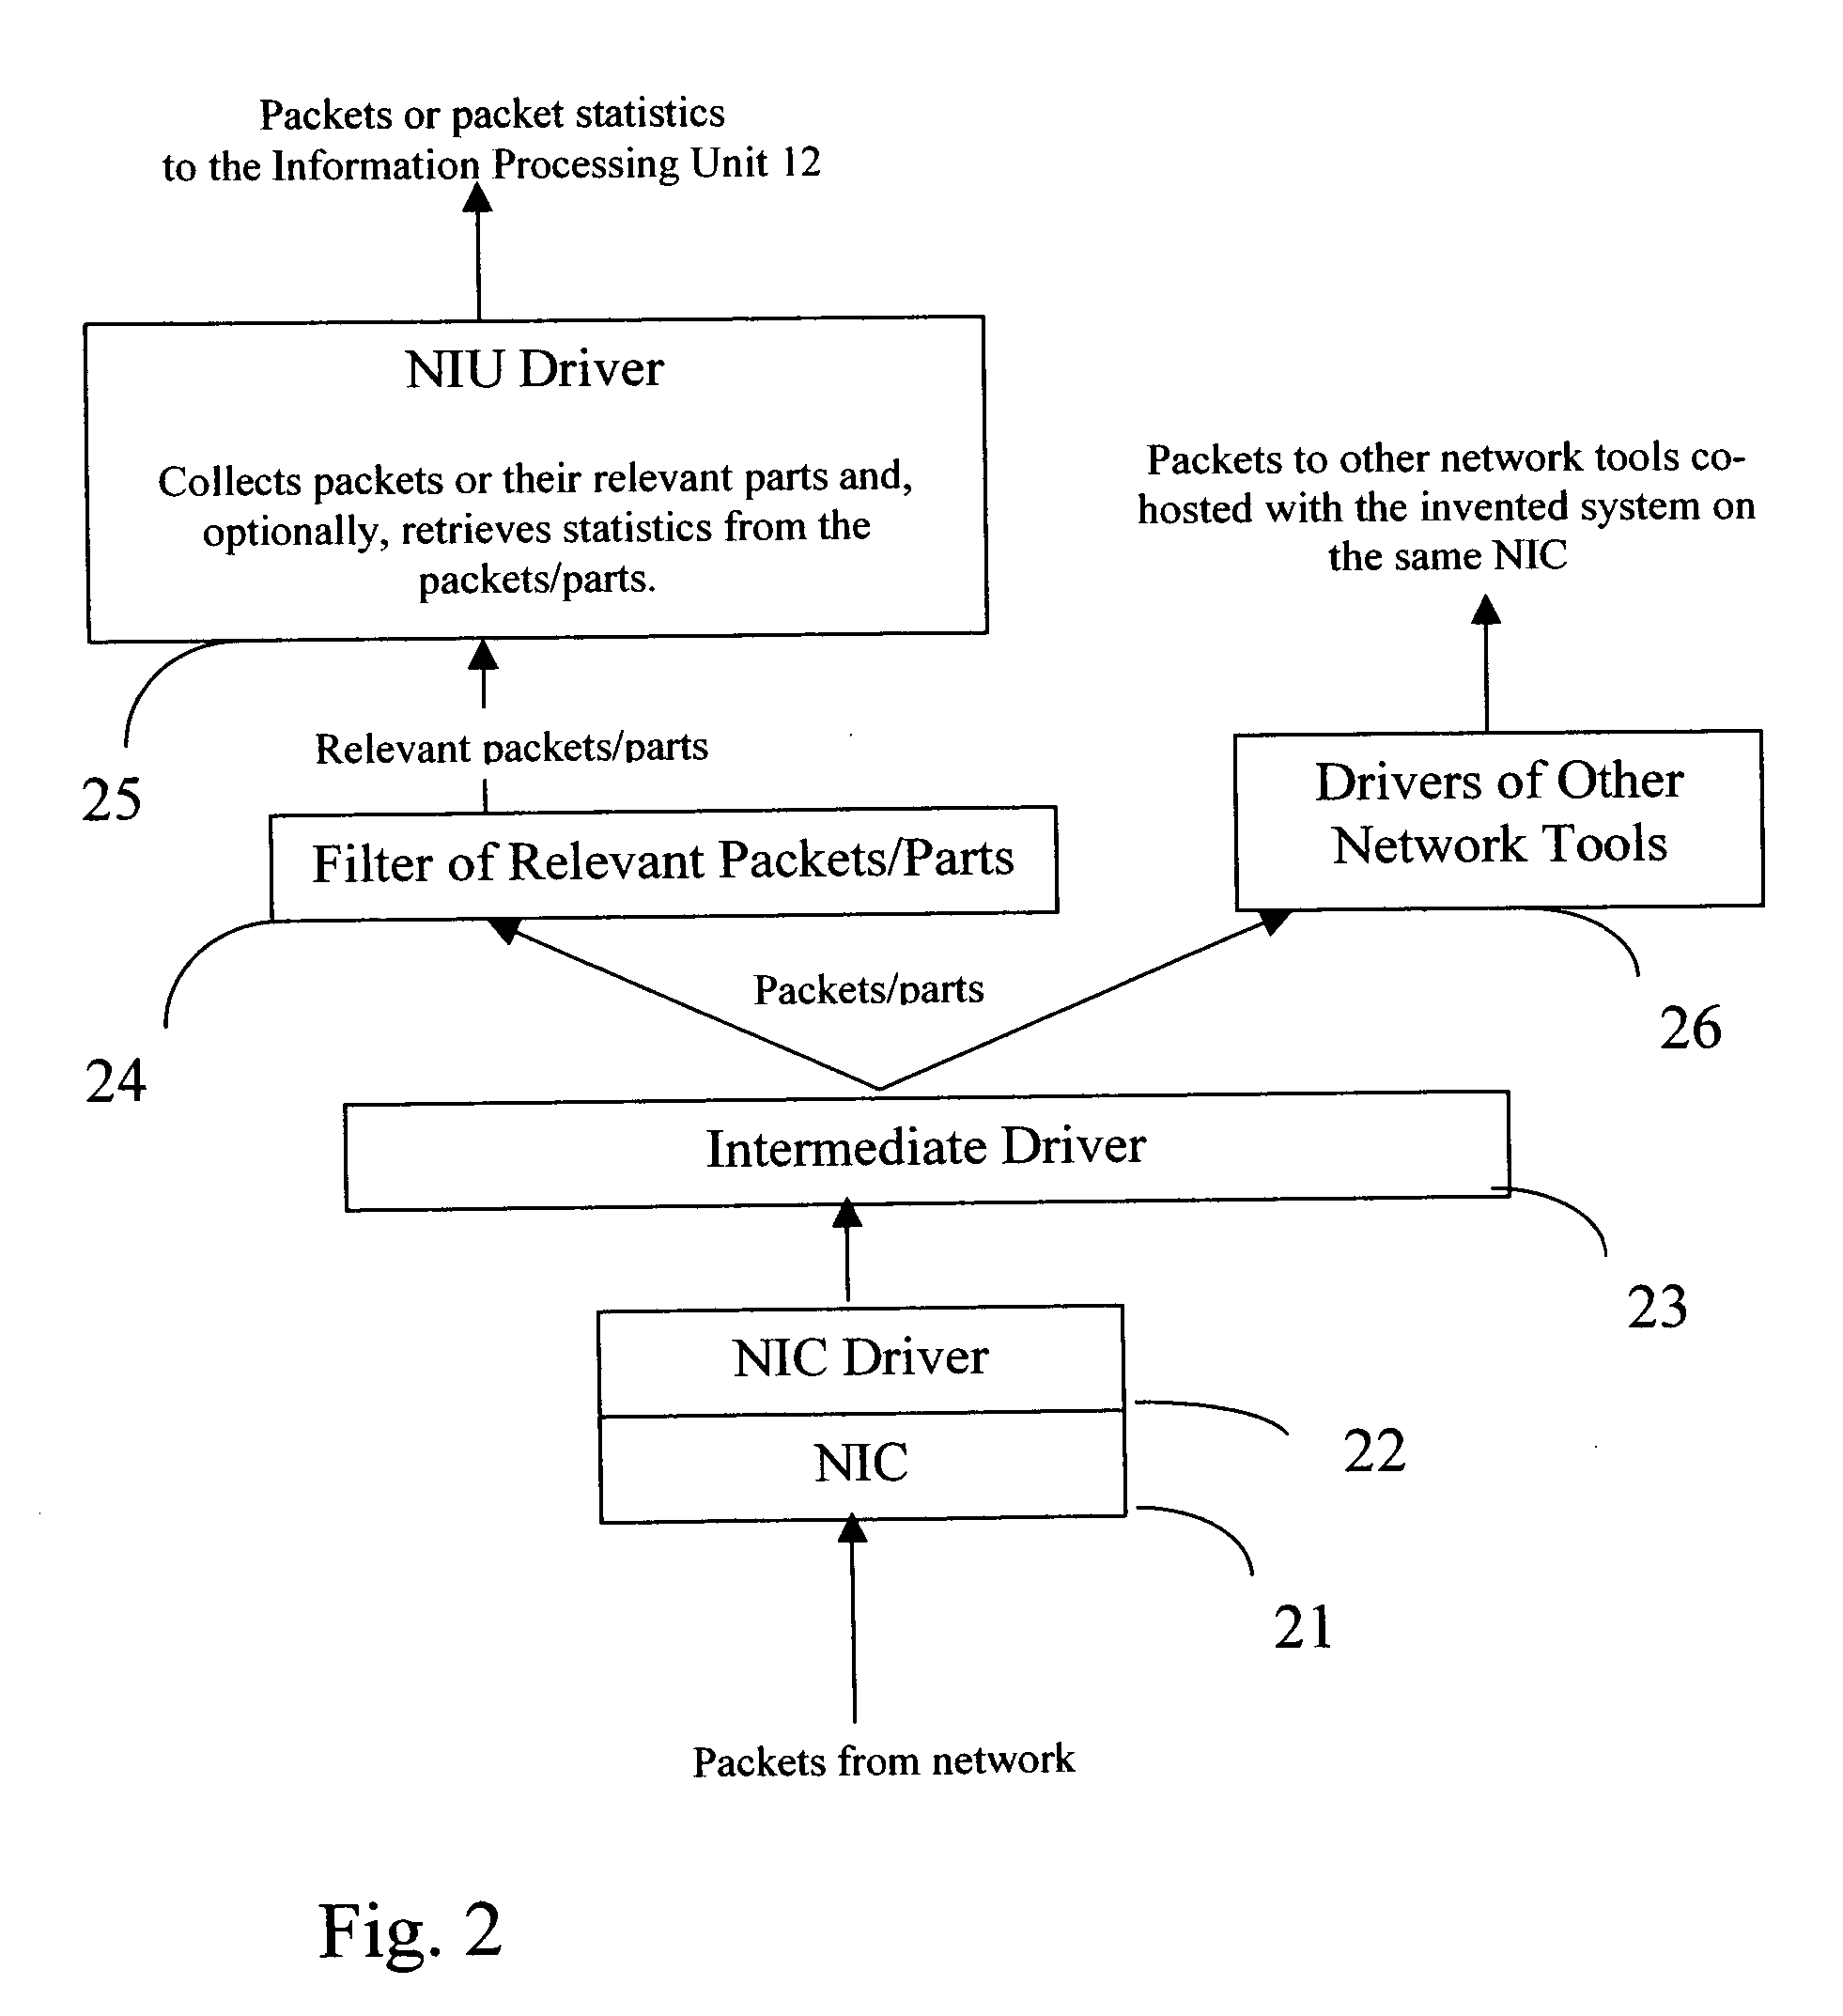
[0046]FIG. 1 depicts the flow and unit-level functionalities of the invention. All valid packets of the network are collected by one or several Network Interface Units (NIUs) 11 and passed further as raw packets. Alternatively a packet-based statistics may be collected and passed to an Information Processing Unit (IPU) 12. The IPU 12 performs mapping of packets or packet-based statistics to virtual flows (VFs), calculates packet-based statistics (if not done before) and updates a VF-based statistics as well as other types of statistics, such as application based, IP-based, aggregate-virtual-flow based, etc., according to the configuration of the invented device. The VF-based and other types of statistics are passed to a Data Presentation and Visualization Unit (DPVU) 13 and to a Data Storage Unit (DSU) 14. The DPVU 13 presents on GUI near real-time statistical information, including statistics depicted on the network topology diagram, and provides searchable interface to the data st...


PUM


Abstract

The present invention is a computer system and a method for gathering, processing and analysis of network information resulting in presentation and visualization of packet networks in the form of individual virtual flows, sometimes also called connections or sessions, containing their statistical characteristics in a time-sampled dynamics. The system, deployed as a separate device or co-hosted with other network devices, collects and processes information from all valid packets in network, classifies and maps gathered statistics to the statistics of relevant virtual flows. The statistical information is further processed by the system to provide near-real presentation, as well as stored in a searchable database for future analyses. The invention to be used by network engineers and administrators as a tool for a near real-time control of network traffic, as an analytical tool for solving network bottlenecks, network performance optimization and troubleshooting analyses, cutting costs by optimizing network layout, appropriate organization of traffic and intelligent configuration of QoS, routers and other network devices.

Description

TECHNICAL FIELD OF THE INVENTION [0001] The present invention relates generally to computers and packet networks and in particular to network monitoring, gathering of statistical information and using it for network troubleshooting and improvement of networks performance and traffic optimization. Common Abbreviations: [0002] FTP—file transfer protocol; [0003] GUI—graphical user interface; [0004] IDS—intrusions detection system; [0005] IP—internet protocol; [0006] LAN—local area network; [0007] MAC—medium access control; [0008] NIC—network interface card; [0009] QoS—quality of service; [0010] RTT—round trip time; [0011] SLA—service level agreement; [0012] TCP—transmission control protocol; [0013] UDP—user datagram protocol; [0014] WAN—wide area network; Non-Common Abbreviations: [0015] AGVF—aggregate-virtual-flow; [0016] DPVU—data presentation and visualization unit; [0017] DSU—data storage unit; [0018] IPU—information processing unit; [0019] NE—network element. [0020] NIU—network ...

Claims


Application Information

Patent Timeline
IPC IPC(8): H04J1/16G06F11/30G06F15/00G06F17/10G06F17/40H04L12/24H04L12/26
CPCH04L41/142H04L41/22H04L41/5003H04L43/18H04L43/026H04L43/08H04L41/5096
Inventor IAKOBASHVILI, ROBERTNEWMAN, HANOCH
Owner IAKOBASHVILI ROBERT
Learn More