Methods and apparatus for analyzing an analysis fluid

a technology of analysis fluid and analysis method, which is applied in the field of methods and apparatus for analyzing an analysis fluid, can solve the problems of limited features of consumers and users, limited current system design, and limited use of glucose measurement, so as to reduce the surface area of the chemistry matrix, reduce the need for test field surface and blood volume, and achieve the effect of simple transmittance measuremen

Inactive Publication Date: 2006-02-16
KLOEPFER DR HANS
View PDF27 Cites 121 Cited by
  • Summary
  • Abstract
  • Description
  • Claims
  • Application Information

AI Technical Summary

Benefits of technology

[0023] Measuring transmittance through a non-scattering chemistry matrix offers distinct advantages over reflectance or electrochemical measurement. One advantage is that the surface area of the chemistry matrix can be kept minimal. By contrast, in highly scattering media the reflected light is laterally dispersed as quantified by the point spread function which strongly depends upon the scattering characteristics of the chemistry matrix. This ‘blooming’ effect requires the light source to illuminate an area well inside the boundary of the active chemistry matrix. For example, to account for manufacturing tolerances, a 3 mm diameter light spot would typically require a 6 mm diameter chemistry pad. When measuring transmittance through a non-scattering media, light absorption is locally focused and the chemistry matrix could be as small as 3 mm when using a 2 mm diameter light spot. This reduction from a 6 mm to a 3 mm diameter reduces test field surface and blood volume needed by a factor of four.
[0024] A second advantage is that the transmittance measurement is simpler than the reflectance measurement. For a reflectance measurement, the overwhelmingly dominant signal in the detection region is specular reflection from the surface of the analyte pad. This specular reflection is typically devoid of specific analyte-related information, thus greatly enhancing background noise while simultaneously diminishing useful signal information contained in the remaining diffusely scattered component of the reflection. In contrast, because of a much better S / N ratio, transmittance measurement enables faster signal integration, thus requiring less time for obtaining high precision results.
[0025] A third advantage is that transmittance measurement decreases the need for high precision electronics and shielding. High precision electronics and shielding add to the cost of the measurement system as well as the power requirements.
[0026] A fourth advantage is that a transmittance meter is easier to calibrate than a reflectance meter because: a) a transmittance measurement has a linear signal-to-mass relationship, and b) it is much more straightforward and easier to implement a matchup of the chosen LED emission range with reactant absorbance maxima. For both transmittance and reflectance, the usual route to instrument accuracy is calibration using a calibration standard measurement made contemporaneously with the analyte measurement in order to scale the source output. For the reflectance measurement, geometry demands that a known, stable calibration target must be presented to the optics for each measurement. This typically requires an onboard calibration target cleverly configured to remain clean while still being easily optically available; or alternatively the undosed teststrip can be presented as a calibration target. For the transmittance measurement the calibration can be performed by a simple measurement with nothing inserted in the optical path. Thus the transmittance measurement does not require a calibration target.
[0027] An advantage of a transmittance over an electrochemical sensimetric measurement is that a visual backup optical indicator (color comparison chart) can be provided that allows immediate check of extreme (and possibly aberrant) readings in what could be an emergency situation.
[0028] In comparison to the current state-of-the-art, the embodiments of the present invention can include several novel features, including the following: (1) because cells do not adhere to ‘film’ when blood is pulled through the capillary channel, the need for a discrete plasma separating member (cell filter) can be eliminated; (2) owing to laminar flow of blood over ‘film’, the need for a blood spreading layer, as required in many other current test strips, can be eliminated (Together, these two features enable ultra-miniaturization, making the method minimally invasive and virtually pain-free.); (3) since cellular component and excess blood is continually removed from ‘film’, cells are inhibited from clogging or temporarily covering the test field surface (This ‘mobile sample’ feature renders the device essentially independent from interference by hematocrit.); (4) linear optical signals can be acquired from transmittance measurement; in contrast, all present instrumented calorimetric test strips monitor reflectance, relying on a standard curve that is (a) non-linear at all concentrations, and (b) based on an inverse and complicated (Kubelka-Munk) relationship between concentration and reflectance (The capacity for linear measurement simplifies product development and meter calibration.); (5) visual backup or visual monitoring, which is especially important in environments with limited infrastructure and resources (cost or unavailability of meters, batteries, etc.), but also appreciated by those who prefer visual backup to confirm the test results displayed by an electronic device; and (6) incorporation of all operational elements into a single disposable consolidated test wand (which has never before been accomplished), makes testing extremely easy, fast, and thus highly accessible.

Problems solved by technology

As will be explained in more detail, most current SMBG systems, whether designed for patient or professional use, still have significant limitations.
From a provider perspective, the main shortfall is that current systems are generally limited to the measurement of glucose.
From a user point of view, there are still limitations in those features that consumers and users believe to be important, such as (1) minimal invasiveness; (2) speed of analysis and (3) ease of performance and minimal complexity (inconvenience) from primary and auxiliary product mixes.
Non-invasive and minimally invasive technologies have been under active development for years, but made it to market only on a very limited scale due to technical difficulties.
This technique has limitations with respect to constancy of volume applied and locations on the test field surface contacted by the drop.
However, since the two can usually not be completely spatially separated, pure signals are by definition unobtainable (‘needle in a haystack’ phenomenon).
This is one reason why it is so difficult to achieve universal standardization of these systems and why the systems differ so much among each other, resulting in widely scattered method means in proficiency testing surveys.
Another limitation resides in the method by which cellular component of blood is separated from plasma.
Cells were then manually removed from the site of blood application by either washing or wiping, potentially giving rise to significant operator-induced errors.
An adverse consequence is that spatial separation of red cells from the site of measurement is then so small that the thin zone of separation material that is devoid of cells incompletely shields cells.
However, such corrective methodology makes measurements more complex and less precise.
The shining through effect of red cells is particularly disadvantageous for visual interpretation.
Unfortunately, the feature of visual backup is realized only in a minority of present-day systems.
The goal for the SMBG market, a completely non-invasive glucose monitoring technology, although pursued for over a decade, has so far proven elusive, despite perennial promises from companies in the industry.
These failures have led to predictions that completely non-invasive optical technology (infrared or other) may not make it to market in any significant way, for both cost and technical reasons.
It is also argued that this lack of success was predictable from early theoretical considerations of signal engineering.
Clark error grid presentation shows performance that is not acceptable for home glucose meters.”
Reported problems with IF sampling are variations in skin thickness and permeability, changes in blood / IF equilibration, sweating, signal instability and skin irritation.
Despite these improvements, a major limitation of sensor methods is that visual backup is completely lost.
This places a very heavy burden on the manufacturer as even minor flaws in test strip architecture or signal conductivity could have disastrous consequences.
Furthermore, in these devices signal output is, as in the case of reflectance measurement, non-linear with respect to concentration, requiring complex mathematics for calibration.
Finally, the technical sophistication and manufacturing complexity of the sensor methods makes it difficult to produce them at low cost.
In this environment a market conversion from established and affordable invasive whole blood technology to unproven and costly non-invasive systems appears unlikely.
However, it is expected that the market will migrate to invasive systems which minimize invasiveness and its associated pain.

Method used


Image

  • Methods and apparatus for analyzing an analysis fluid
  • Methods and apparatus for analyzing an analysis fluid
  • Methods and apparatus for analyzing an analysis fluid

Examples


second embodiment

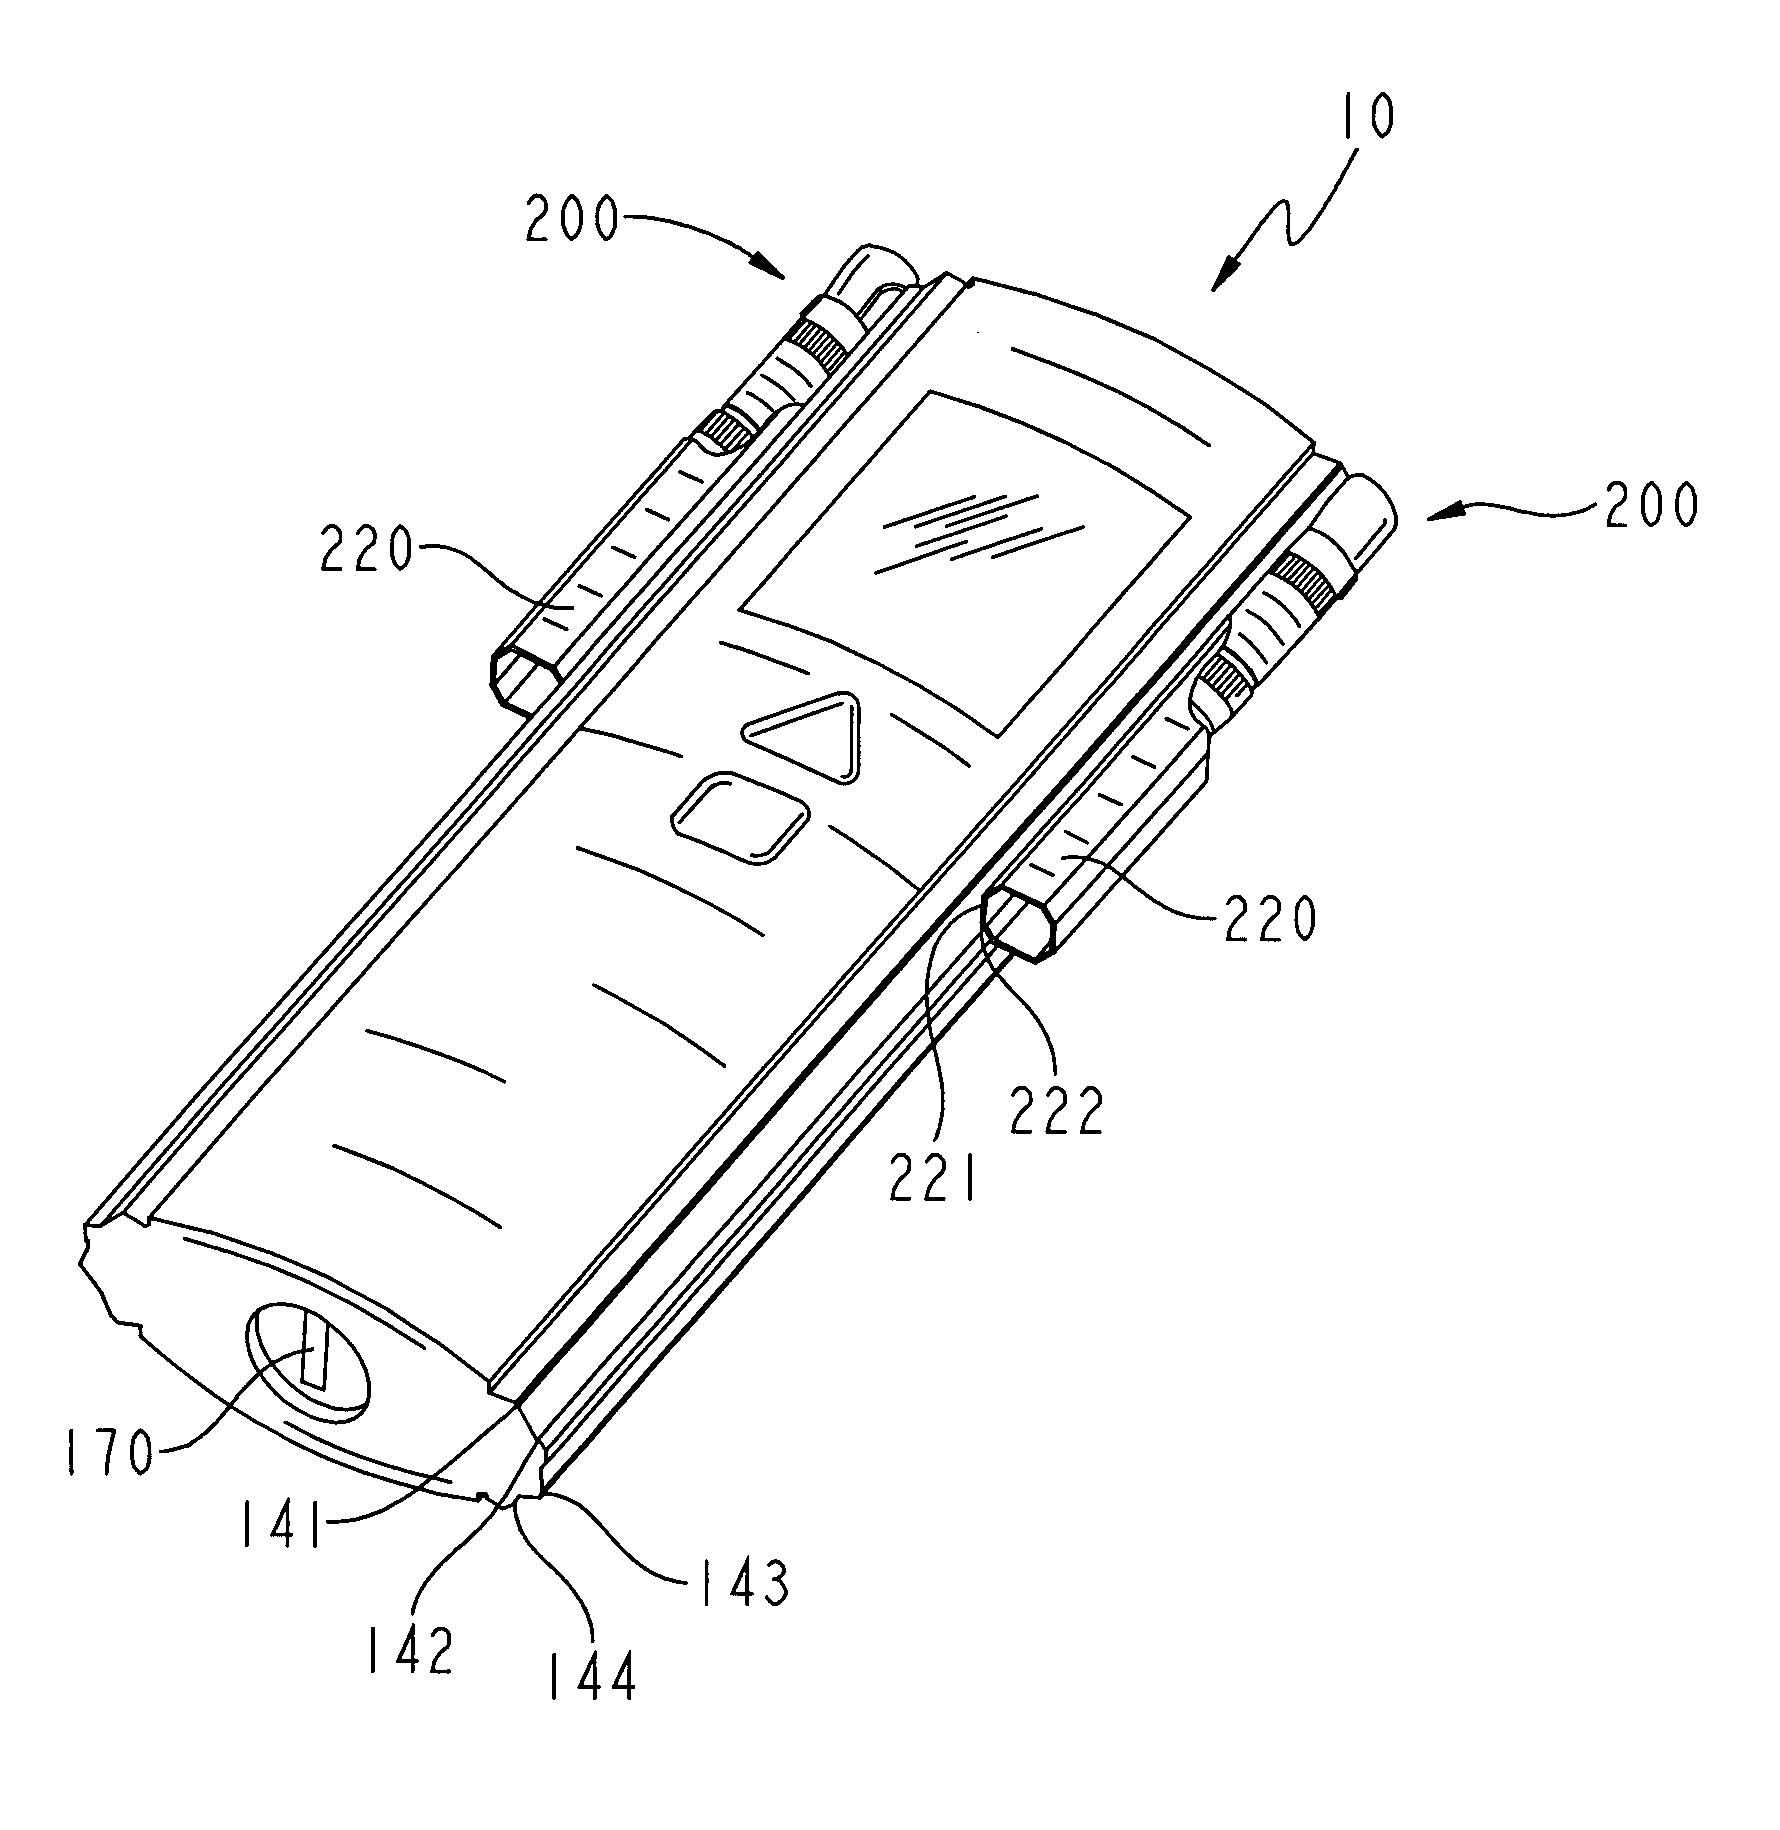
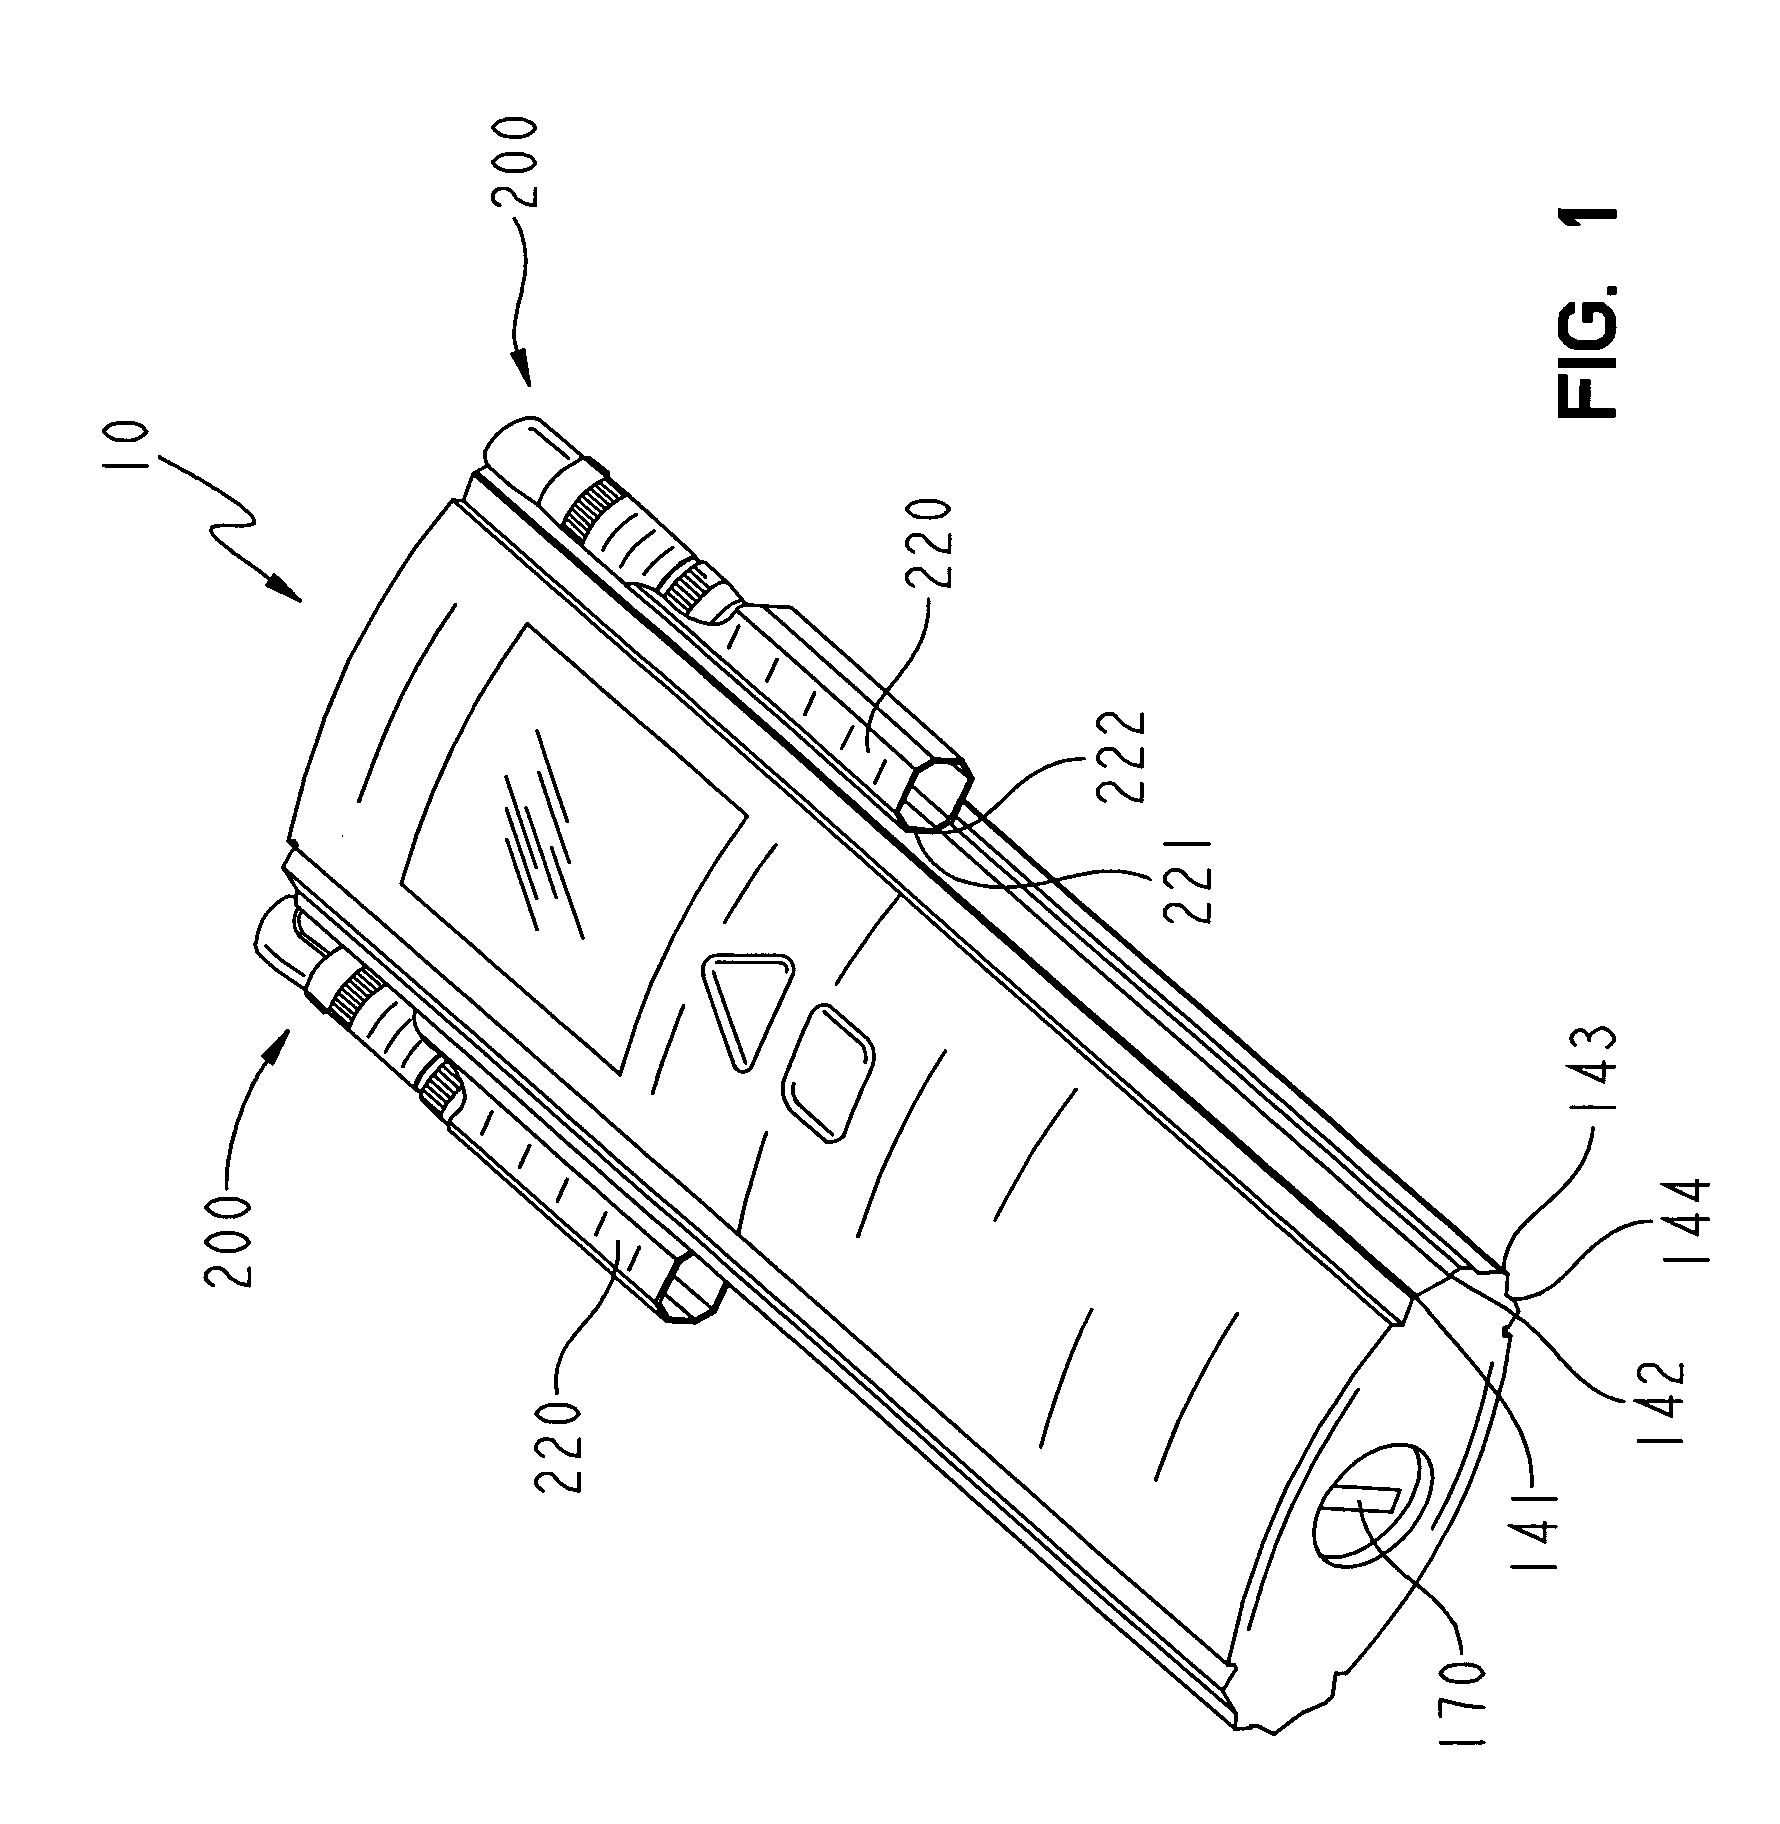
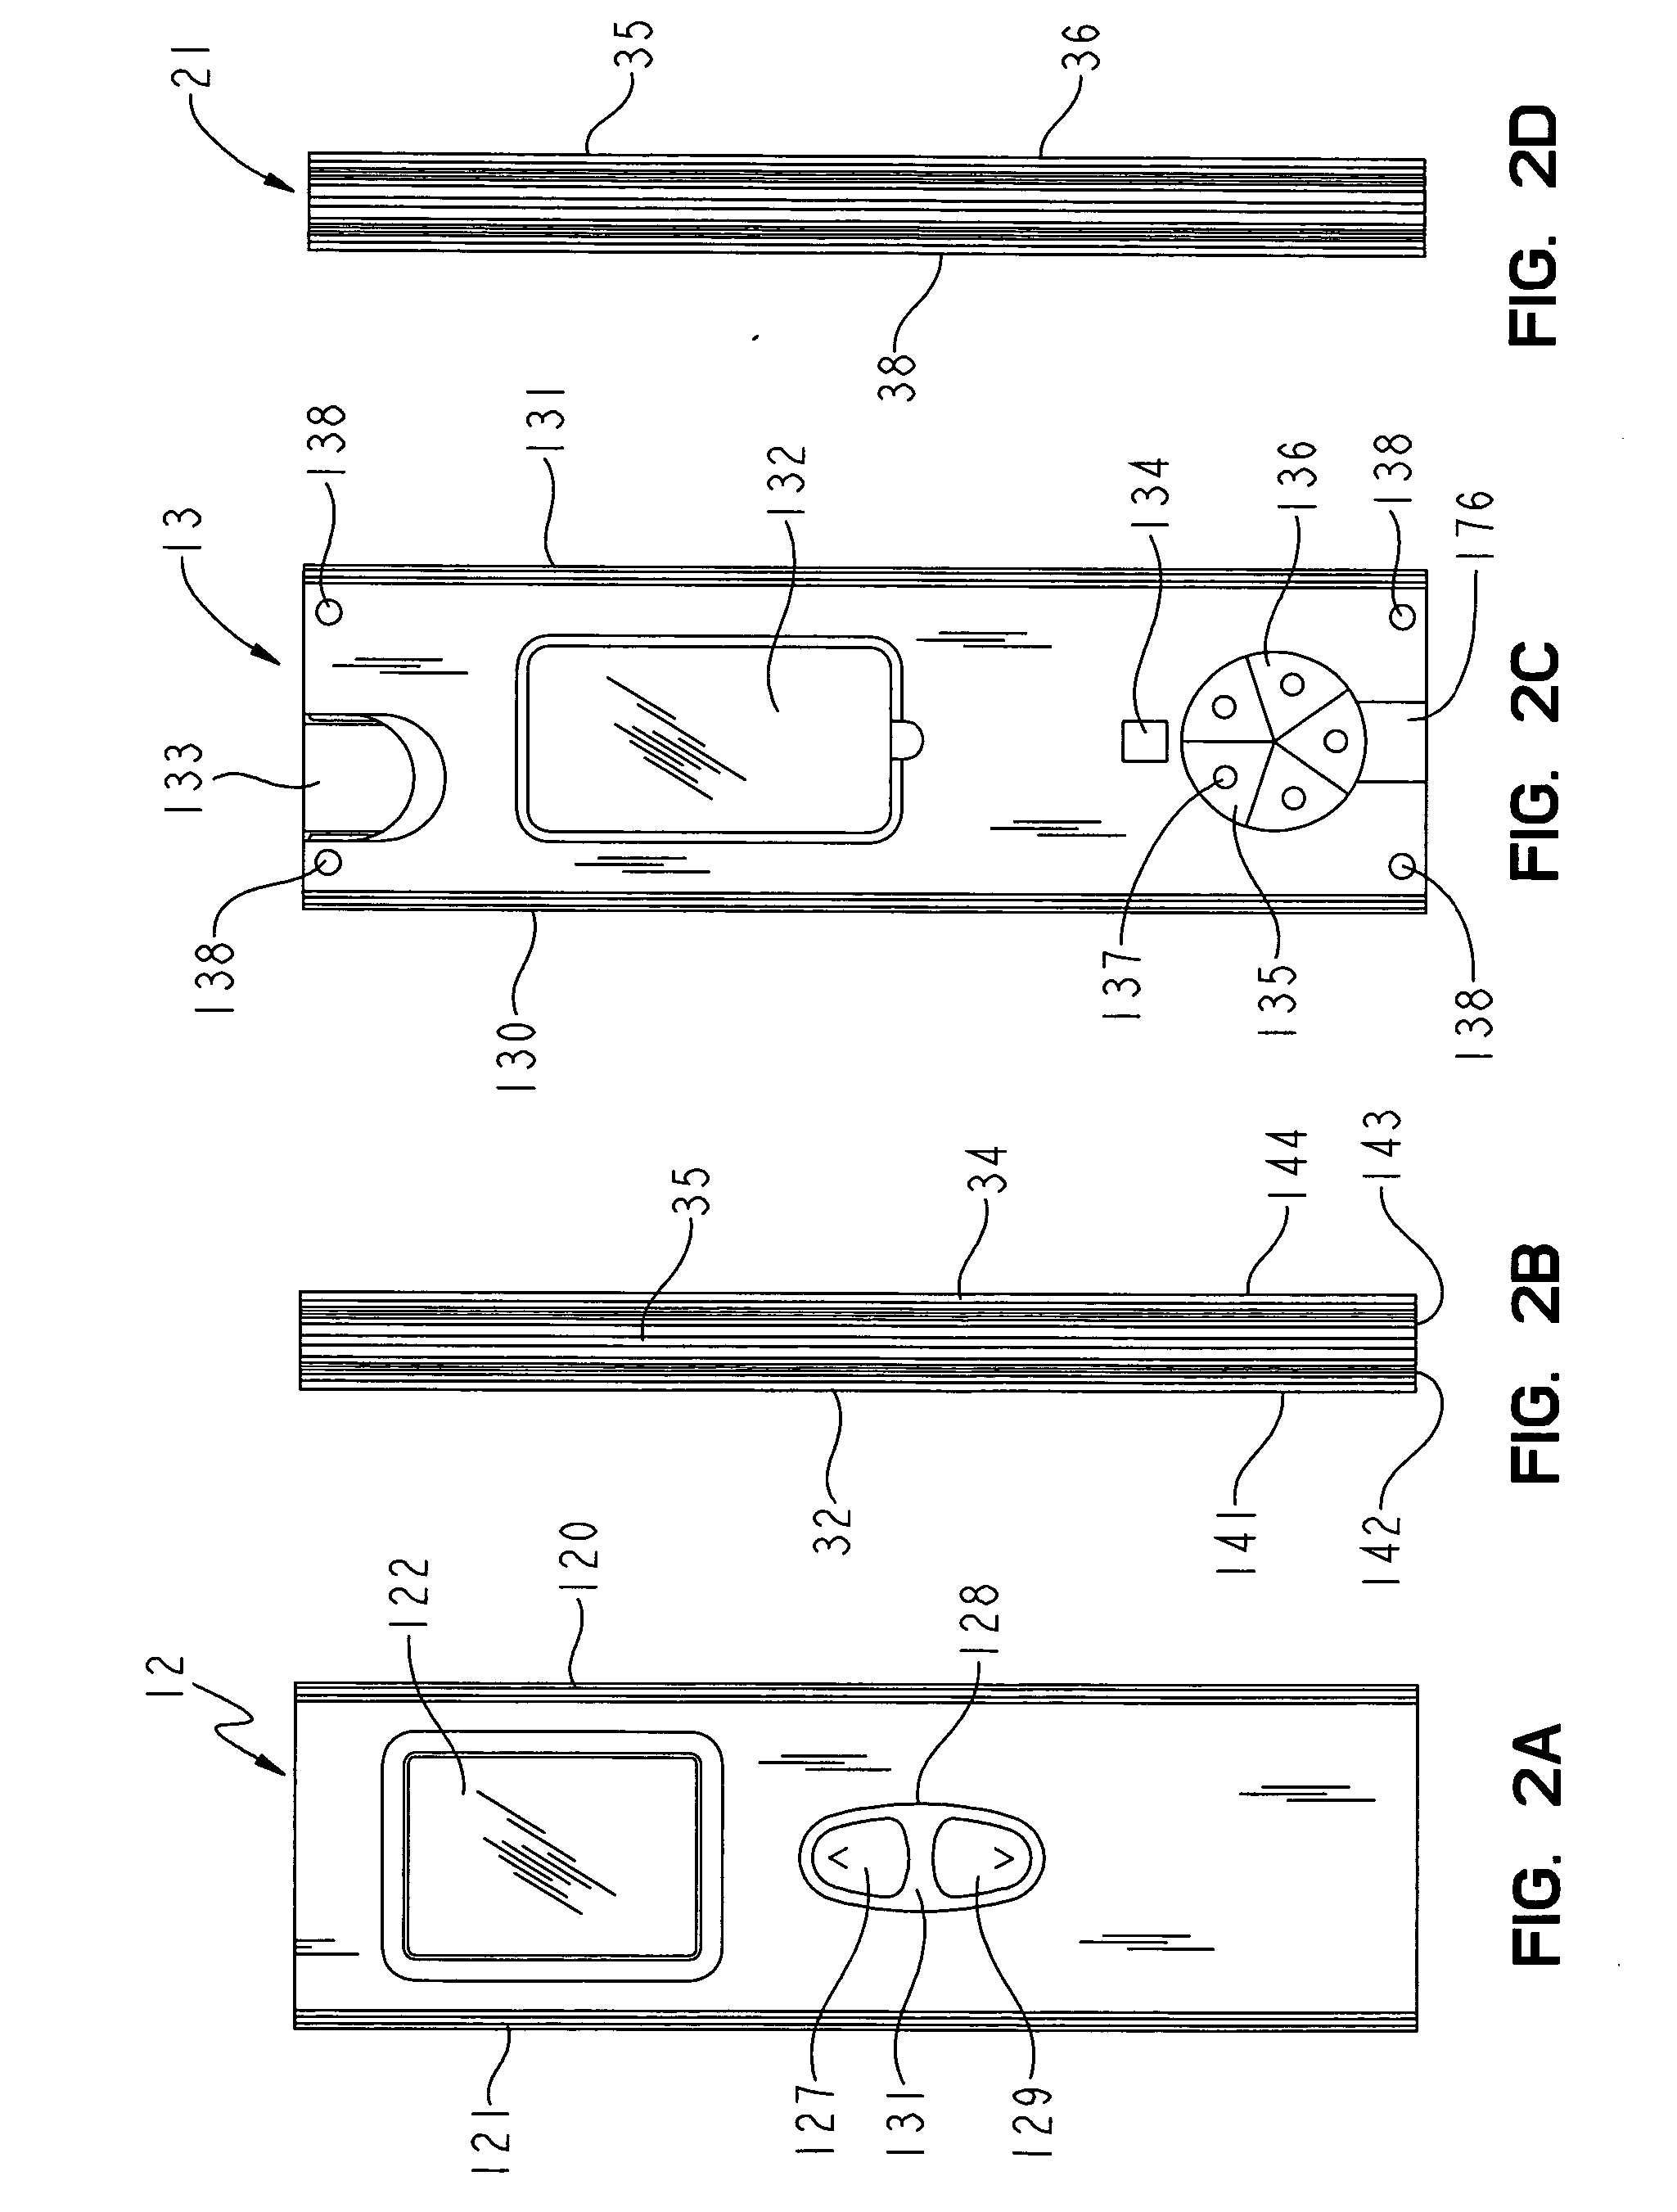
[0064] The meter 10 also includes a display 122 for the display of information, and one or more buttons to control the meter 10 and the display of information on the display 122. FIG. 3B shows one embodiment of the meter 10 with two buttons, an upper triangular button 124 to scroll through information displayed on the display 122, and a lower square button 126 to select displayed information for the control of meter functions. FIG. 2A shows the meter 10 with an elongated toggle button 128 to control meter functions. The toggle button 128 includes an upper portion 127 and a lower portion 129 to scroll up or down, respectively, through the information displayed on the display 122, and a central portion 125 that can be depressed to select the desired item displayed on the display 122.

[0065] The case back 13, best shown in FIG. 2C, includes a battery cover 132, a code chip slot 133, a light pipe opening 134, a color chart 136, a visual back-up test wand opening 176, and rubber feet 138....

first embodiment

[0078] The first embodiment to be described for cooperative processing of a blood sample by the meter 10 and the consolidated test wand 200 is the panel separation method shown in FIGS. 5-10 and 19.

[0079] The test strip 204 used in the panel separation method includes an upper panel 205; a lower panel 203; a left side spacer 207 and a right side spacer 209. The upper and lower panels 205, 203 are hingedly attached at the proximal end 240 of the test strip 204 and are preferably made of transparent plastic. The upper and lower panels 203, 205 can be attached by various methods known in the art, including, for example, double stick tape or ultrasonic welding. The left and right side spacers 207, 209 separate the upper and lower panels 205, 203 creating a channel 201. FIG. 9 shows an exemplary, but out of proportion cross-section of the distal end 242 of the test strip 204 showing the channel 201. The channel 201 is surrounded on the left and right by the left and right side spacers 20...


PUM

PropertyMeasurementUnit
volumeaaaaaaaaaa
diameteraaaaaaaaaa
diameteraaaaaaaaaa

Abstract

A meter and test wand system is capable of cooperatively processing an analysis fluid and communicating results to a user. The system includes a meter case including a case front, a case back, a case top, a case bottom, a first case side member, and a second case side member. The first and second case side members connect the case front to case back. The first case side member has a longitudinal dimension between said case top and said case bottom and a latitudinal dimension between said case front and said case back. The first case side member includes a first case ridge; A test wand is capable of receiving an analysis fluid, and includes a cartridge including a cartridge ridge. The cartridge ridge is sized and shaped to matingly engage with said first case ridge to connect said test wand to said meter case.

Description

BACKGROUND OF THE INVENTION [0001] Diabetes has been referred to as the “undiagnosed epidemic of the third millennium”. Some experts predict the number of diabetics world-wide to triple over the next 15 years to about 320 million. Self-monitoring of blood glucose (SMBG) is considered the quintessential prerequisite for diabetes management and treatment. As will be explained in more detail, most current SMBG systems, whether designed for patient or professional use, still have significant limitations. [0002] The three major types of diabetes are type 1 (formerly insulin-dependent diabetes mellitus, IDDM, juvenile-onset), type 2 (formerly non-insulin-dependent diabetes mellitus, NIDDM, adult-onset), and gestational diabetes. About 130,000 children in the US have type 1 diabetes. Treatment for type 1 consists of insulin injections, diet and exercise. [0003] In type 2 diabetes, treatment may include insulin, but preferably oral glucose lowering agents, diet, weight reduction and exercis...

Claims


Application Information

Patent Timeline
Patent Type & Authority Applications(United States)
IPC IPC(8): G01N33/48C12Q1/54
CPCA61B5/14532A61B2560/0406A61B2562/0295
Inventor KLOEPFER, HANS G.KLOEPFER, THOMAS P.HEIM, JASONHAFELLNER, REINHARD
Owner KLOEPFER DR HANS
Why Eureka
Try Eureka