Heterocyclic nitrogen containing polymers coated analyte monitoring device and methods of use
a monitoring device and analyte technology, applied in the direction of catheters, instruments, and semiconductor/solid-state device details, can solve the problems of lack of adequate control, difficulty in controlling and/or reproducing the average thickness and/or microscopic uniformity of the thickness of the sample, and the measurement output signal is no longer controlled by the flux of glucose, etc., to achieve a large signal-to-noise ratio and considerable sensitivity and stability
- Summary
- Abstract
- Description
- Claims
- Application Information
AI Technical Summary
Benefits of technology
Problems solved by technology
Method used
Image
Examples
example 1
Calibration Experiment
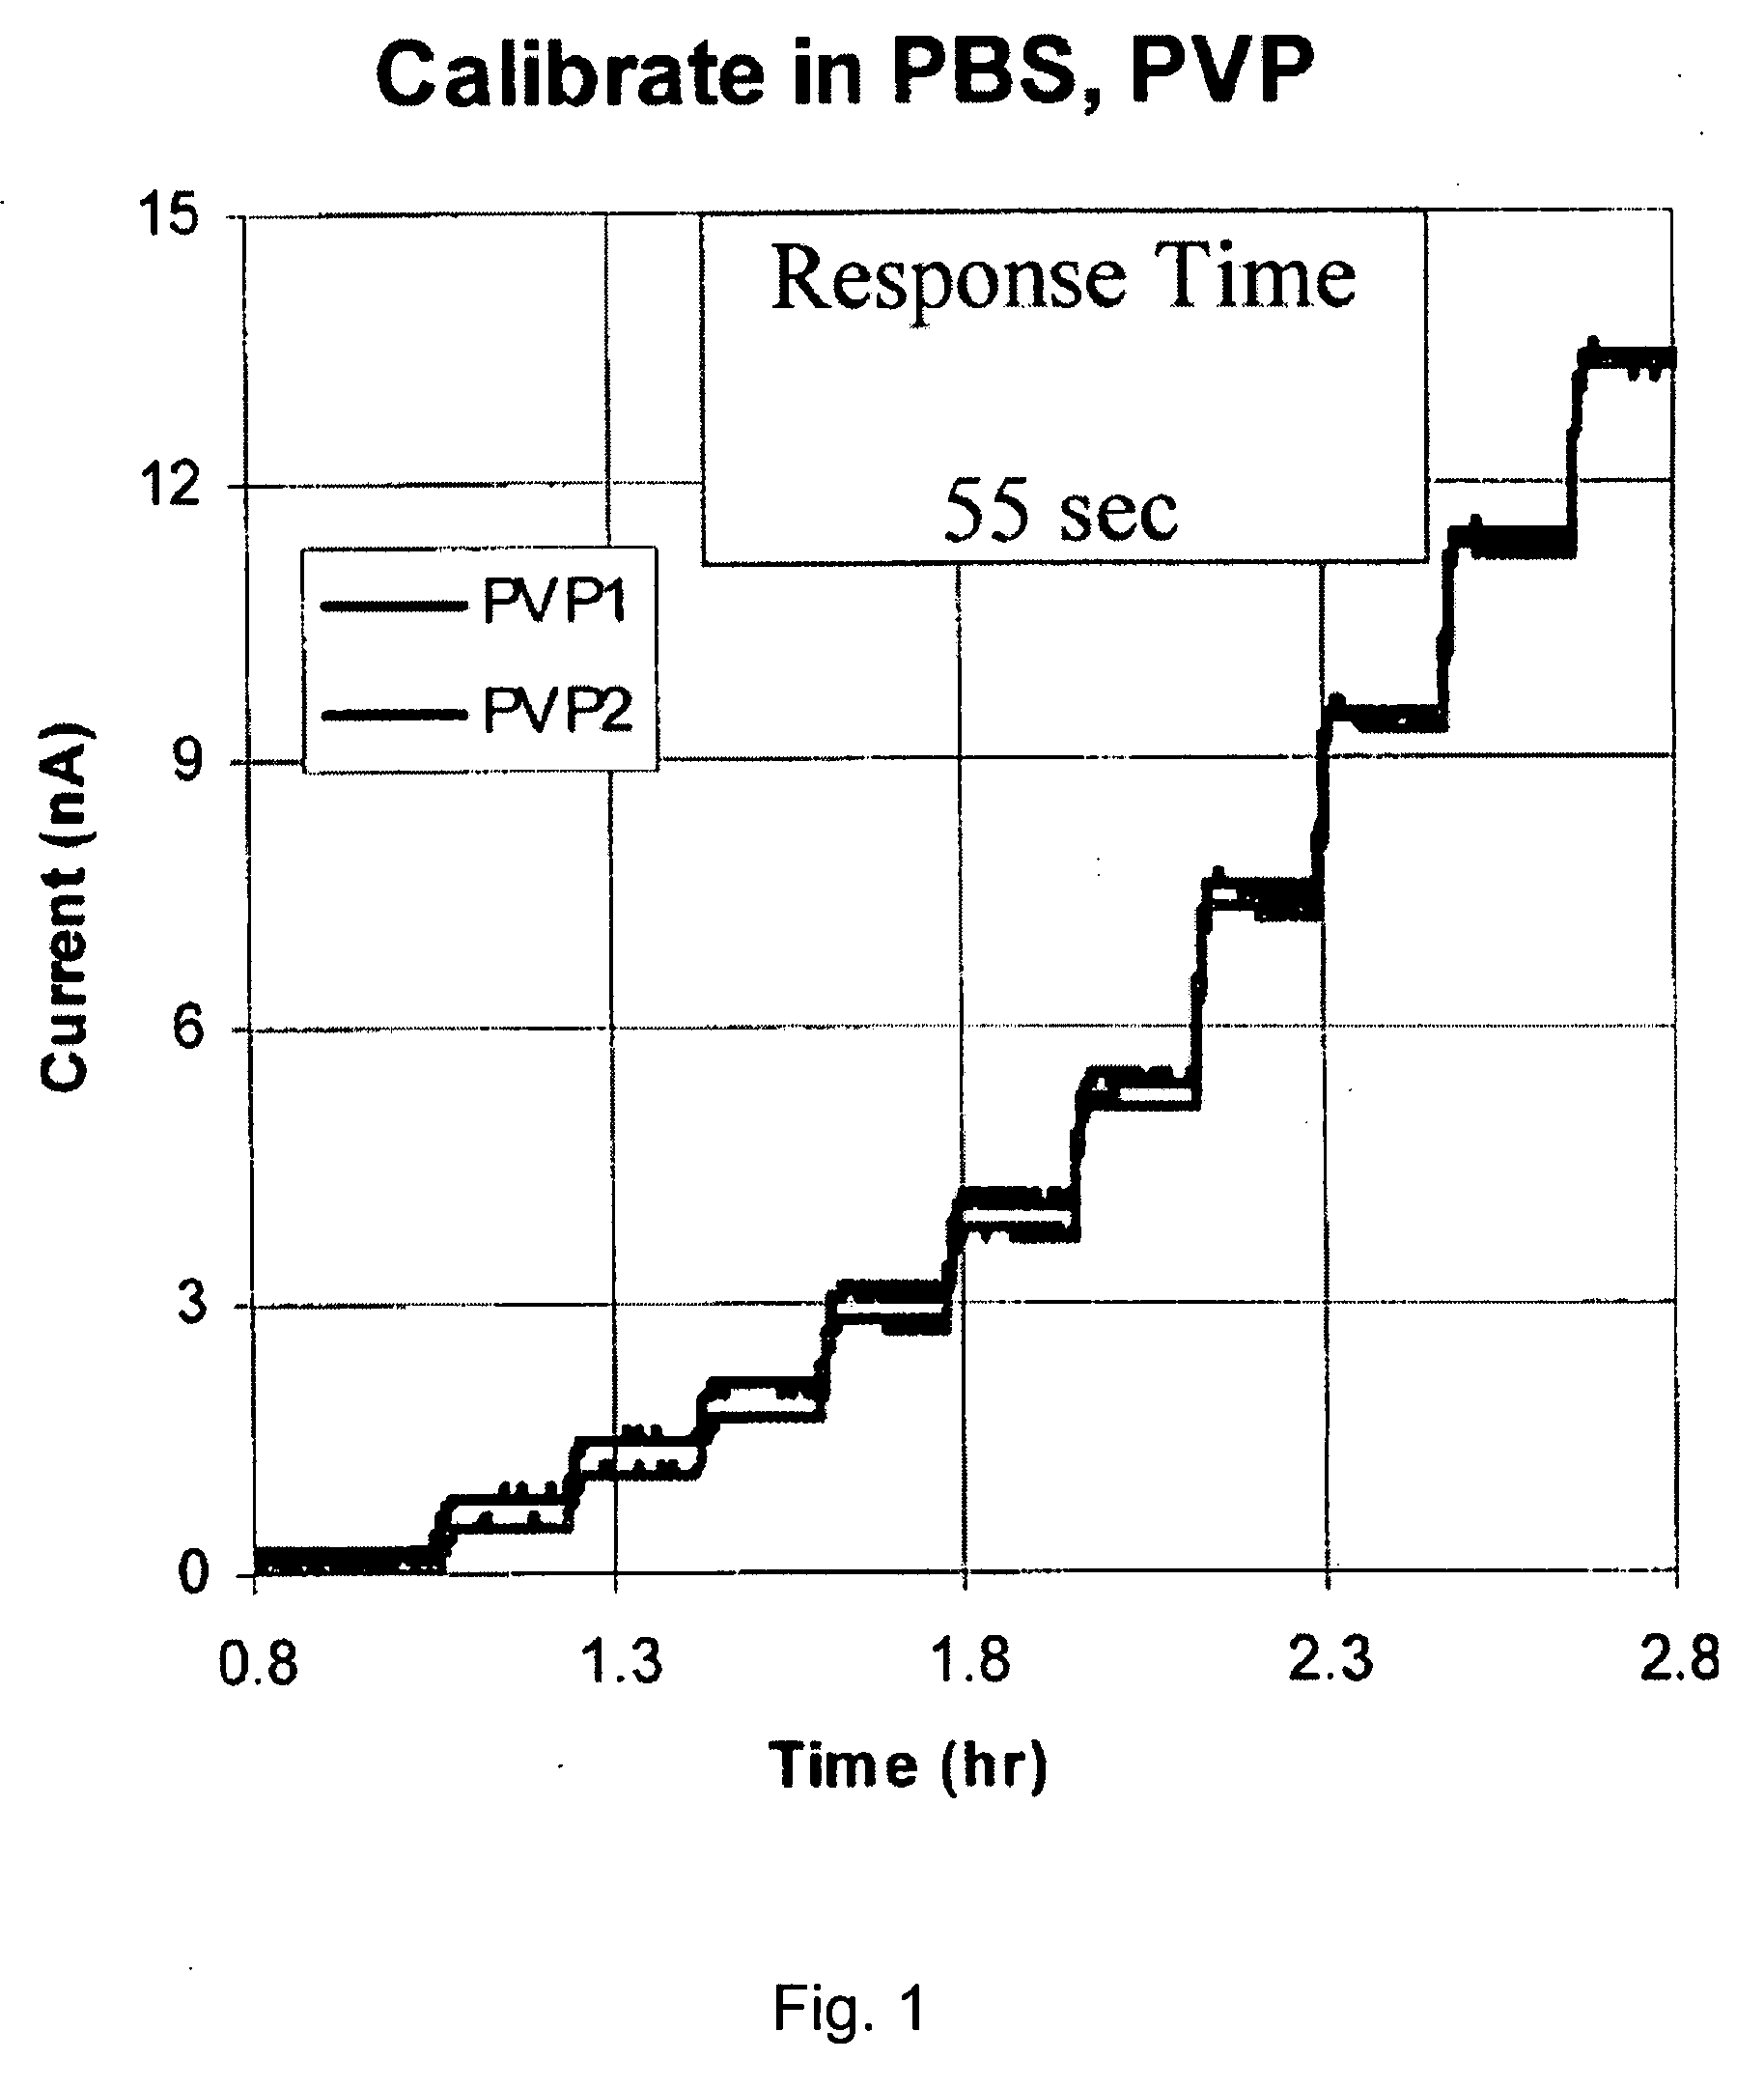
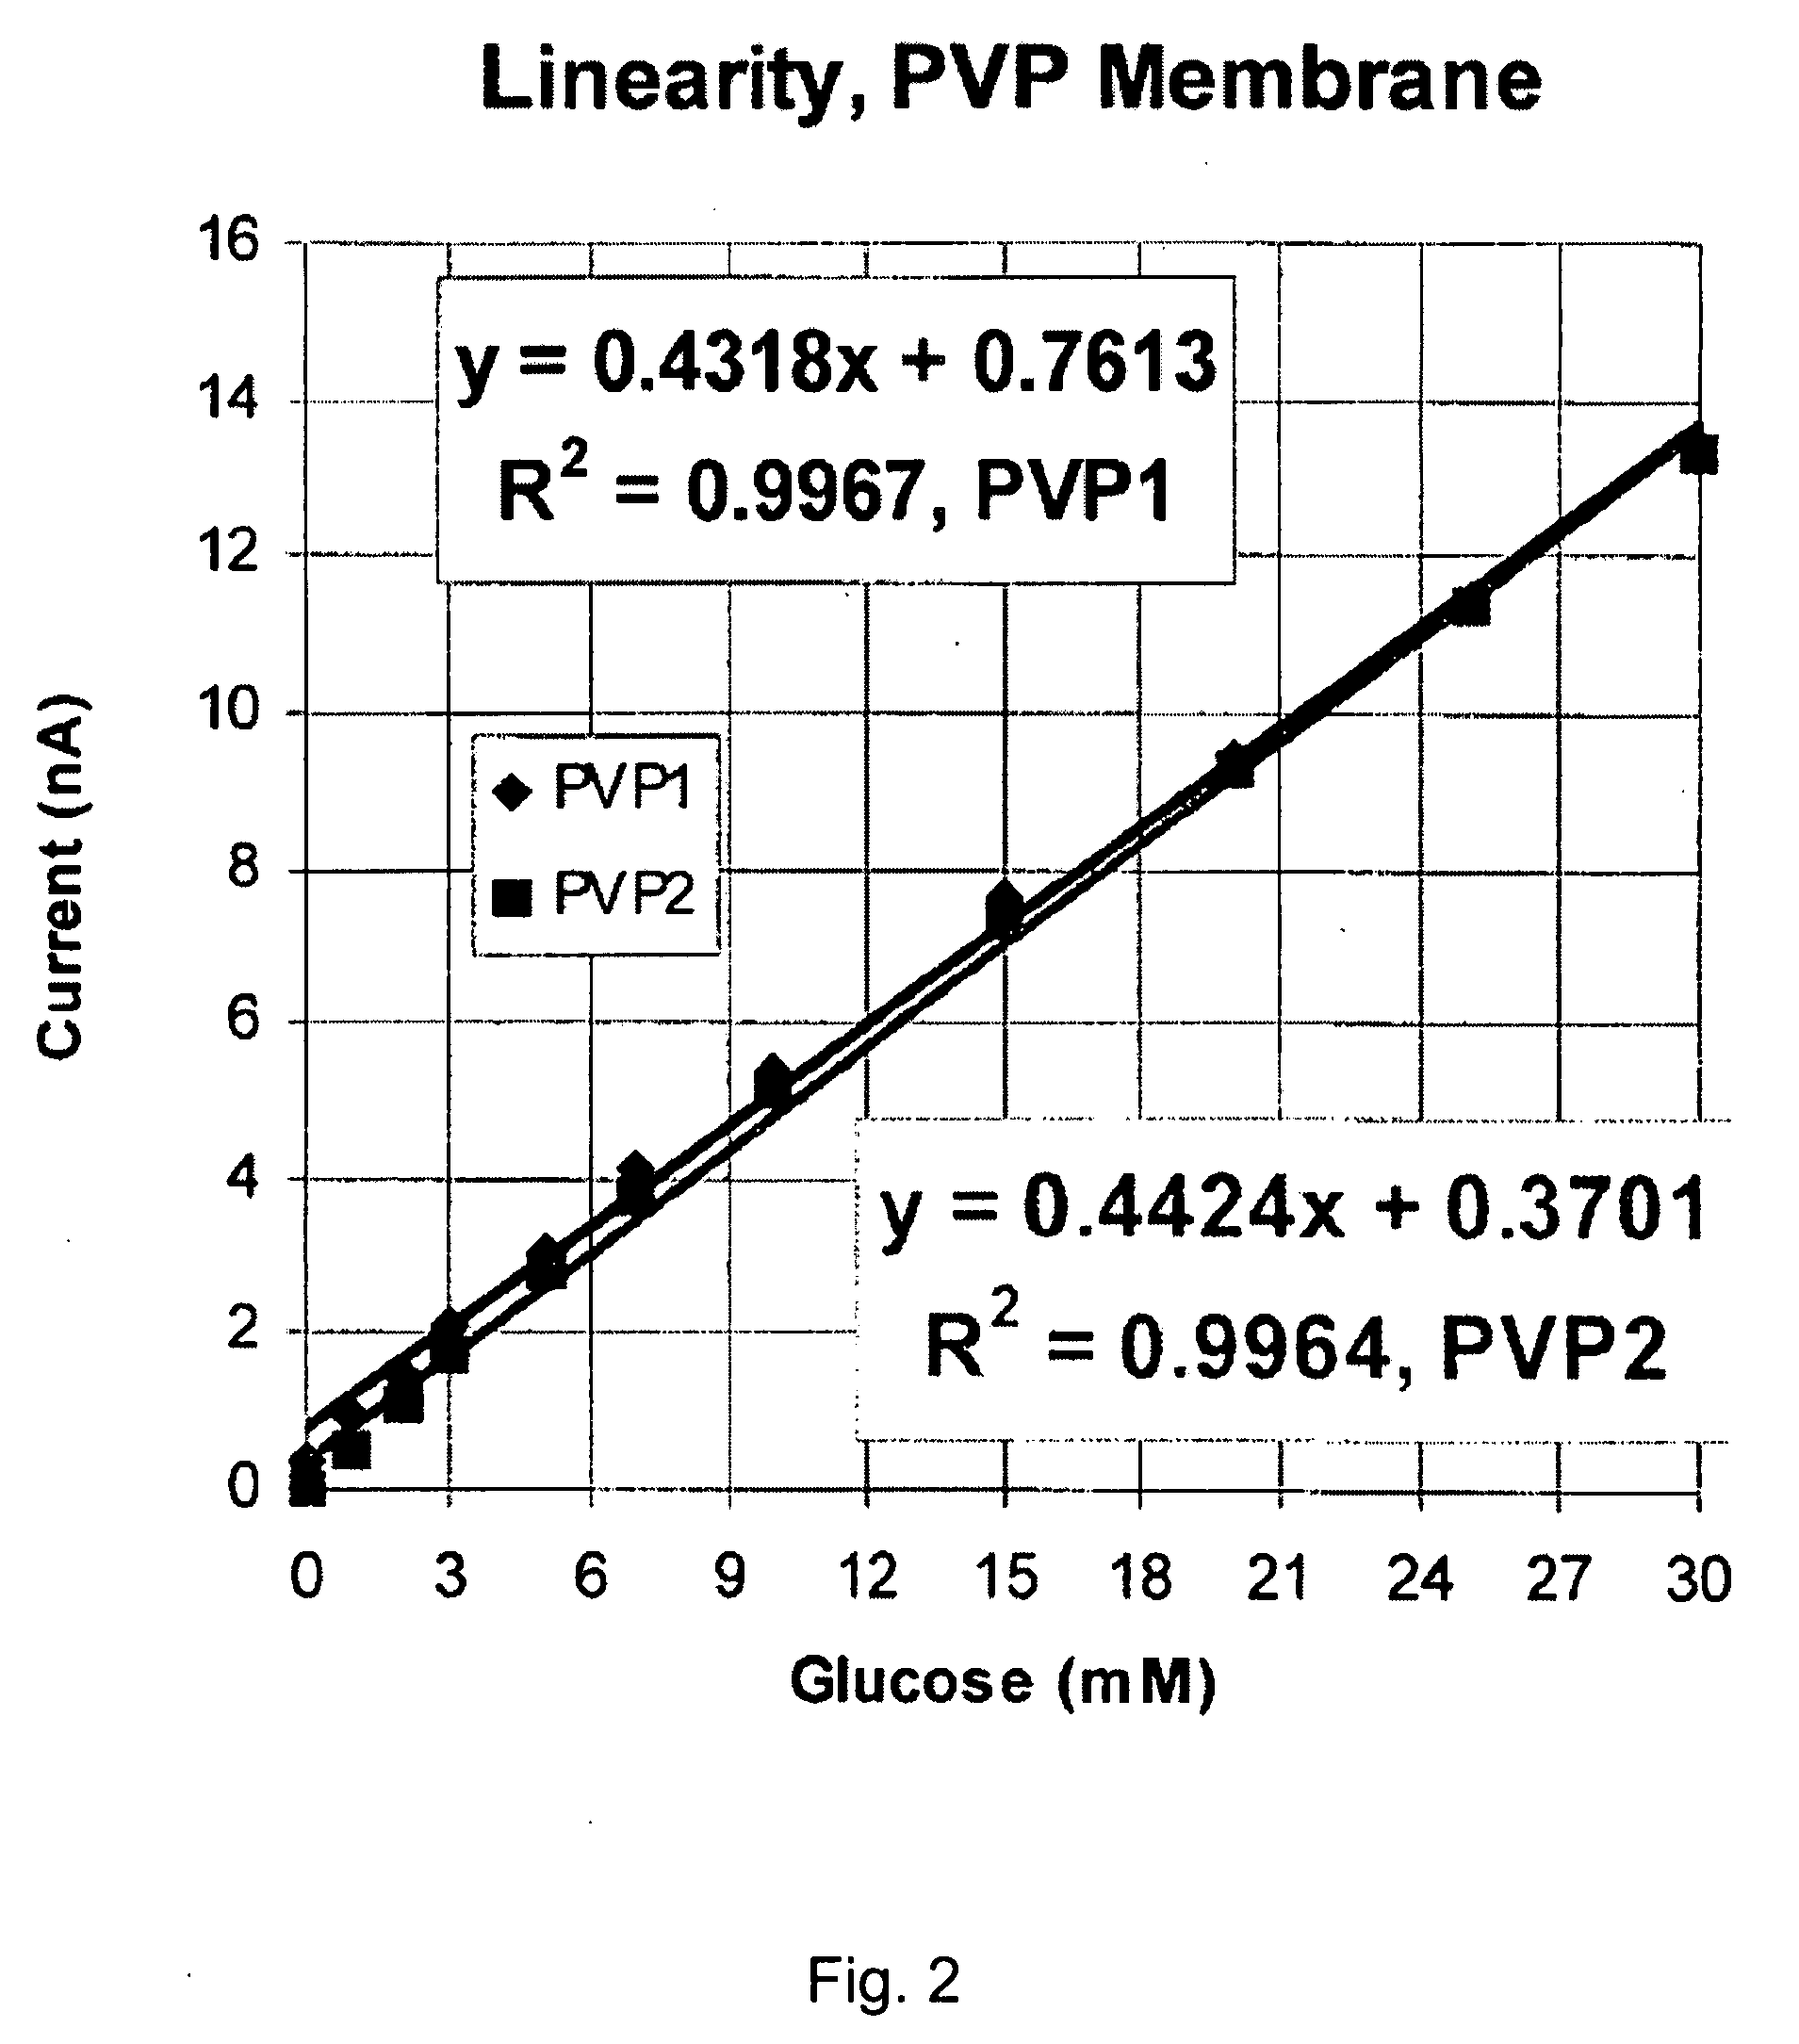
[0089]In a first example, a calibration experiment was conducted in which two sensors (PVP1 and PVP2) having diffusion-limiting membranes described herein were tested simultaneously, both at 37° C. The membranes were prepared from polymers of Formula III above and poly(ethylene glycol) diglycidyl ether (PEGDGE) crosslinkers, having a molecular weight of about 650. In the calibration experiment for each of PVP1 and PVP2, the sensors were placed in a PBS-buffered solution (pH 7) and the output current of each of the sensors was measured over time (FIG. 1) or as the glucose concentration was increased (FIG. 2). The measured output currents (nA) for each of PVP1 and PVP2 was determined and plotted against either time, as shown in the calibration graph of FIG. 1, or glucose concentration (mM), as shown in the calibration graph of FIG. 2.
[0090]As shown in FIG. 2, the calibration curve for the two sensors having diffusion-limiting membranes described herein are substa...
example 2
Stability Experiment
[0091]In a second example, a stability experiment was conducted in which two sensors having diffusion-limiting membranes were tested, simultaneously, at 37° C. The sensors had membranes prepared from the same polymer and the same crosslinker as those of the sensors described above in the calibration experiment. In this stability experiment, each of the sensors was placed in a PBS-buffered solution (pH 7) at various concentrations of glucose, and the output current of each of the sensors was measured at either room temperature (RT) or used after storage for 1 week at 56° C. (56 C / 1 wk). The measured output currents (nA) were plotted against concentrations of glucose (mM), as shown in the stability graph of FIG. 3.
[0092]As shown in FIG. 3, the stability curve for the two sensors having diffusion-limiting membranes is substantially linear over a relatively large range of glucose concentrations, for example, from zero to about 30 mM, as demonstrated by the best-fit l...
PUM
| Property | Measurement | Unit |
|---|---|---|
| Molecular weight | aaaaa | aaaaa |
| Electrical conductor | aaaaa | aaaaa |
| Responsivity | aaaaa | aaaaa |
Abstract
Description
Claims
Application Information
 - R&D
- Intellectual Property
- Life Sciences
- Materials
- Tech Scout
- Unparalleled Data Quality
- Higher Quality Content
- 60% Fewer Hallucinations
Browse by: Latest US Patents, China's latest patents, Technical Efficacy Thesaurus, Application Domain, Technology Topic, Popular Technical Reports.
© 2025 PatSnap. All rights reserved.Legal|Privacy policy|Modern Slavery Act Transparency Statement|Sitemap|About US| Contact US: help@patsnap.com


