
Genetic Markers Of True Low Birth Weight

Inactive Publication Date: 2009-04-02
THE TRUSTEES OF COLUMBIA UNIV IN THE CITY OF NEW YORK
View PDF9 Cites 4 Cited by
  • Summary
  • Abstract
  • Description
  • Claims
  • Application Information

AI Technical Summary

Benefits of technology

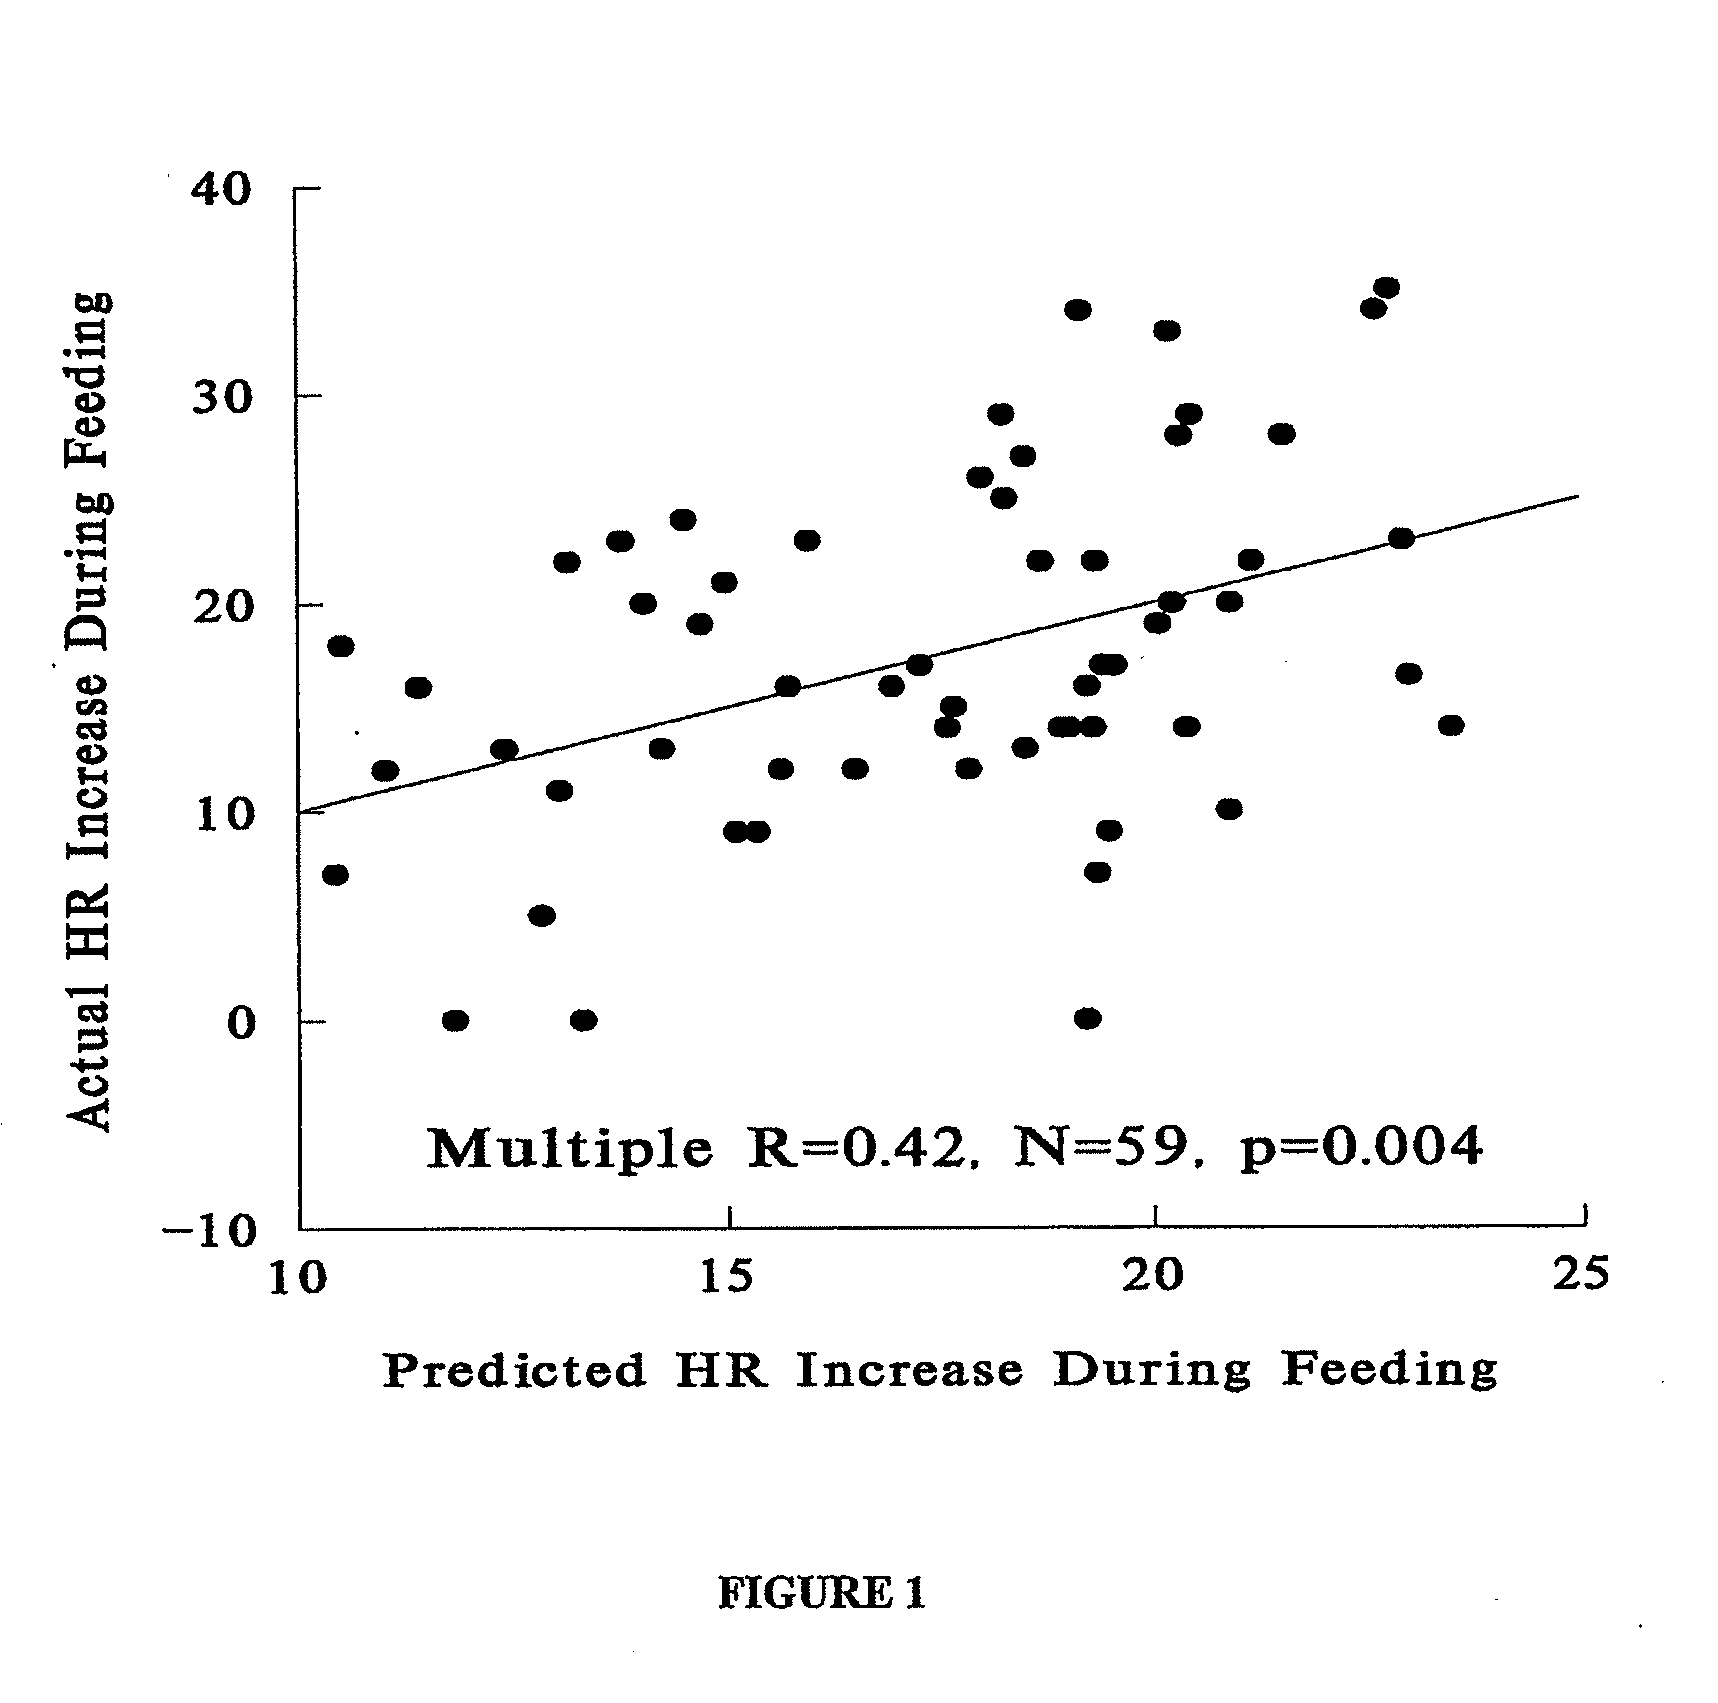
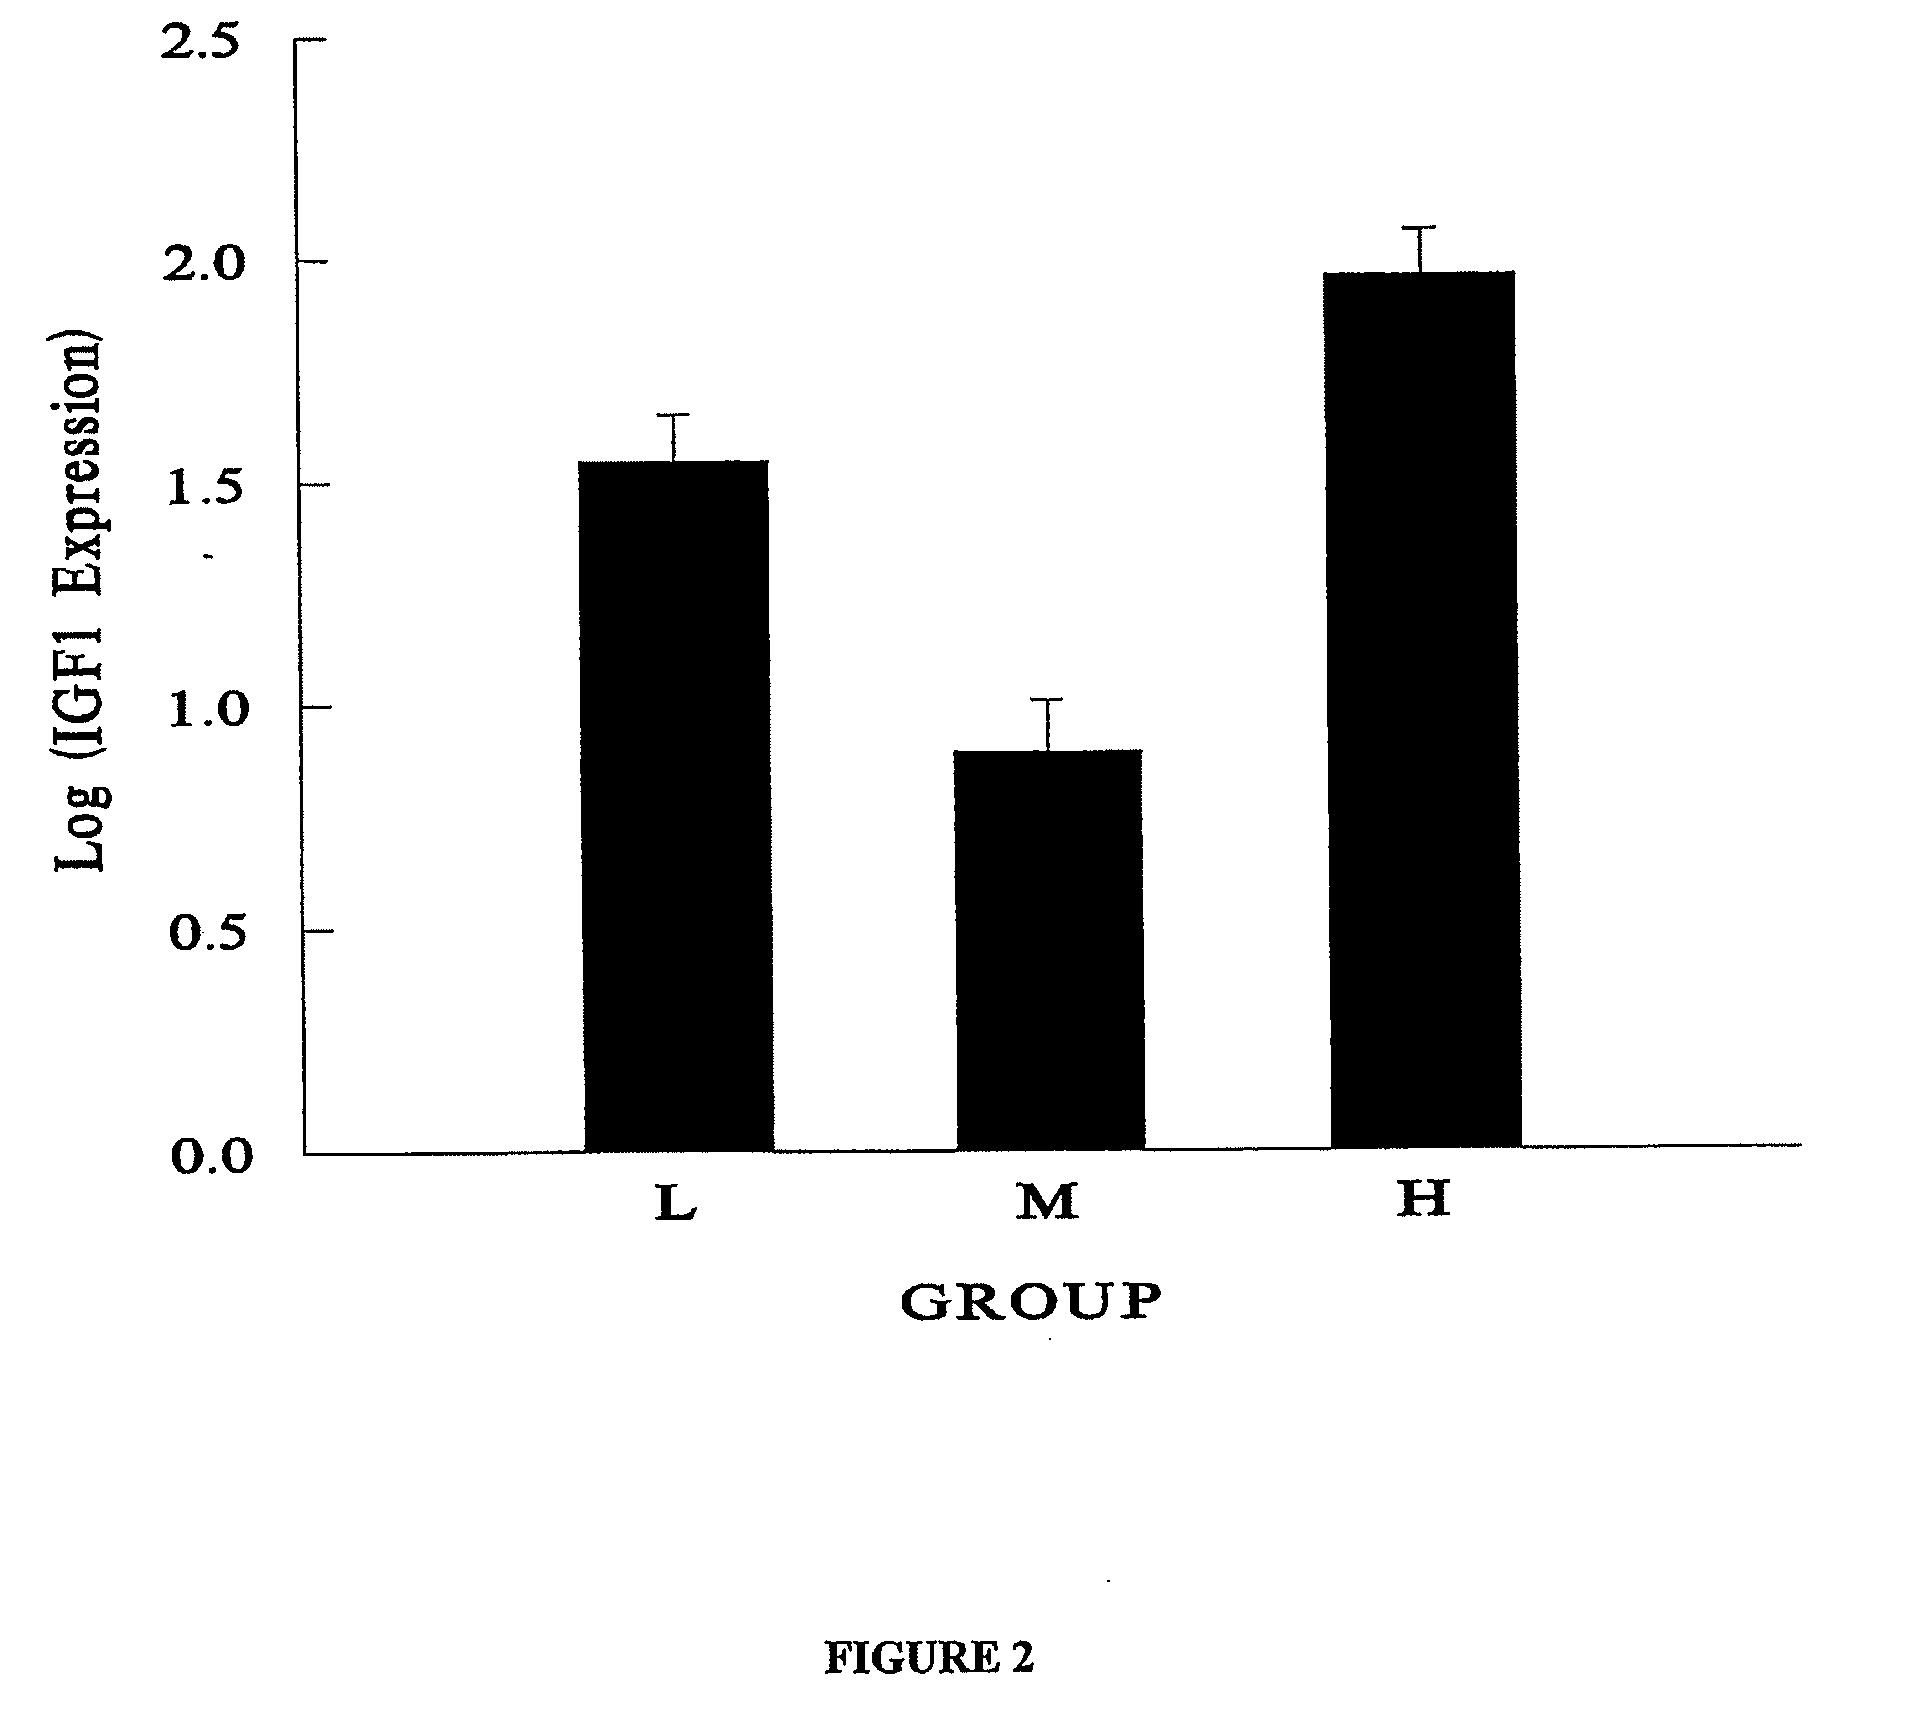
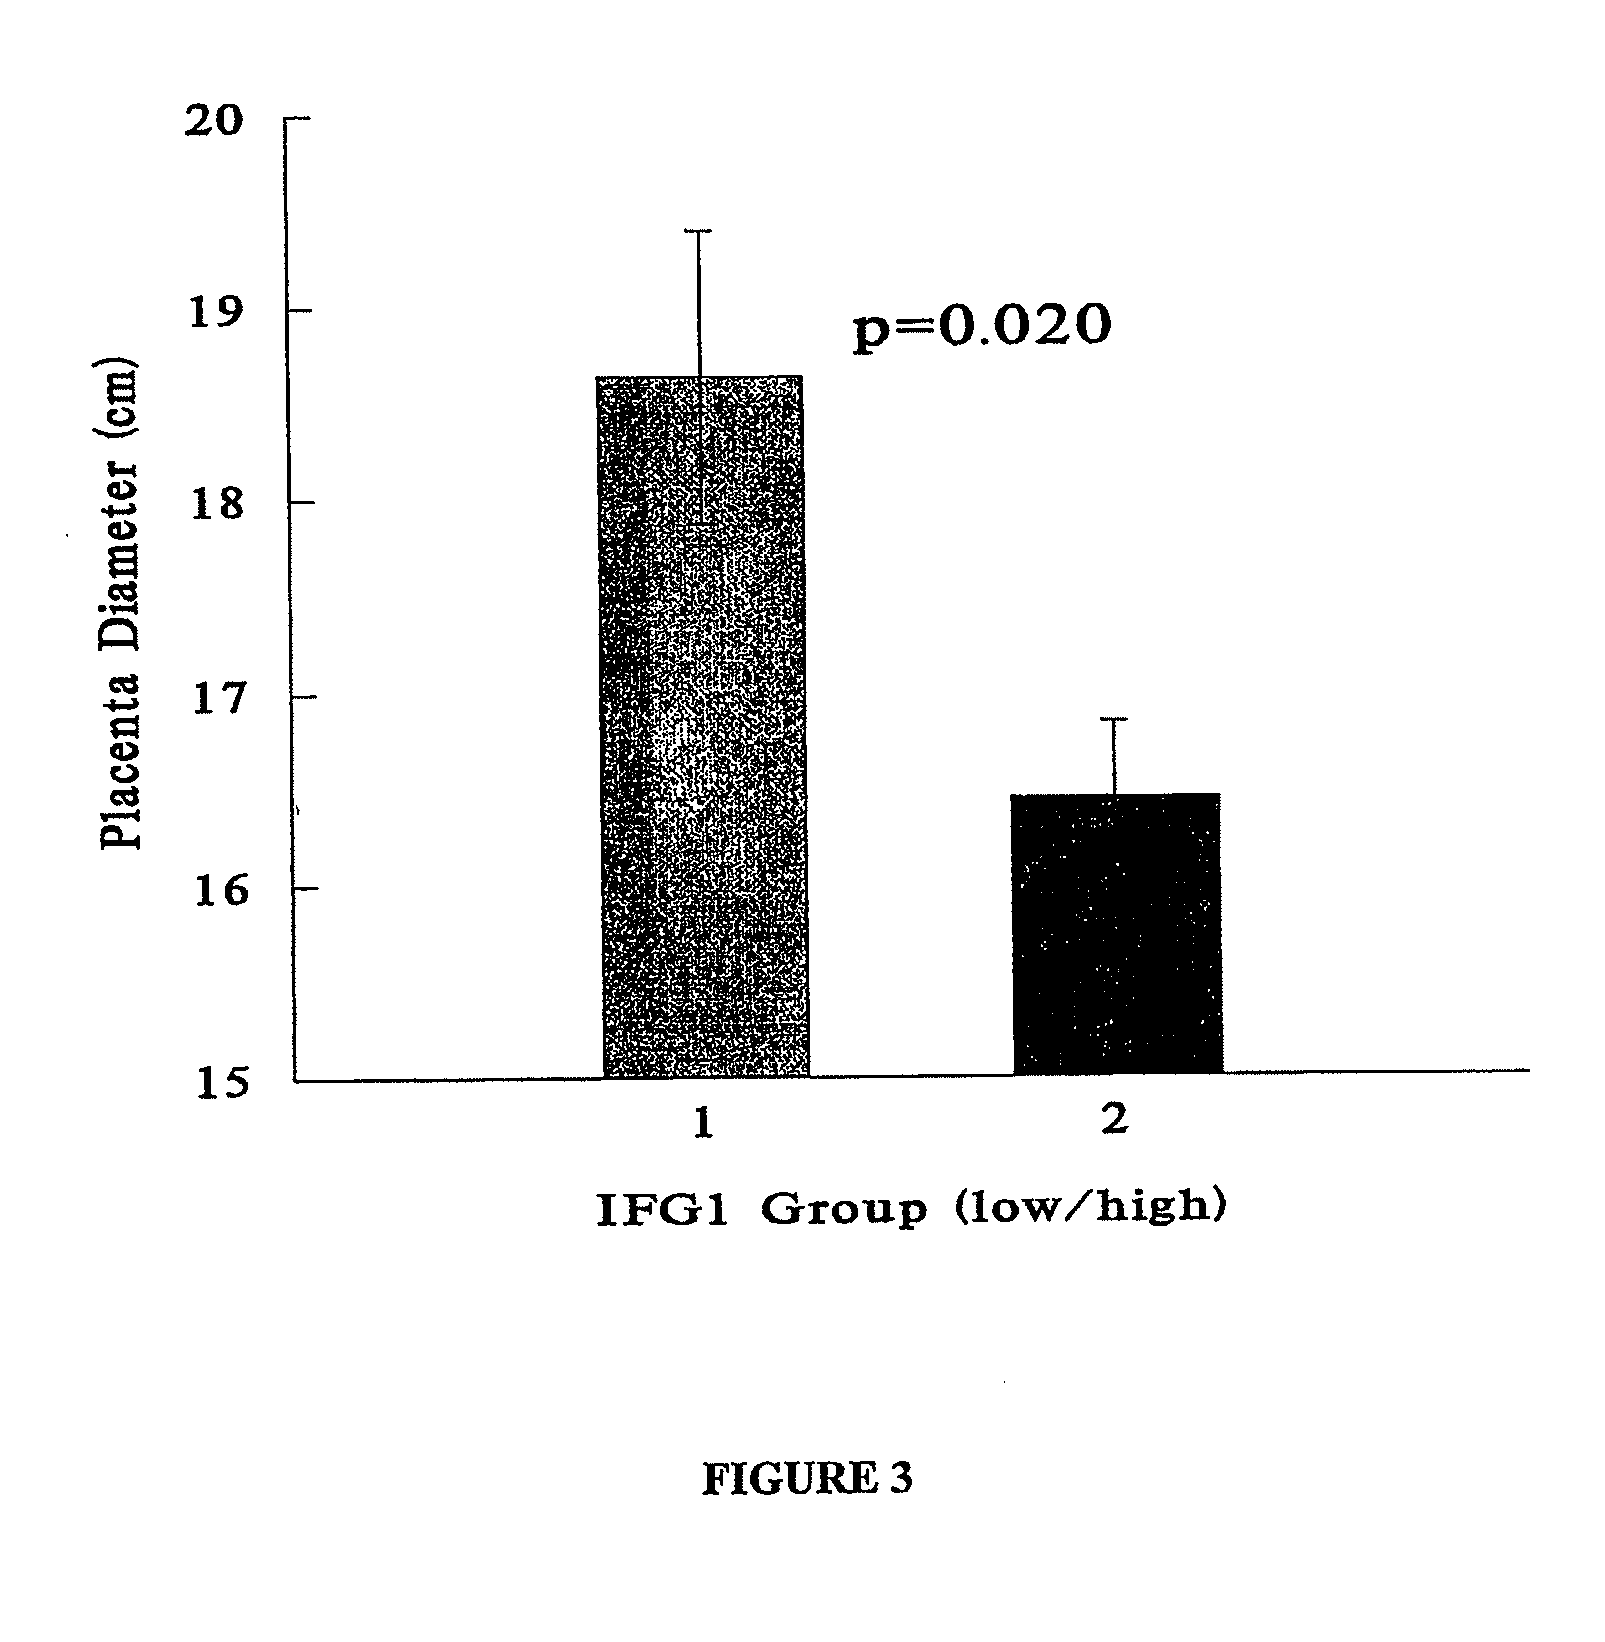
[0013]The present invention relates to a method of diagnosing true low birth weight (“TLBW”) in a subject, kits for the diagnosis of TLBW in a subject, and methods of determining the basis for treatment for a subject diagnosed with TLBW. It is based, at least in part, on the discovery that the level of insulin-like growth factor-1 (“IGF1”) expression (as measured in placental RNA) was decreased in TLBW infants, based on measurements of increased blood pressure and heart rate responses to feeding and head-up tilting; and, on the discovery that babies with bi

Problems solved by technology

It has also been found that compromised fetal growth leads to changes in autonomic nervous system development and that these effects can be seen soon after birth.
LBW is particularly prevalent in un-industrialized countries and impoverished areas, where the typical cause is malnourishment.
Thus, the WHO definition of LBW as less than 5.5 pounds may miscategorize infants, excluding heavier infants who are smaller than they should be, yet including healthy babies who weigh less than 5.5 pounds, for example, for genetic reasons.
However, regardless of the specific weight value utilized, an absolute cut-off weight fails to distinguish between infants who are pathologically low birth weight and normal, healthy infants which are simply small.
Similarly, it fails to identify infants which exceed 5.5 pounds but may still have reduced fetal growth and birth weight, and may be at risk for the associated health problems.
Currently, there are no specialized therapies and interventions for infants diagnosed with TLBW.
Current therapies thus do not account for the specific cause of the true low birth weight (e.g., insufficient calories, low protein), and do not necessarily correct the underlying defects which may contribute to future health risks.

Method used


Image

  • Genetic Markers Of True Low Birth Weight
  • Genetic Markers Of True Low Birth Weight
  • Genetic Markers Of True Low Birth Weight

Examples


example 1

[0111]Epidemiological studies indicate that babies born in the lower extreme of birth weight (BW) are at risk for physical and mental diseases in adulthood. Heart rate (HR) and blood pressure (BP) responses to feeding were measured within the first days of life in order to determine whether signs or markers of this increased vulnerability could be detected early in life. Preliminary studies indicate that term babies with low BWs had the greatest increases in HR during feeding. Placenta gene expression markers associated with fetal growth were examined to determine if they may be related to these physiological responses.

[0112]To briefly summarize, 33 term infants, enrolled to include a broad range of BWs, were bottle-fed a sweetened solution of 5% dextrose for 5 minutes. HR and BP changes were measured as values during feeding minus values during baseline just before feeding. Placenta samples were taken shortly after delivery and expression of Insulin-like Growth Factor I (IGF1) was ...

example 2

Test of Expression Profile Sensitivity and Specificity

Methods

[0122]Gene expression data from pregnant rats under different forms of dietary restriction was gathered. Five groups of rats were fed different diets or administered fluoxetine as follows:[0123]Group 1 (Controls): Rats with ad libitum food through out pregnancy. (N=8)[0124]Group 2 (CR50): Rats Given 50% of their Normal Daily Intake of Food. (N=5)[0125]Group 3 (CR70): Rats Given 70% of their Normal Daily Intake of Food. (N=5)[0126]Group 4 (HF): Rats Given a High Fat (45% Animal Fat) / High Energy (4.73 kcal / g) diet throughout gestation. (N=6)[0127]Group 5 (SSRI): Rats give Fluoxetine (˜10 mg / kg / day) throughout gestation. (N=6)

Placentas from the rats of each Group were harvested on Day 21 of gestation. RNA was extracted and gene expression was measured based on hybridization of RNA to Affymetrix Rat Genome Chips™ (230.2) (Affymetrix, Santa Clara, Calif.).

Results

Discrimination of High Fat Diet

[0128]Probe sets which showed a sig...

example 3

Effect of Caloric Restriction During Pregnancy on Placental Gene Expression in Rats

[0138]Gene expression from placentas of 6 control and 5 food restricted (70%) pregnancies were measured in rats. Placentas from 6 pups from each litter were pooled. RNA was extracted and over 30,000 genes and expressed sequences were analyzed using Affymetrix chips. Of that total, 6143 (˜20%) showed no overlap in expression between control and IUGR placentas. Of the 6143, 2819 (˜46%) were down-regulated, and 3324 (˜54%) were up-regulated.

[0139]Within the group of down-regulated genes there are five fibroblast growth factor genes and 16 solute carrier genes including the facilitated glucose transporter (Slc2a5) that are significantly altered the caloric restriction. In addition, several insulin-related genes were down regulated including, insulin itself (Ins 2), insulin degrading enzyme, insulin receptor-related receptor, insulin-like growth factor I, insulin-like growth factor binding protein 6, and i...


PUM

PropertyMeasurementUnit
Gene expression profileaaaaaaaaaa
Birth weightaaaaaaaaaa

Abstract

The present application provides for a method of diagnosing TLBW via measurement of expression of various TLBW-related genes. The present application also provides kits for the diagnosis of TLBW in a subject. The present application also provides a method for determining the basis for appropriate therapy for a subject suffering from TLBW.

Description

CROSS-REFERENCE TO RELATED APPLICATIONS[0001]This application claims the benefit of U.S. provisional application Ser. Nos. 60 / 735,087 filed Nov. 8, 2005, 60 / 814,672 filed Jun. 16, 2006, 60 / 834,285 filed Jul. 28, 2006 and Ser. No. ______ not yet assigned filed Oct. 25, 2006, each of which is incorporated by reference in its entirety herein.GRANT INFORMATION[0002]The subject matter of this application was developed at least in part under National Institutes of Health (NIEHS) Grant No. ES0110596, so that the United States government holds certain rights herein.FIELD OF THE INVENTION[0003]The present invention relates to a method of diagnosing true low birth weight (TLBW) in a subject, kits for the diagnosis of TLBW in a subject, and a method for determining the basis for appropriate therapy for a subject diagnosed with TLBW.BACKGROUND OF THE INVENTION[0004]Converging evidence demonstrates that the propensity to acquire certain adult diseases is influenced by factors that impinge upon t...

Claims


Application Information

Patent Timeline
IPC IPC(8): C12Q1/68
CPCC12Q2600/158C12Q1/6883
Inventor MYERS, MICHAEL MORGANCOHEN, MORRIS
Owner THE TRUSTEES OF COLUMBIA UNIV IN THE CITY OF NEW YORK
Learn More