Spatiotemporal and geometric optimization of sensor arrays for detecting analytes in fluids

a sensor array and geometries technology, applied in the field of fluid sensor and sensor system detection of analytes, can solve the problems of complicated electronics and the suffering of most chemical sensors, and achieve the effect of optimizing the transport of gaseous analytes and increasing the flux of analytes

Inactive Publication Date: 2009-08-27
CALIFORNIA INST OF TECH +2
View PDF82 Cites 15 Cited by
  • Summary
  • Abstract
  • Description
  • Claims
  • Application Information

AI Technical Summary

Benefits of technology

[0007]The invention provides apparatus, systems and methods for detecting the presence of analytes in fluids. Sensor arrays incorporate multiple sensors or detectors. To optimize transport of gaseous analytes to these sensors, sensor arrays can incorporate multiple holes, pores or channels, thus increasing analyte flux.
[0008]The geometry and spatiotemporal location of individual detectors can be optimized based on analyte characteristics, such as polymer / gas partition coefficients. For analytes with moderate polymer / gas partition coefficients, detector signal-to-noise can optimized for detectors of very large area. For analytes with high polymer / gas partition coefficients, detectors of small area will exhibit optimum vapor detection sensitivity. Manipulation of the geometric form factor of detectors can provide a convenient method for optimizing the S / N performance for a particular detector / analyte combination of interest. An array of nominally identical sorption detectors arranged linearly relative to the analyte flow path can produce different spatiotemporal response patterns for analytes having different polymer / gas partition coefficients. Analytes with moderate polymer / gas partition coefficients can produce the same signals on all detectors over a range of flow rates, whereas analytes with very large polymer / gas partition coefficients can produce signals that are highly dependent on the analyte flow rate and the spatial position of the detector in the array. Such a configuration can produce useful information on the composition of binary analyte mixtures and adds classification information to an array of compositionally different vapor detectors.
[0019]Particular implementations of the invention can include one or more of the following features. The sensor volume can be substantially optimized as a function of a sampling headspace volume νl and a partition coefficient K of at least one target analyte. The sensor volume νp can be substantially optimized based on the function νp=νl / K. The sensors can include two or more optimized sensors. Each of the optimized sensors can be substantially optimized to generate an optimized response upon exposure of the sensor array to a different target analyte. The optimized response can have a substantially maximized signal to noise ratio.

Problems solved by technology

Surface acoustic wave resonators are extremely sensitive to both mass and acoustic impedance changes of the coatings in array elements, but the signal transduction mechanism involves somewhat complicated electronics, requiring frequency measurement to 1 Hz while sustaining a 100 MHZ Rayleigh wave in the crystal.
In practice, most chemical sensors suffer from problems associated with mass transport of the analyte to be detected to the sensor regardless of the type of detector or sensor.

Method used


Image

  • Spatiotemporal and geometric optimization of sensor arrays for detecting analytes in fluids
  • Spatiotemporal and geometric optimization of sensor arrays for detecting analytes in fluids
  • Spatiotemporal and geometric optimization of sensor arrays for detecting analytes in fluids

Examples


example 1

Spectral Noise Measurements

[0141]For measurements of the noise properties of the detector films, glass microscope slides were coated with a 50 nm thick layer of Au on top of a 15-30 nm thick layer of Cr, in a pattern that produced rectangular gaps between two parallel metal contact regions. The ratio of the rectangular edge length to the gap length was 8:1, and this aspect ratio was held constant as the area of the gap was varied. After film deposition, this procedure resulted in detector films of similar resistance values that had systematically varying film volumes. Carbon black composite films containing either PEVA or PCL, and having areas of 0.080, 0.30, 1.2, 1.3, 5.0, 33.0, and 132 mm2, with resistance values ranging from 70 to 160 kΩ, were then deposited onto these substrates. The resulting detector film thicknesses, which were between 180 and 300 nm for the PEVA films and between 60 and 120 nm for the PCL films, were measured with a Sloan Dektak model 3030 profilometer.

[0142...

example 2

Determination of Polymer / Gas Partition Coefficients

[0148]Quartz crystal microbalance (QCM) measurements were performed on pure films of both PEVA and PCL at 294 K using 10 MHz resonant frequency quartz crystals and a measurement apparatus as described in Severin, et al., Anal. Chem. 2000, 72, 2008-2015. Twenty vapor presentations, each 120 s in duration and separated in time by 15 min, were performed at each of 4 concentrations (P / Po=0.010, 0.030, 0.050, 0.10) of n-hexane and of methanol. The order of vapor presentation was randomized with respect to analyte identity, analyte concentration, and repetition of conditions. The frequency shifts of the polymer-coated QCM crystals arising from deposition of the polymer film, Δfpolymer, were recorded as the difference in the resonant frequency of the crystal before and after deposition of the polymer film. The frequency change upon exposure toe analyte vapor, Δfanalyte, was calculated as the difference in the resonant frequency of the film...

example 3

Vapor Response of Linear Arrays of Chemically Equivalent, Spatially Nonequivalent Detectors

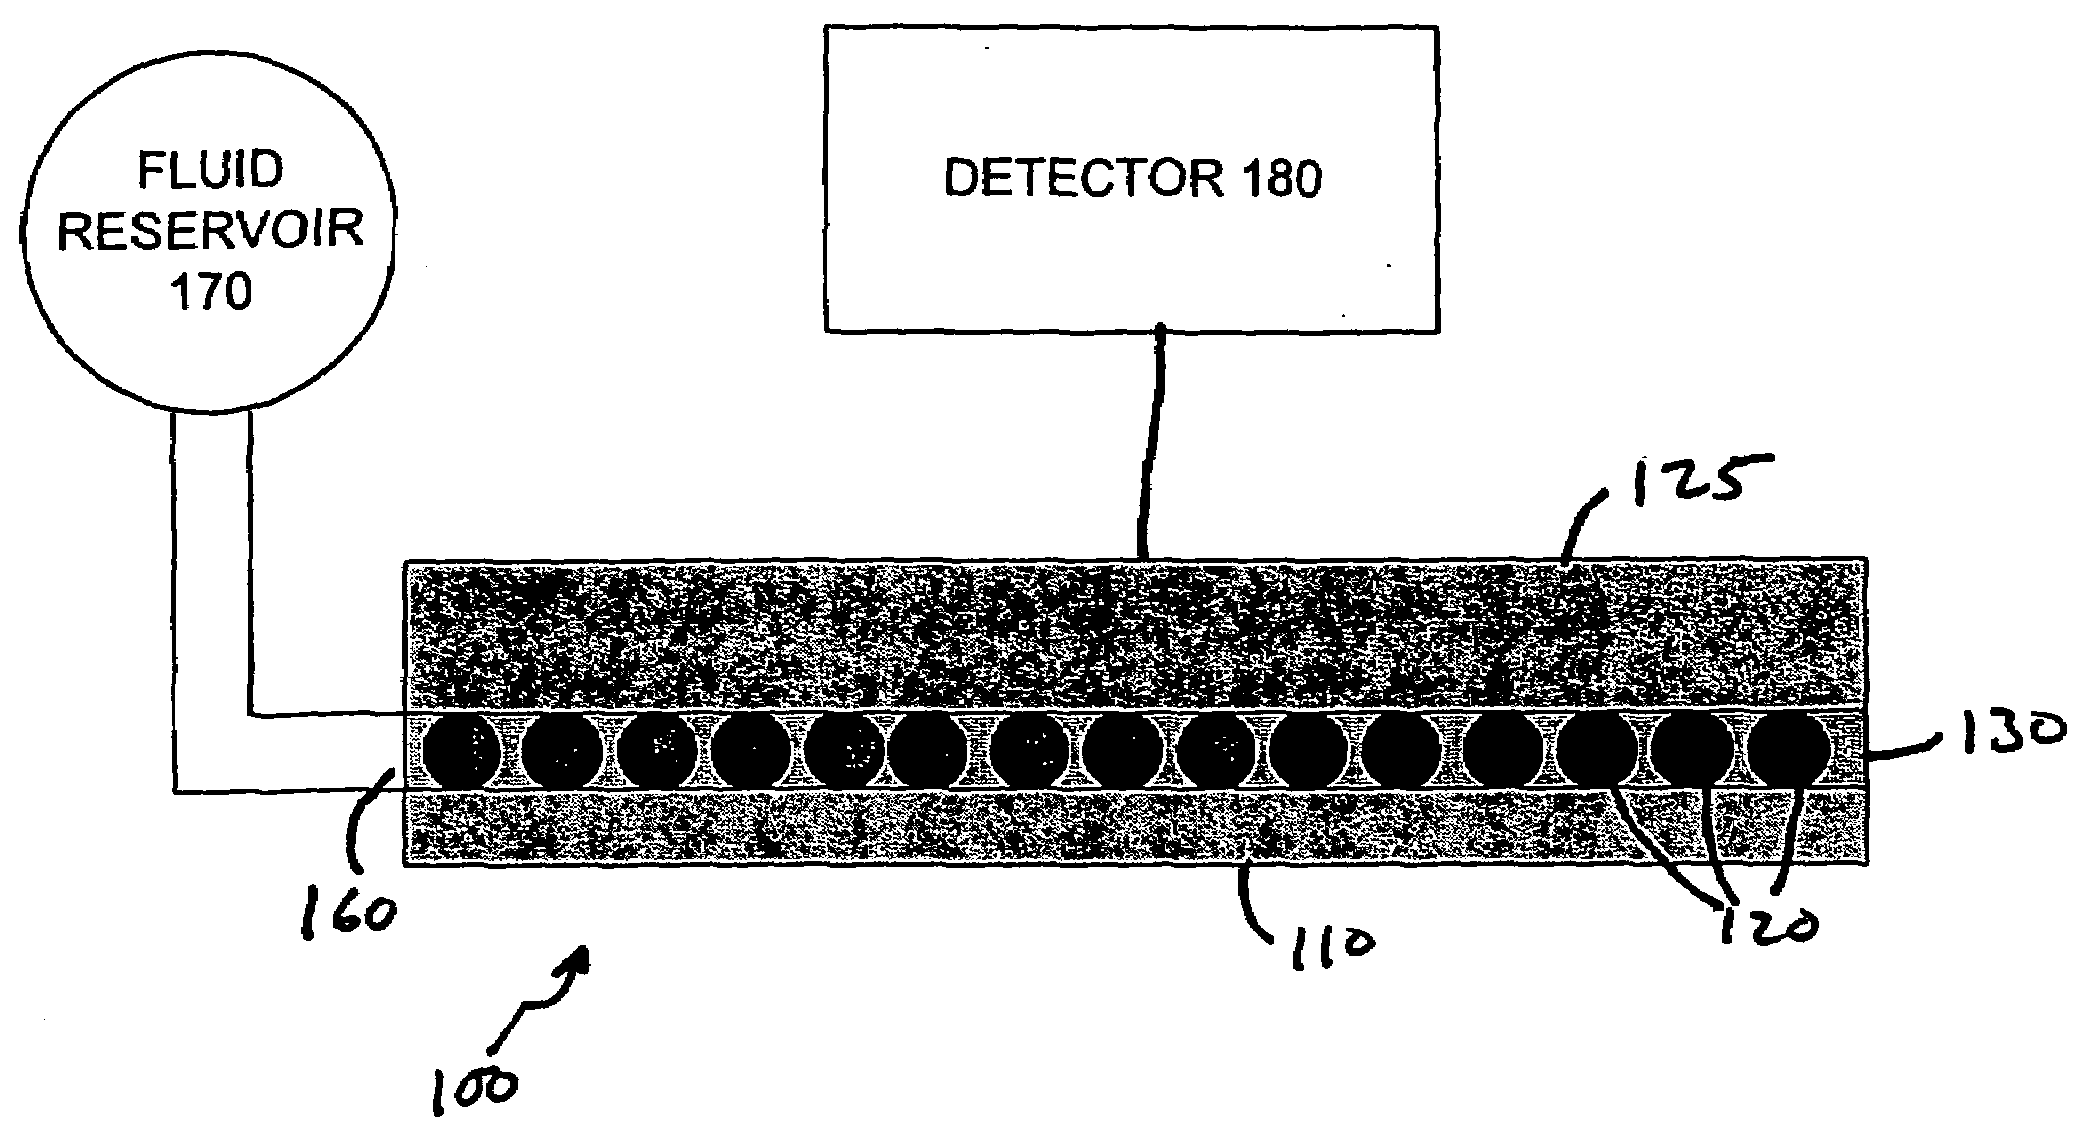
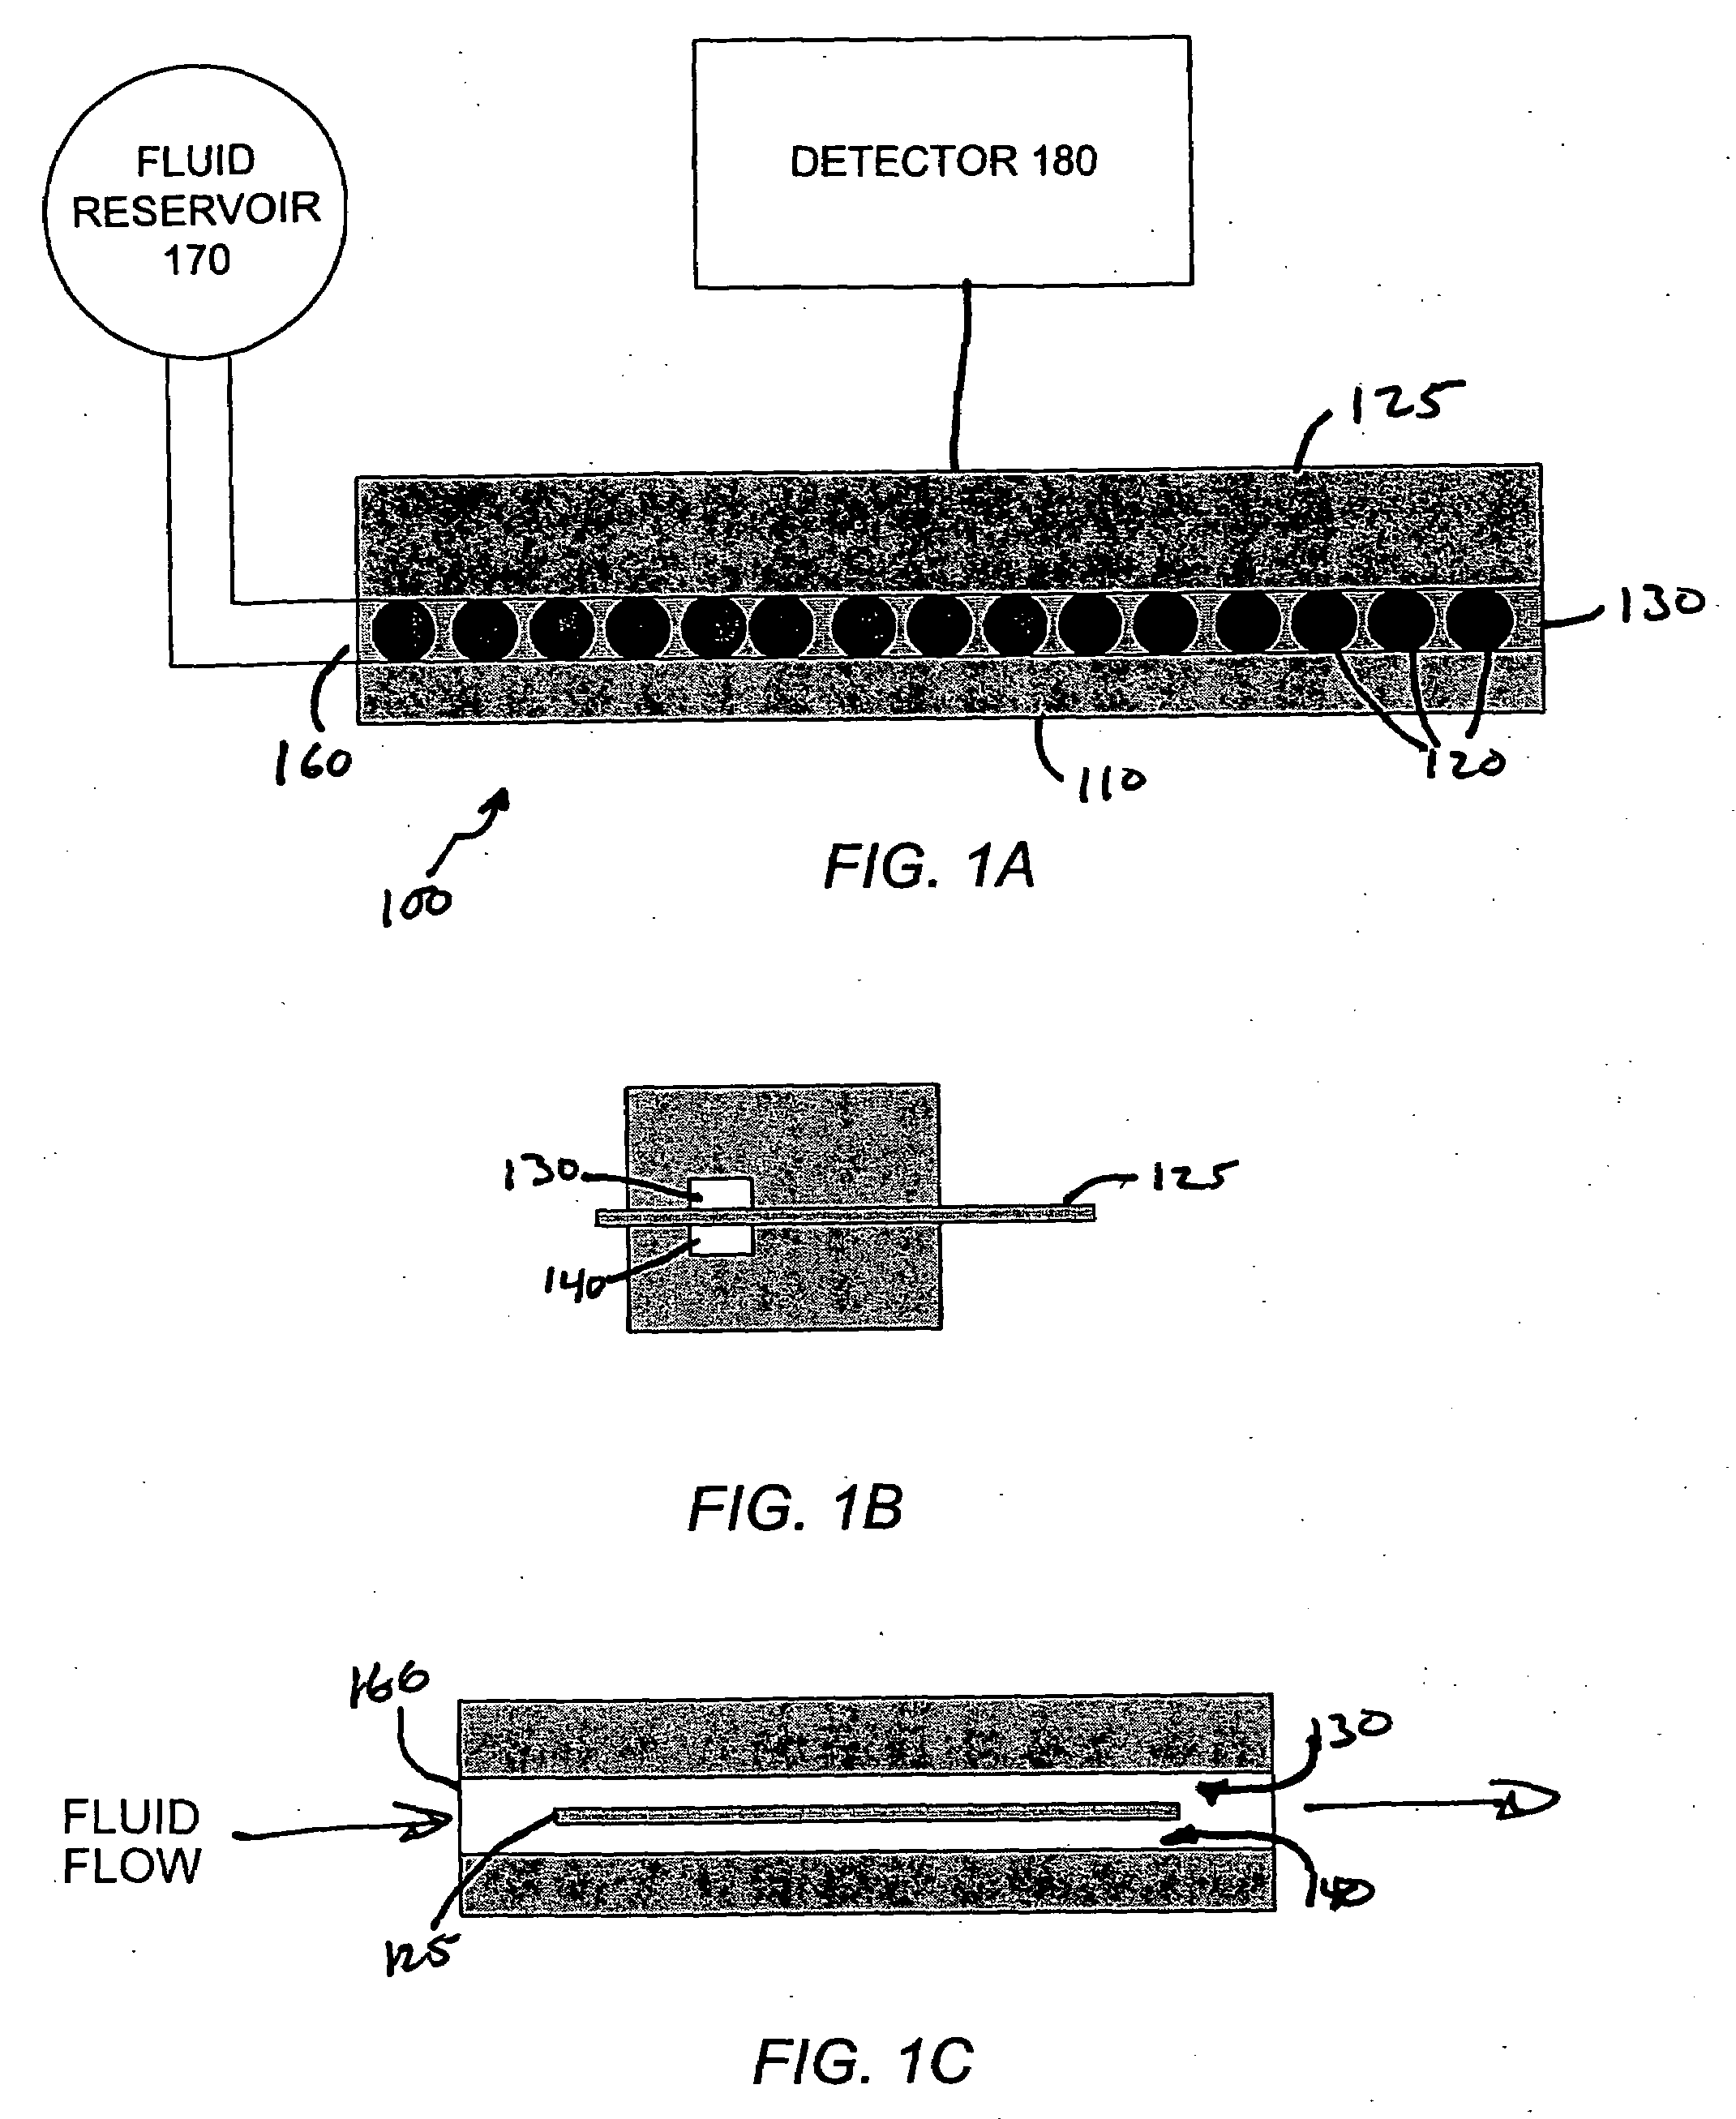
[0153]To investigate the spatiotemporal and geometric aspects of the chemiresistive vapor detectors, a linear array of detectors having a defined headspace and analyte flow configuration was constructed similar to the design illustrated in FIGS. 1A, 1B and 1C. A series of parallel Cr / Au contacts was formed on each side of 75 mm×25 mm glass slides. These contact electrodes were 1.8 mm long and were separated by a gap of 0.4 mm. Each pair of electrodes, which defined the contacts for an individual detector, was spaced 5 mm apart, permitting formation of 15 individual detectors on each side of the glass slide. The area surrounding the electrodes was coated with a thin layer of Teflon.

[0154]Both sides of the substrate were masked, with the exception of a 5 mm by 75 mm rectangular region on each side of the substrate that was centered on the row of electrical contacts used to form the detectors. Th...


PUM

PropertyMeasurementUnit
frequencyaaaaaaaaaa
Reynolds numbersaaaaaaaaaa
diameteraaaaaaaaaa

Abstract

Sensor arrays and sensor array systems for detecting analytes in fluids. Sensors configured to generate a response upon introduction of a fluid containing one or more analytes can be located on one or more surfaces relative to one or more fluid channels in an array. Fluid channels can take the form of pores or holes in a substrate material. Fluid channels can be formed between one or more substrate plates. Sensor can be fabricated with substantially optimized sensor volumes to generate a response having a substantially maximized signal to noise ratio upon introduction of a fluid containing one or more target analytes. Methods of fabricating and using such sensor arrays and systems are also disclosed.

Description

CROSS-REFERENCE TO RELATED APPLICATIONS[0001]This application is a continuation-in-part of U.S. application Ser. No. 09 / 568,784, filed on May 10, 2000, which claims the benefit of U.S. Provisional Application No. 60 / 133,318, filed on May 10, 1999, U.S. Provisional Application No. 60 / 140,027, filed on Jun. 16, 1999. This application also claims the benefit of U.S. Provisional Application No. 60 / 199,221, filed on Apr. 24, 2000, and U.S. Provisional Application No. 60 / 235,385, filed on Sep. 25, 2000. All of these prior applications and provisional applications are incorporated by reference herein.STATEMENT REGARDING FEDERALLY SPONSORED RESEARCH[0002]The U.S. Government has certain rights in this invention pursuant to Grant Nos. DAAK-60-97-K-9503 administered by the Defense Advanced Research Projects Agency, DAAG55-97-1-0187 and DAAG55-98-1-0266, both administered by the United States Army, DE-FG03-98NV13367 administered by the Department of Energy, and NAS-1407 administered by the Nati...

Claims


Application Information

Patent Timeline
Patent Type & Authority Applications(United States)
IPC IPC(8): B05D5/12B81B1/00G01N33/00
CPCG01N33/0031Y10T29/49Y10T29/49002Y10T436/12Y10T436/11
Inventor LEWIS, NATHAN S.FREUND, MICHAEL S.BRIGLIN, SHAWN M.TOKUMARU, PHILMARTIN, CHARLES R.MITCHELL, DAVID T.
Owner CALIFORNIA INST OF TECH
Why Eureka
Try Eureka