Volume Status Monitor: Peripheral Venous Pressure, Hypervolemia and Coherence Analysis

a volume status monitor and hypervolemia technology, applied in the field of flow waveform analysis, can solve the problems of poor correlation between hemodynamic and echocardiographic index of left ventricular performance, unacceptably frequent complications of invasive monitors of volume status, and unacceptable complications, and achieve the effect of reducing blood volum

Active Publication Date: 2010-07-29
SHELLEY KIRK H +2
View PDF20 Cites 47 Cited by
  • Summary
  • Abstract
  • Description
  • Claims
  • Application Information

AI Technical Summary

Benefits of technology

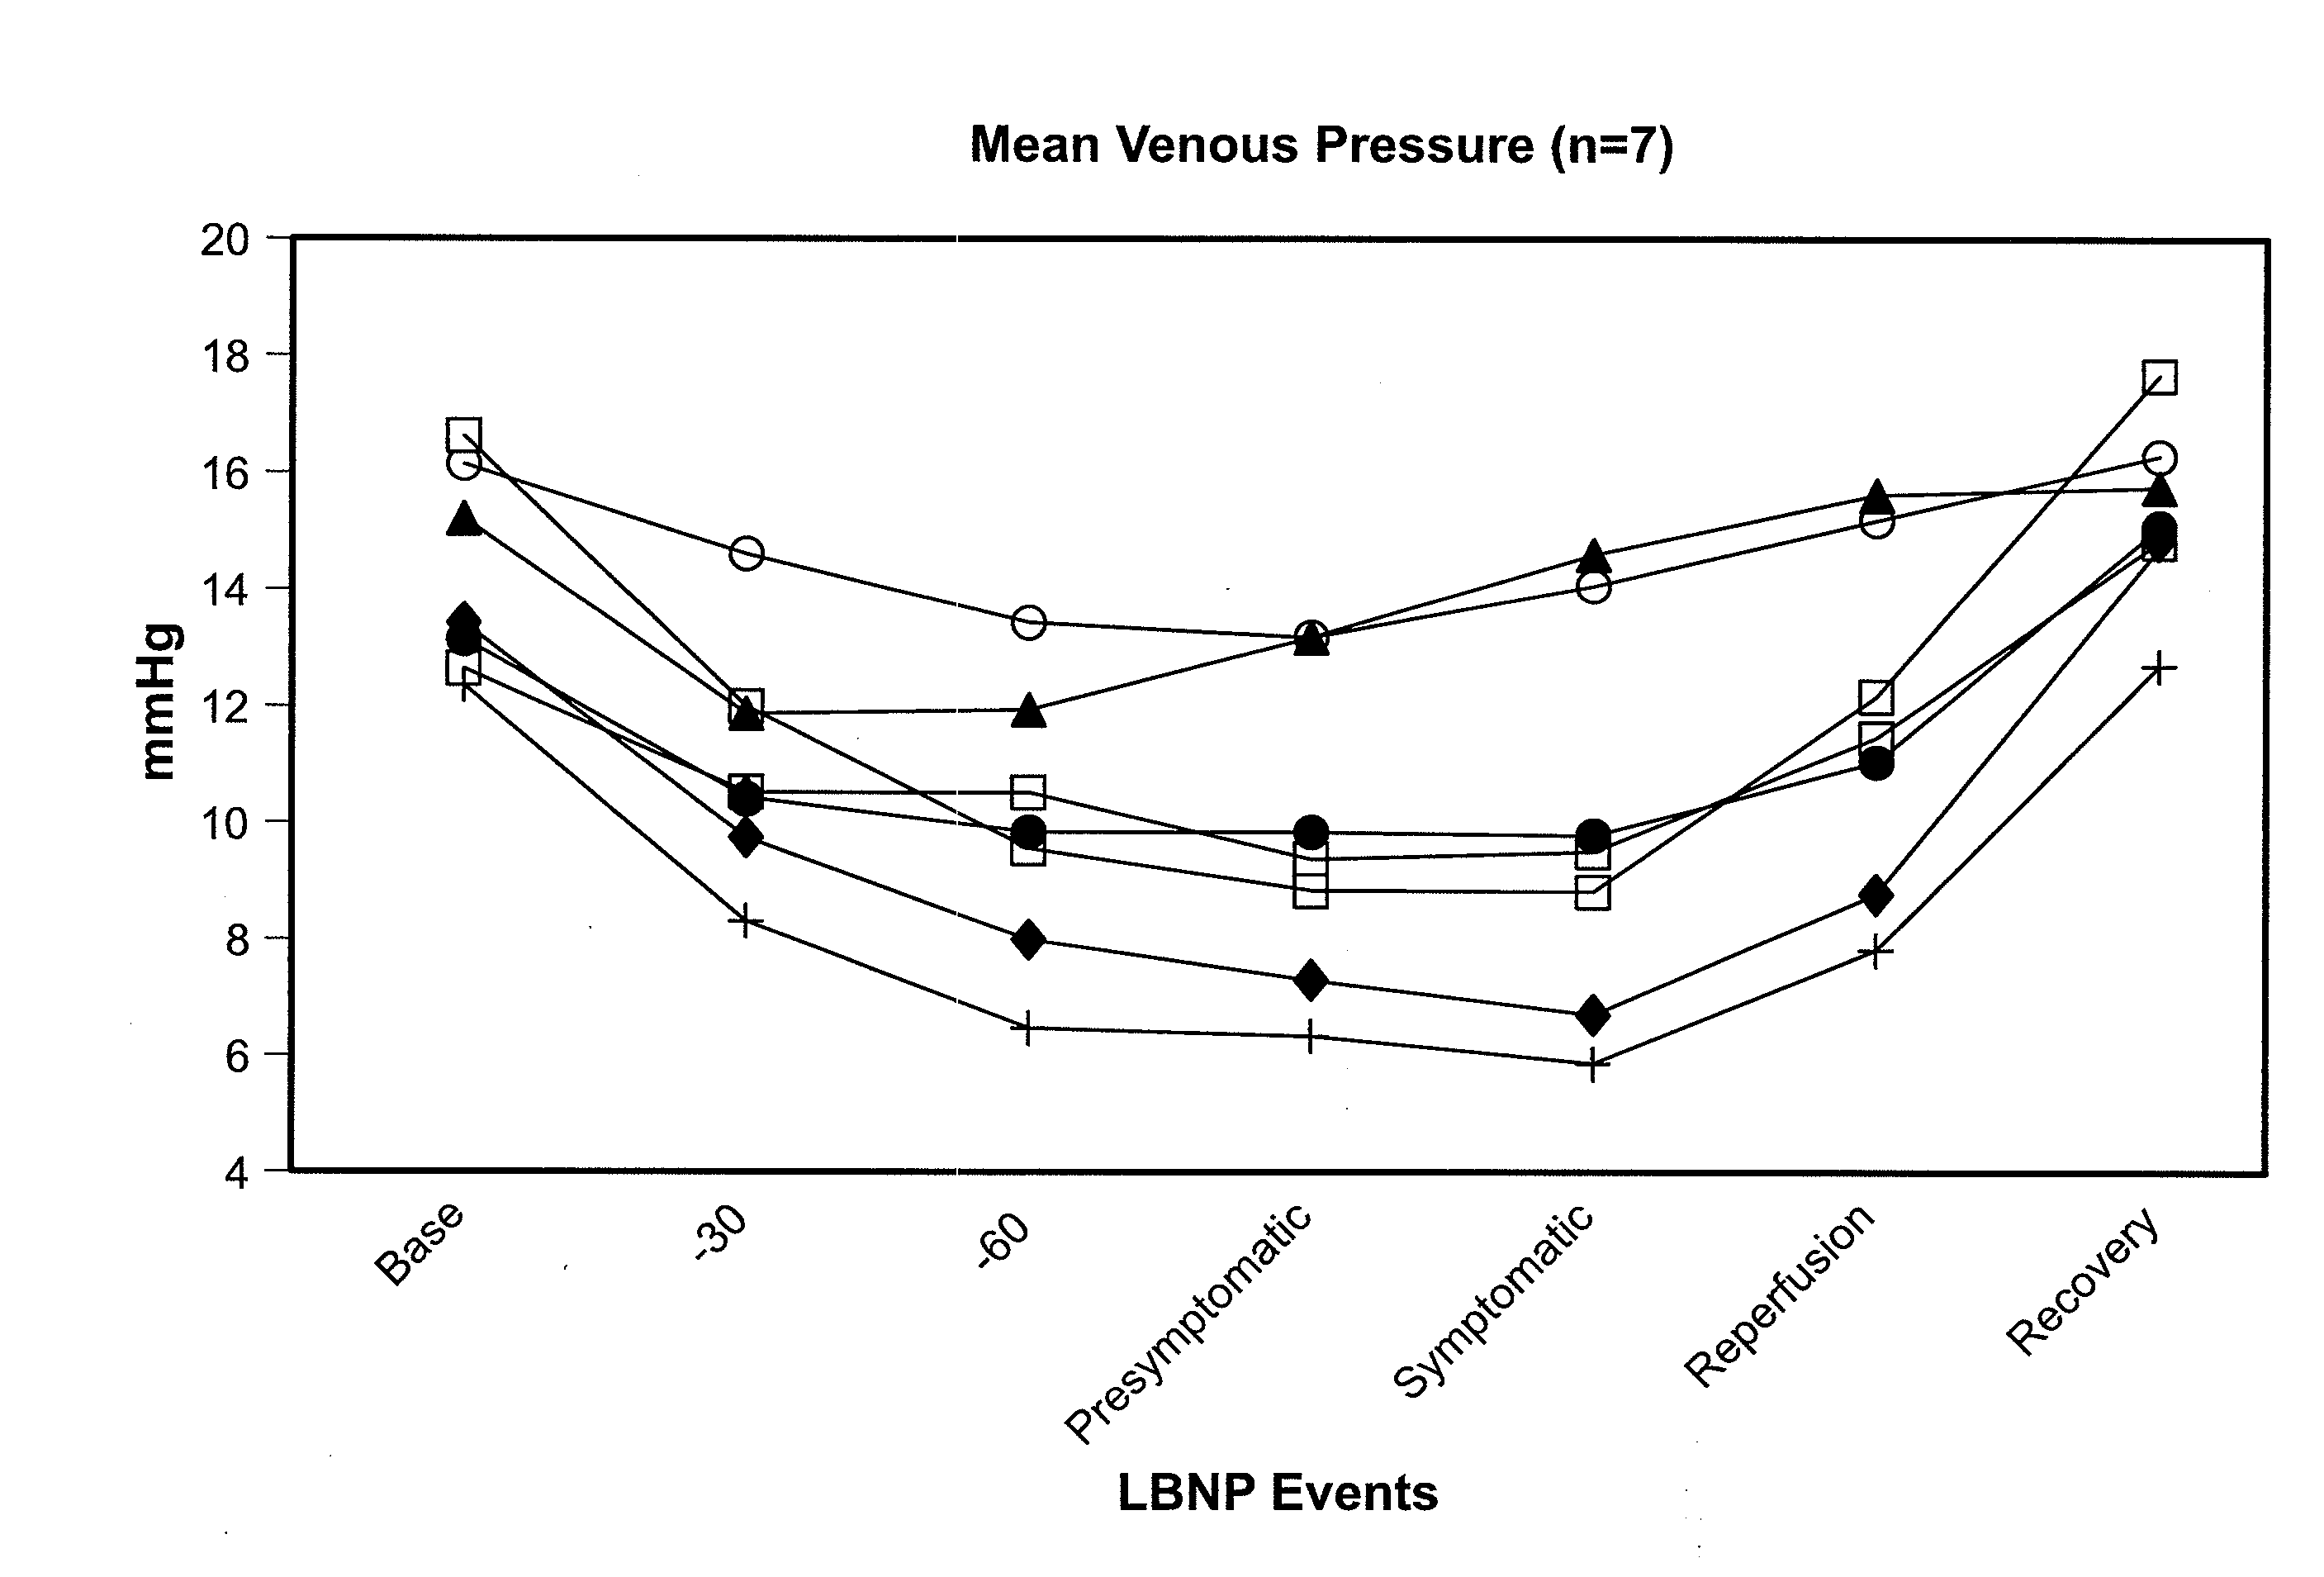
[0044]Advantageously, the disclosed systems and methods may relate to analyzing VIV in peripheral venous pressure (PVP), e.g., such as may be detected via pressure transduction in a standard intravenous line. Thus, the VIV of PVP may be measured according to the present disclosure, wherein decreased VIV is indicative of decreased blood volume. In exemplary embodiments, VIV of PVP is compared to VIV in peripheral arterial pressure (PAP), e.g., wherein an index is calculated relating the VIV of PVP and the VIV in PAP. In further exemplary embodiments, VIV of PVP is compared to VIV in

Problems solved by technology

This shift has been attributed to various considerations, including procedure time, cost, and known risks which for traditionally invasive techniques may include carotid artery puncture, arrhythmia, pneumothorax, and infection.
Indeed, there is growing evidence that invasive monitors of volume status, such as the pulmonary artery catheter (PAC), may be a source of unacceptably frequent complications.
In addition the accuracy and clinical usefulness of these monitors have been questioned.
See e.g., Bouchard, M. J., et al., Poor correlation between hemodynamic and echocardiographic indexes of left ventricular performance in the operating room and intensive care unit.
While such signal processing may be beneficial to the determination of oxygen saturation, it often comes at the expense of valuable physiological data.
Thus, due to a general lack of access to the raw PG waveform and the overriding clinical importance of monitoring oxygen saturation, various other potential uses for the PG waveform have been largely neglected.
While arterial waveforms have been studied extensively, focus on the peripheral venous component has been scarce.
Controversy still exists concernin

Method used


Image

  • Volume Status Monitor:  Peripheral Venous Pressure, Hypervolemia and Coherence Analysis
  • Volume Status Monitor:  Peripheral Venous Pressure, Hypervolemia and Coherence Analysis
  • Volume Status Monitor:  Peripheral Venous Pressure, Hypervolemia and Coherence Analysis

Examples


Embodiment Construction

)

[0063]According to the present disclosure, advantageous systems and methods are provided for analyzing waveforms of the peripheral vasculature, e.g., peripheral venous pressure (PVP) a plethysmographic (PG) signal, etc. Advantageously, such waveforms may be used to detect changes in blood volume (e.g., a PG signal may be used to detect and distinguish between hypovolemia and hypervolemia as later provided herein). In particular, the present systems and methods relate to analyzing ventilation-induced variation (VIV, also referred to as respiration-induced variation) of waveforms in the peripheral vasculature. Thus, in exemplary embodiments, such as involving spontaneous breathing, it may be necessary to account for changes in respiratory signal strength. Specifically, coherence between ventilation and VIV for a flow or pressure waveform may be determined using spectral-domain analysis as later described herein. Indeed, mediation of respiration-induced variations in the spectral-doma...


PUM


Abstract

Systems and methods are provided for monitoring changes in blood volume using waveforms in the peripheral vasculature. In particular, the systems and methods relate to detecting ventilation-induced variation (VIV) of waveforms in the peripheral vasculature. Advantageously, the systems and methods may relate to analyzing VIV in peripheral venous pressure (PVP). Thus, the VIV of PVP may be measured, wherein decreased VIV is indicative of decreased blood volume In exemplary embodiments, such as involving spontaneous breathing, it may be necessary to account for changes in respiratory signal strength. Thus systems and methods are also provided for assessing coherence between ventilation and VIV for a flow or pressure waveform. Specifically, coherence is evaluated by comparing the waveform to a detected respiratory signal. Finally, systems and method are provided for distinguishing the impact of respiration on the PG signal during hypervolemia as compared to hypovolemia. Such systems and methods may advantageously be utilized to monitor fluid status during fluid replacement.

Description

CROSS-REFERENCE TO RELATED APPLICATIONS[0001]The present application claims the benefit of two co-pending, provisional patent applications Ser. Nos. 61 / 106,257, filed Oct. 17, 2008 and entitled “Method of Assessing Blood Volume Using Ventilation-Induced Variation VIV in Peripheral Venous Pressure PVP Alone In Comparison to VIV in Arterial Pressure and Plethysmographic Volume Tracings,” and Ser. No. 61 / 159,621, filed Mar. 12, 2009 and entitled “Volume Status Monitor Hypervolemia and Coherence Analysis.” The entire content of the foregoing provisional patent applications are incorporated herein by reference.BACKGROUND[0002]1. Technical Field[0003]The present disclosure relates to systems and methods for analyzing flow waveforms in the peripheral vasculature, e.g., for assessing changes in blood volume.[0004]2. Background Art[0005]The present disclosure expands on and extends the teachings of U.S. Patent Publication No. 2007 / 0032732 to Shelley et al., entitled “Method of Assessing Bloo...

Claims


Application Information

Patent Timeline
IPC IPC(8): A61B5/0205A61B5/021
CPCA61B5/02152A61B5/0836A61B5/0295A61B5/029A61B5/02108
Inventor SHELLEY, KIRK H.SILVERMAN, DAVID G.SHELLEY, ADAM J.
Owner SHELLEY KIRK H
Why Eureka
Try Eureka