Mass Analysis Data Processing Method and Mass Analysis Data Processing Apparatus

Active Publication Date: 2011-09-22
SHIMADZU CORP
View PDF2 Cites 11 Cited by
  • Summary
  • Abstract
  • Description
  • Claims
  • Application Information

AI Technical Summary

Benefits of technology

[0023]With the mass analysis data processing method and the mass analysis data processing apparatus according to the present invention, it is possible to process an enormous amount of data collected by an imaging mass analysis to form information in which the spatial distribution of one or more substances contained in a sample can be easily and intuitively understood and present that information to the analysis operator. Particularly, the spatial distribution of a substance corresponding to the peak having the maximum intensity at each micro area is useful for deducing the tissue structure or other properties of the sample since such a substance is most likely to be the primary substance that is most abundantly contained in the micro area. The display of the maximum-intensity spectrum in

Problems solved by technology

Naturally, the amount of these data is enormous.
This method does not guarantee that the selected peak always corresponds to a substance that shows a spatially specific distribution.
Consequently, the operator generally has to repeat the operation of displaying images for many peaks on the integrated mass spectrum, which requires a large amount of labor and time.
In the case of PCA, a peak having a negative intensity may be included on a displayed mass spectrum of a main component and hence it is sometimes difficult to in

Method used


Image

  • Mass Analysis Data Processing Method and Mass Analysis Data Processing Apparatus
  • Mass Analysis Data Processing Method and Mass Analysis Data Processing Apparatus
  • Mass Analysis Data Processing Method and Mass Analysis Data Processing Apparatus

Examples


Embodiment Construction

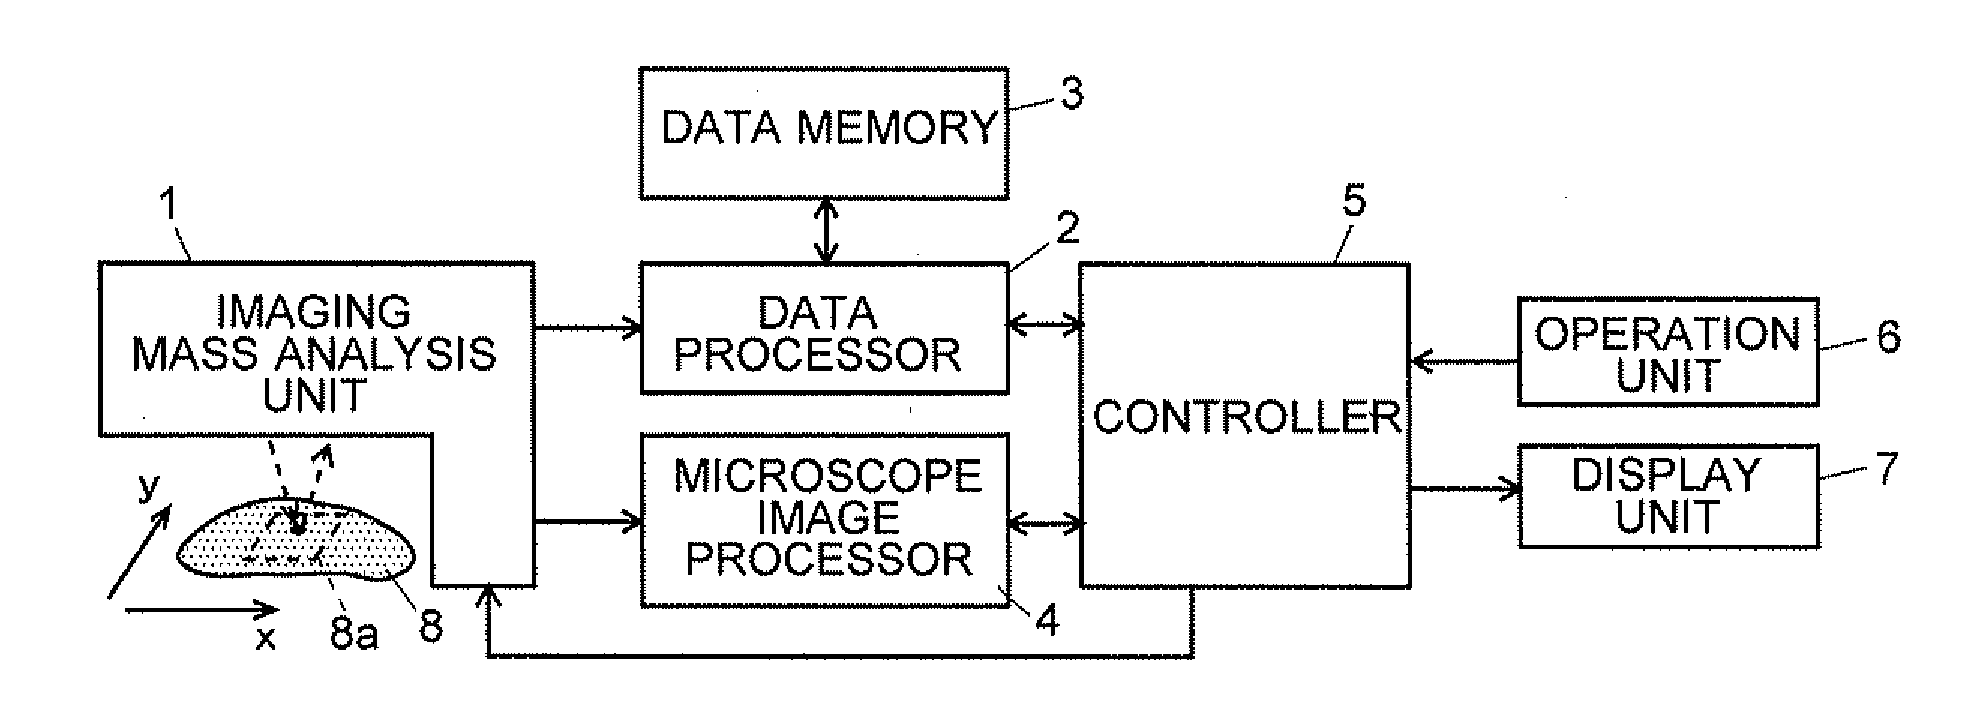
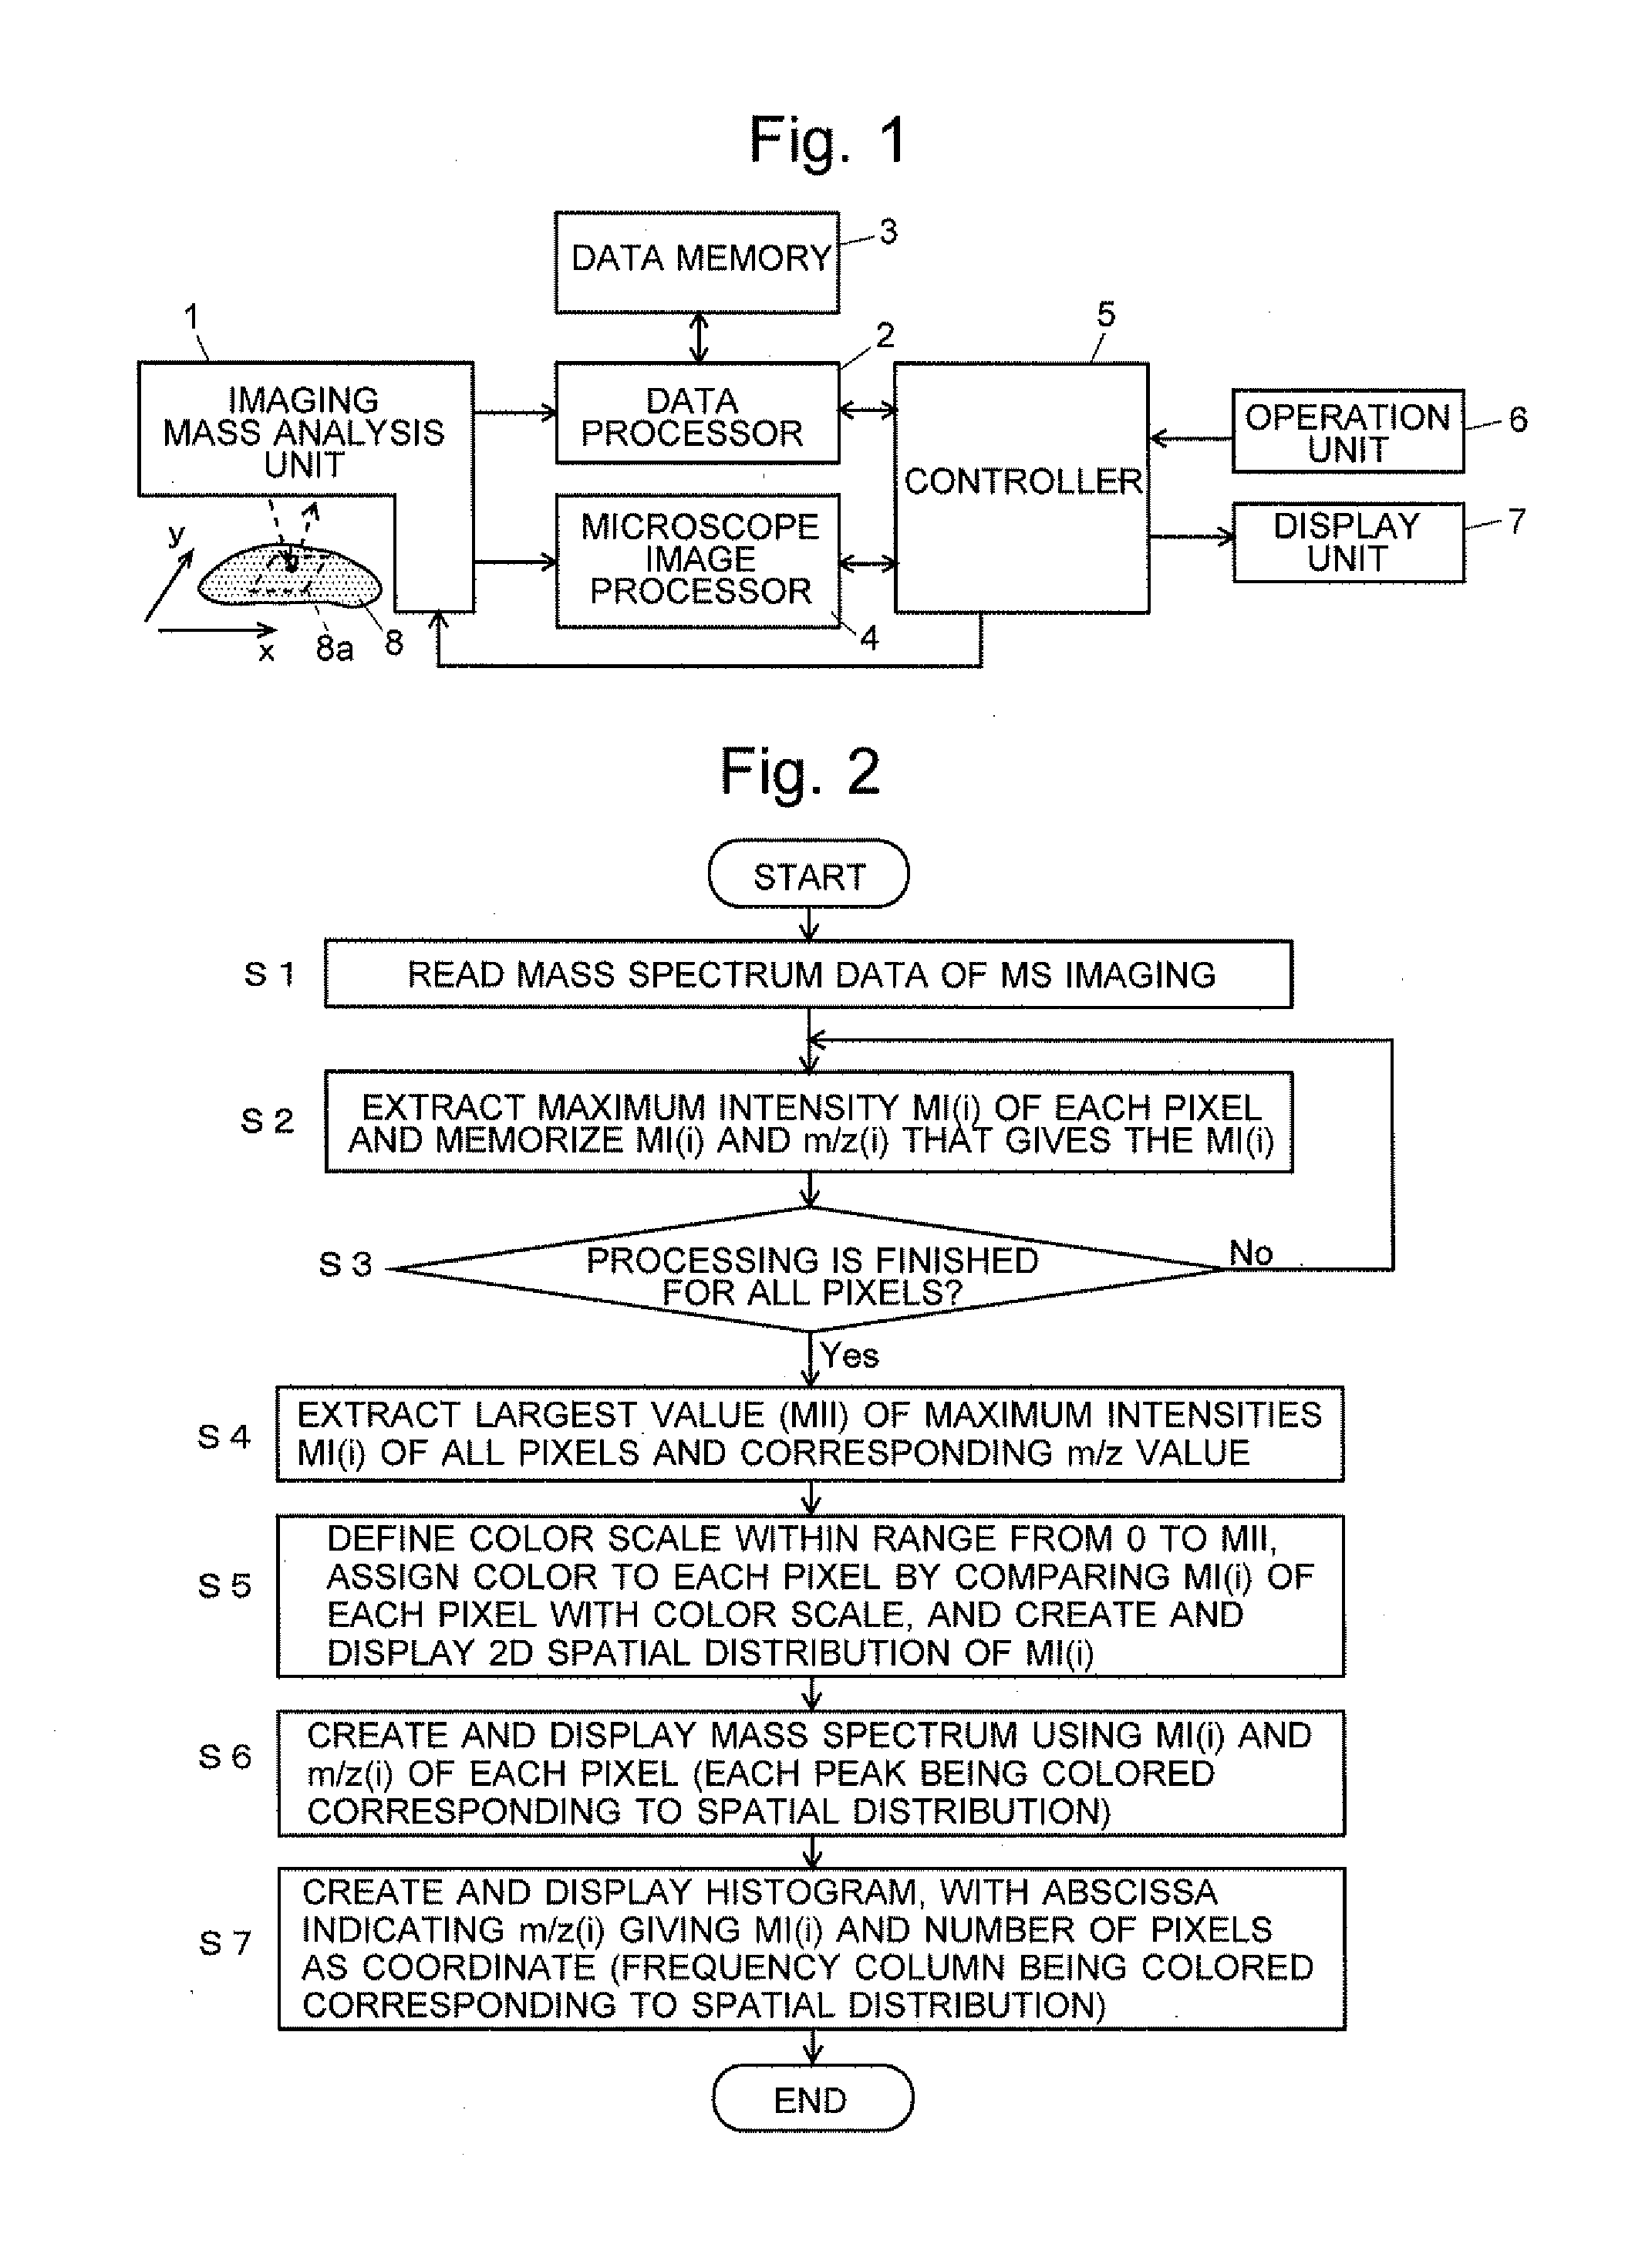
[0041]An embodiment of an imaging mass spectrometer which uses a mass analysis data processing apparatus according to the present invention will be described with reference to the attached figures. FIG. 1 is a schematic configuration diagram of the imaging mass spectrometer according to the present embodiment.

[0042]This imaging mass spectrometer includes: an imaging mass analysis unit 1 for performing a microscopic observation of a two-dimensional measurement area 8a on a sample 8 and for performing an imaging mass analysis within the area 8a; a data processor 2 for analyzing and processing the mass analysis spectrum data collected by the imaging mass analysis unit 1; a data memory 3 for memorizing the mass analysis data spectrum data; a microscope image processor 4 for processing the signal of an image photographed by the imaging mass analysis unit 1 and for forming a microscope image; a controller 5 for controlling the aforementioned units; and an operation unit 6 and a display un...


PUM


Abstract

The present invention provides a method and apparatus for efficiently handling a large amount of data collected by an imaging mass analysis to present significant information for the analysis of the tissue structure of a biological sample or other objects in an intuitively understandable form for analysis operators. For each pixel 8b on a sample 8, a mass-to-charge ratio m/z(i) corresponding to the maximum intensity MI(i) in a mass spectrum is listed, and the largest value MII of the maximum intensities of all the pixels are extracted. A color scale corresponding to the intensity values within a range of 0 to MII is defined. For each pixel, the maximum intensity MI is compared with the color scale to assign a color to that pixel. A mapping image with the pixels shown in the respective colors is created and displayed. Simultaneously, a spectrum showing the relationship between MI(i) and m/z(i) of all the pixels is created in such a manner that the peak colors correspond to the pixel colors on the mapping image. The mapping image shows the tissue structure of the sample. By comparing this image with the spectrum, the m/z of a noticeable substance in the sample can be identified.

Description

[0001]The present invention relates to a mass analysis data processing method and a mass analysis data processing apparatus for analyzing mass spectrometric imaging data which are collected by performing a mass analysis for a plurality of micro areas in a two-dimensional area of a sample.BACKGROUND OF THE INVENTION[0002]In order to observe the morphology of a sample such as a biological tissue and simultaneously measure the distribution of the molecules existing in a specified area on the sample, apparatuses called a mass microscope or an imaging mass spectrometer have been developed (refer to: JP-A 2007-66533; JP-A 2007-157353; JP-A 2007-257851; Kiyoshi Ogawa et al., “Kenbi Shitsuryo Bunseki Sochi no Kaihatsu,” (“Research and Development of Mass Microscope”) Shimadzu Review, Shimadzu Corporation, Mar. 31, 2006, vol. 62, nos. 3-4, pp. 125-135; Takahiro Harada et al., “Kenbi Shitsuryo Bunseki Sochi ni yoru Seitai Soshiki Bunseki,” (“Biological Tissue Analysis using Mass Microscope”) ...

Claims


Application Information

Patent Timeline
IPC IPC(8): G06K9/00
CPCH01J49/0036H01J49/0004
Inventor KAJIHARA, SHIGEKIIKEGAMI, MASAHIROMORINAGA, HIROKO
Owner SHIMADZU CORP
Why Eureka
Try Eureka