Data analysis and predictive systems and related methodologies

a predictive system and data analysis technology, applied in the field of data analysis and predictive systems, can solve the problems of insufficient data analysis methods and systems which can produce high, methods that do not select specific subsets of features and precise neighbourhood of samples for a specific individual, and a relatively large number of patients who will not benefit at all from drug treatmen

Active Publication Date: 2011-12-15
KASABOV NIKOLA KIRILOV
View PDF3 Cites 41 Cited by
  • Summary
  • Abstract
  • Description
  • Claims
  • Application Information

AI Technical Summary

Benefits of technology

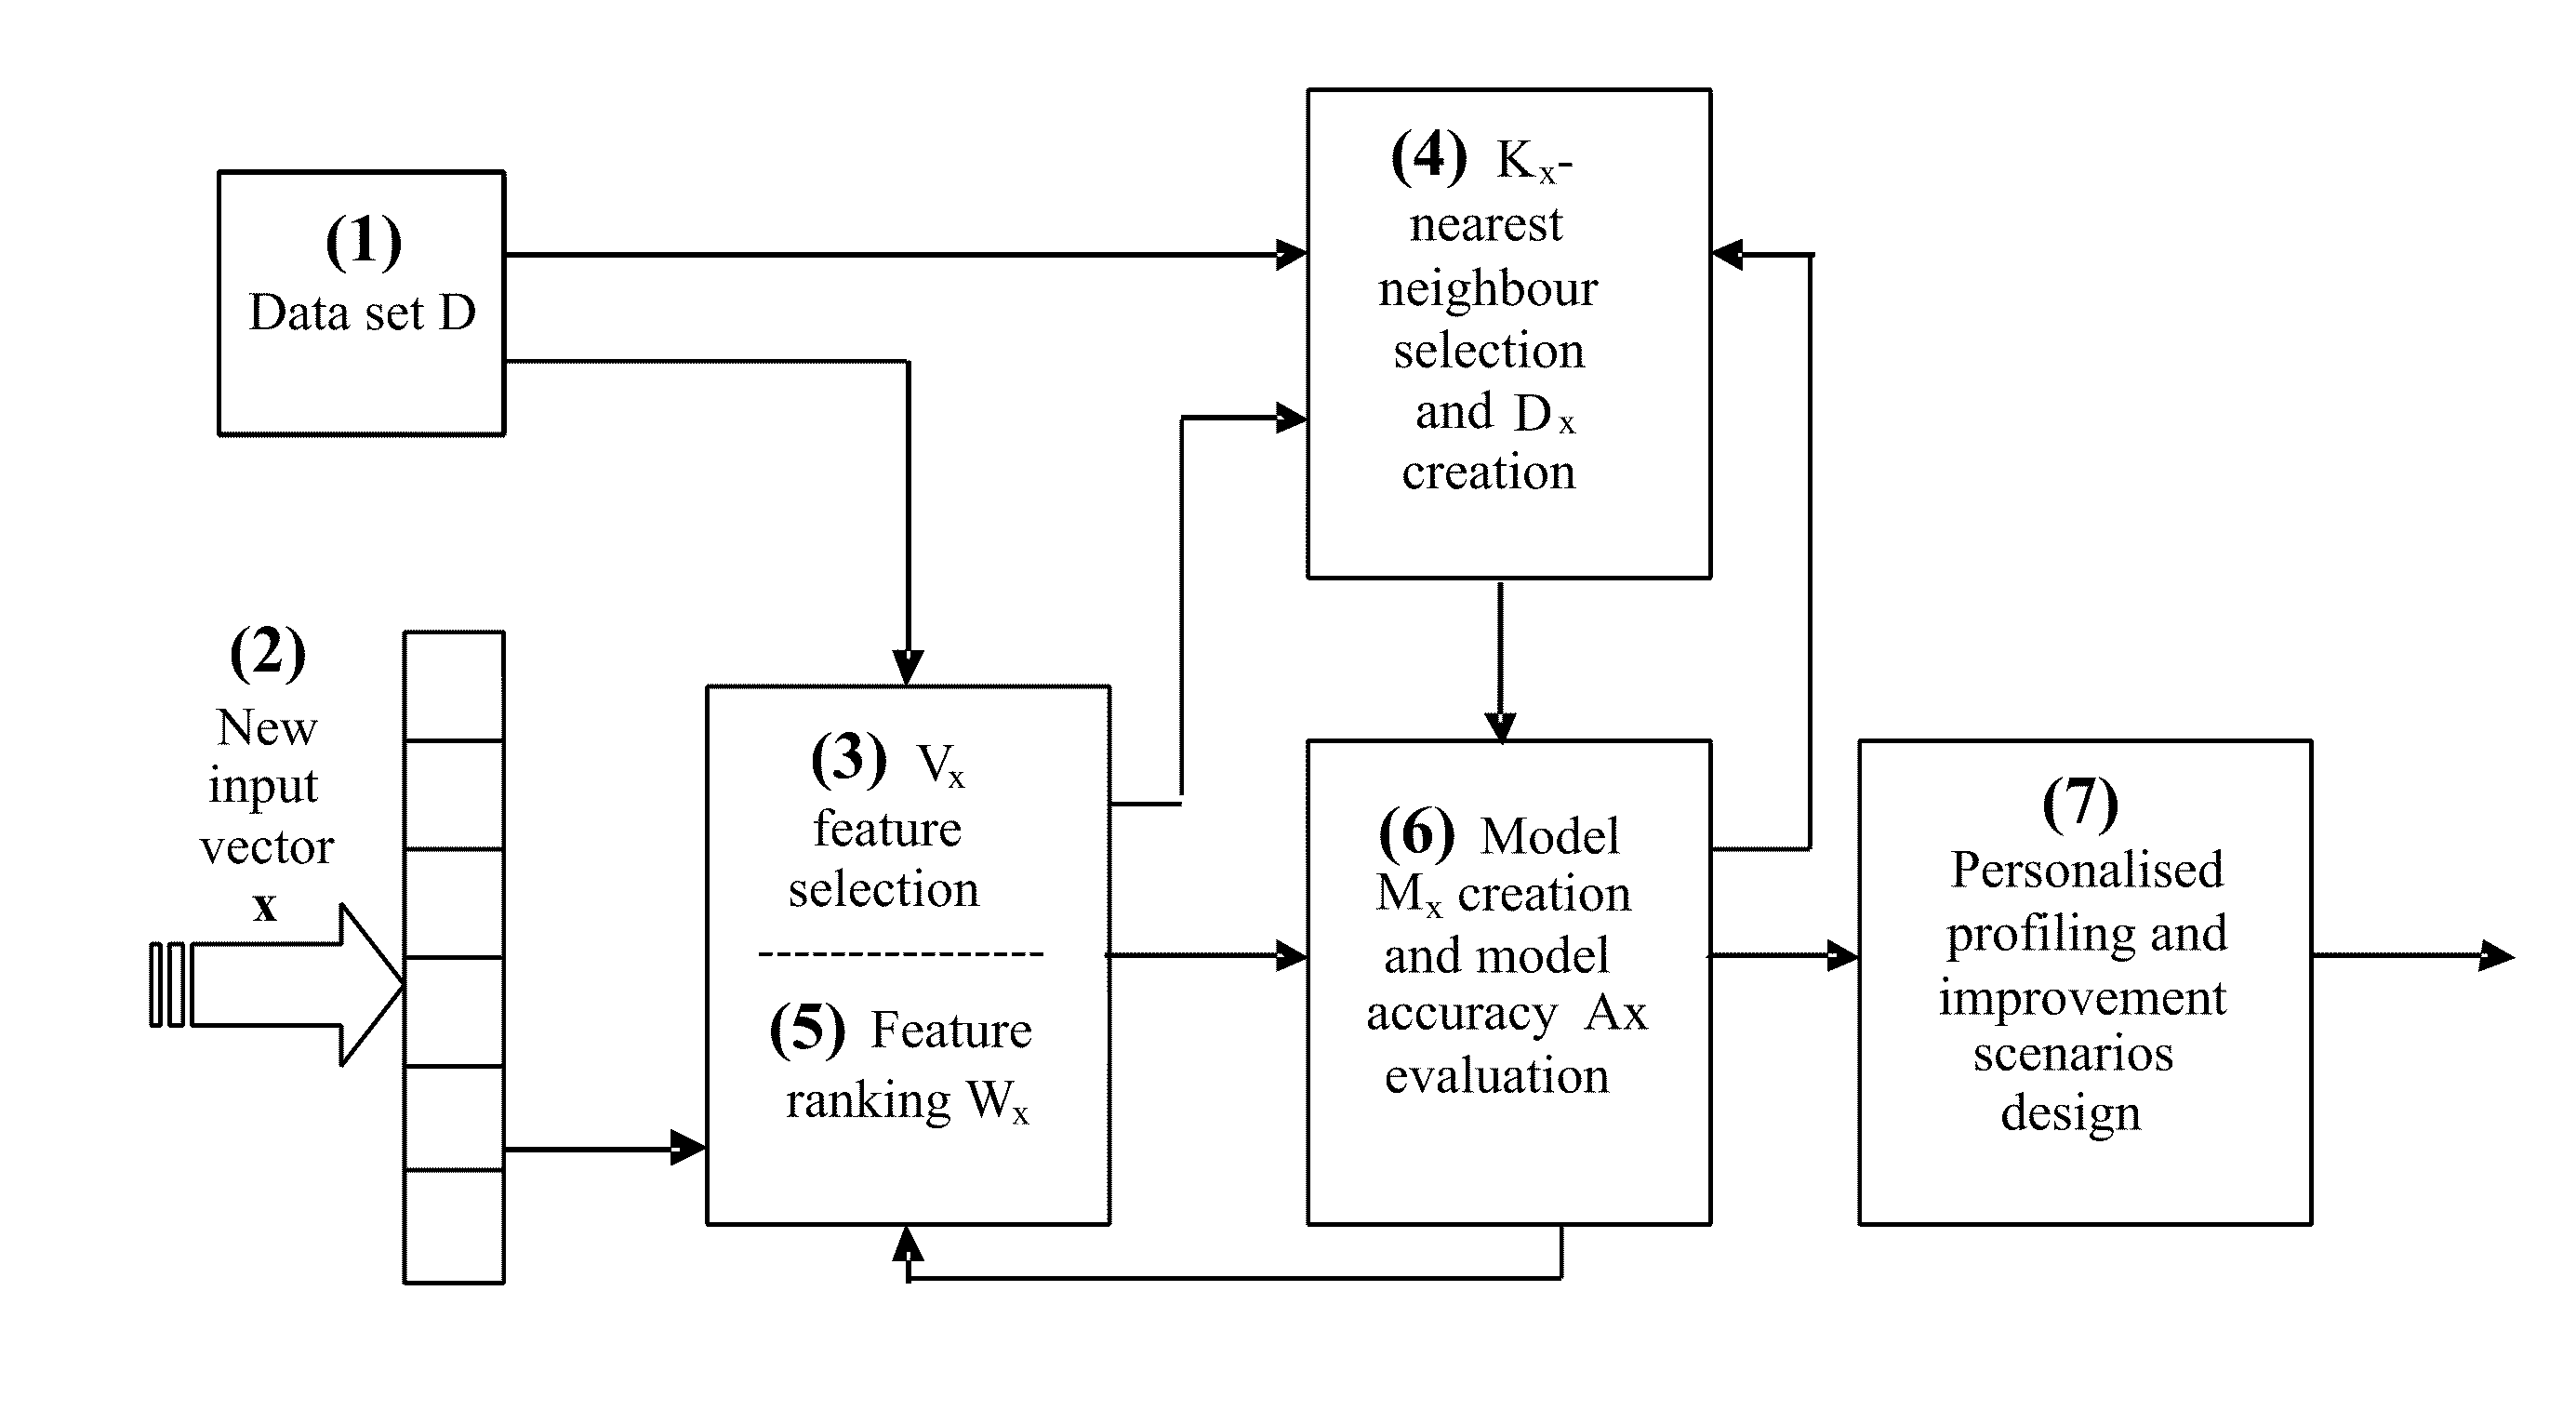
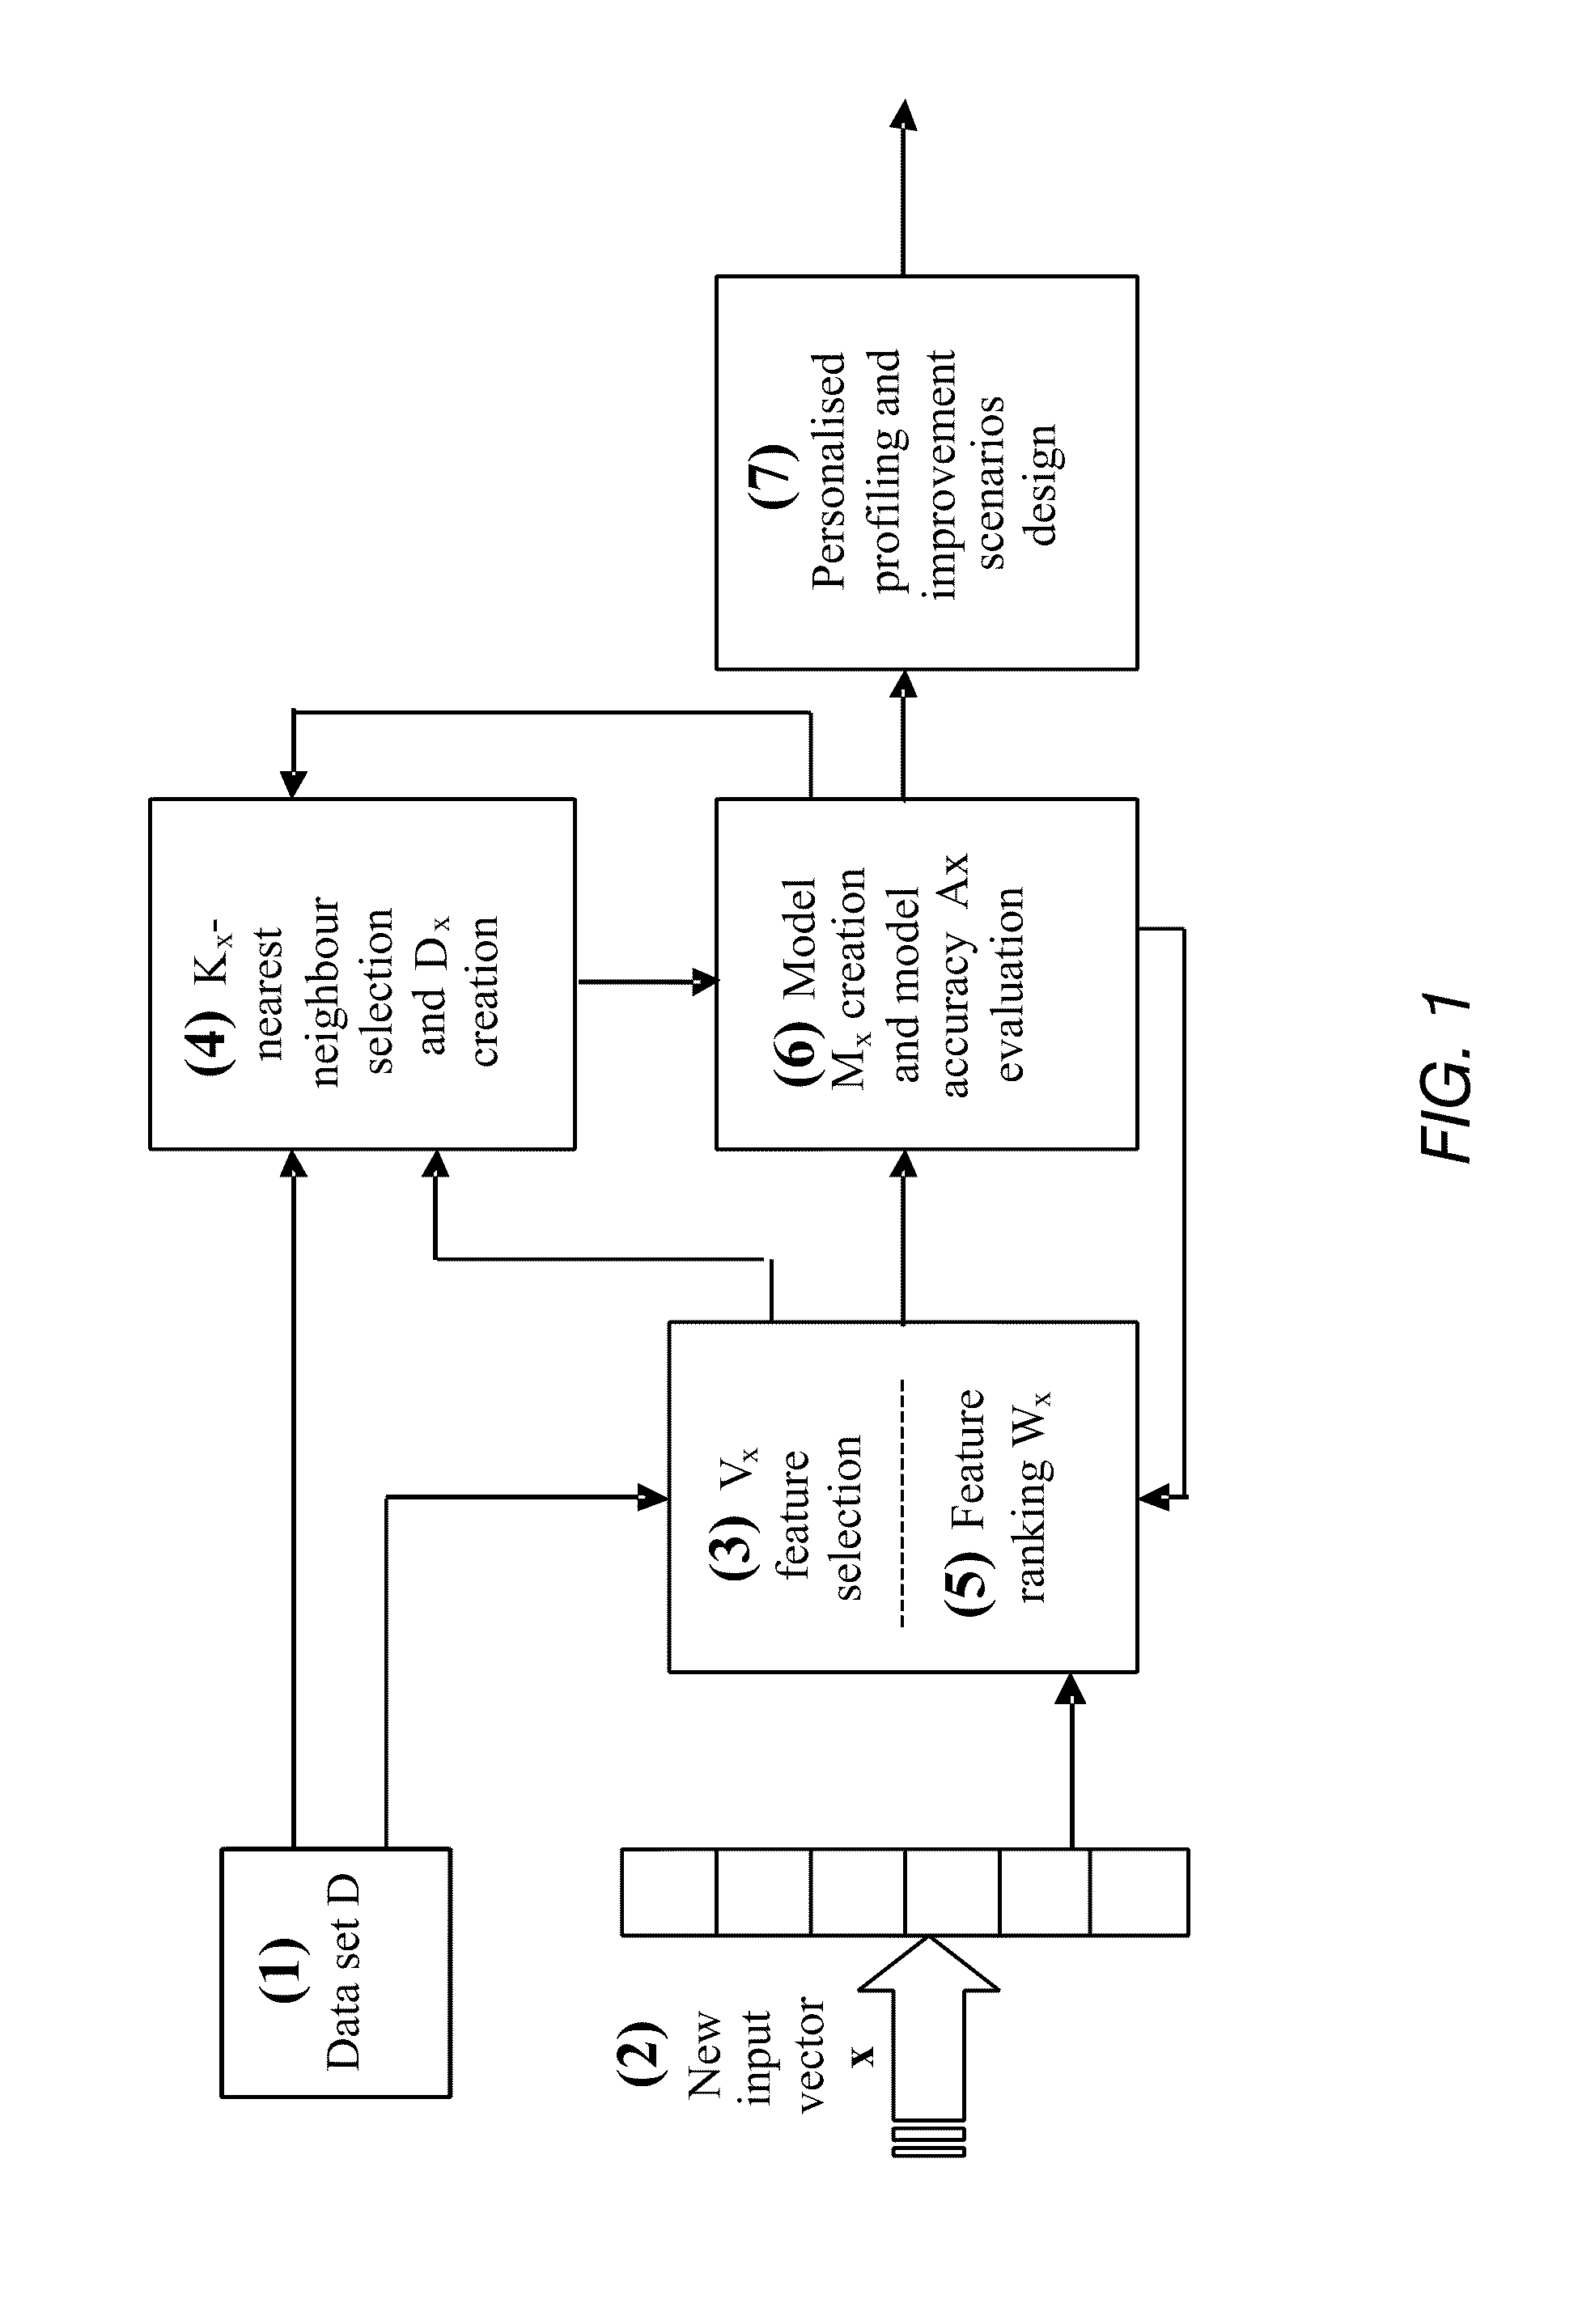
[0026]h) repeating elements a) and / or b) whilst applying an optimisation procedure to optimise Vx and / or Kx, to determine their optimal values and the corresponding sets, before repeating elements c)-h) until maximum accuracy at element f) is achieved.

Problems solved by technology

Despite the furore of interest in this area, there are at present no adequate data analysis methods and systems which can produce highly accurate and informative personalised models from data.
However, statistics have shown very clearly that drugs developed by such global models will only be effective for around average of 70% of people in need of treatment, leaving a relatively large number of patients who will not benefit at all from treatment with the drug.
While local learning models have been very useful to adapt to new data and discover local information and knowledge, these methods do not select specific subsets of features and precise neighbourhood of samples for a specific individual that would be required for a true personalised modeling, for example in personalised medicine.
To summarise, in the above transductive methods, there is no efficient method for personalised feature selection (e.g. features such as important genes, clinical and / or other variables) required for personalised prognosis, classification, profiling, and / or treatment selection.
These transductive methods also do not rank variables (features) in terms of importance form person and for an optimal personal model creation based on these variables and a personalised selection of the nearest neighbour samples from the available data set.
There is also no methodology to suggest how individual scenarios for personal improvement (e.g. treatment) can be designed.

Method used


Image

  • Data analysis and predictive systems and related methodologies
  • Data analysis and predictive systems and related methodologies
  • Data analysis and predictive systems and related methodologies

Examples


example 1

Classifying Rock Versus Mine Based on the Reflection of Sonar Signal

[0159]This may be a standard bench mark data net available from the Machine learning repository of UC Irvine:

(http: / / archive.ics.uci.edu / ml / datasets / Connectionist+Bench+%28Sonar%2C+Mines+vs.+Rocks%29).

[0160]The data set was contributed to the benchmark collection by Terry Sejnowski, now at the Salk Institute and the University of California at San Diego. The data set was developed in collaboration with R. Paul Gorman of Allied-Signal Aerospace Technology Center.

[0161]The data contains 208 samples classified in two classes—rock vs mine based on 60 variables, continuous value between 0 and 1—reflections of a sonar signal from the objects (mine or rock) in different frequency bands. The task is to classify any new input vector of 60 or less such variables into one of the two classes—rock or mine. While a global approach of using one neural network of the type of a multilayer perceptron and a backpropagation learning al...

example 2

Personalised Modeling for the Evaluation (Prediction) of Renal Function

[0178]In another implementation the method can be used for the evaluation of the level of function of a biological system or an organ of an individual, such as the functioning of the heart, the kidney, etc. This is illustrated here on a case study problem of renal function evaluation based on Glomerular Filtration Rate (GFR) as an accurate renal indicator.

[0179]Several nonlinear formulas have been used in practice as “golden standard” global models. The Gates formula (Gates, 1985) uses three variables: age, gender, and serum creatinine, while the MDRD formula (Levey, 1995) uses six variables: age, sex, race, serum creatinine, serum albumin and blood urea nitrogen concentrations. While the existing formulas predict the GFR for patients from different geographic areas with different accuracy, there is no systematic way to adapt these formulas to new data and to personalize the prediction. The method suggested in (M...

example 3

Personalised Modeling for Longevity Prediction of Dialysis Patients

[0185]In another implementation, the described technology can be used to predict the longevity of a person, based on available data on the longevity of other individuals under similar conditions.

[0186]This is illustrated on a case study example of longevity prediction after haemodialysis using the well established DOPPS data as explained below.

[0187]A medical dataset is used here for experimental analysis. Data originates from the Dialysis Outcomes and Practice Patterns Study (DOPPS, www.dopps.org)—see also: D. A. Goodkin, D. L. Mapes & P. J. Held, “The dialysis outcomes and practice patterns study (DOPPS): how can we improve the care of hemodialysis patients?” Seminars in Dialysis, Vol. 14, pp. 157-159, 2001.

[0188]The DOPPS is based upon the prospective collection of observational longitudinal data from a stratified random sample of haemodialysis patients from the United States, 8 European countries (United Kingdom,...


PUM


Abstract

A method of optimising a model Mx suitable for use in data analysis and determining a prognostic outcome specific to a particular subject (input vector x), the subject comprising a number of variable features in relation to a scenario of interest for which there is a global dataset D of samples also having the same features relating to the scenario, and for which the outcome is known is disclosed. In one implementation, the method includes: (a) determining what number and a subset Vx of variable features will be used in assessing the outcome for the input vector x; (b) determining what number Kx of samples from within the global data set D will form a neighbourhood about x; (c) selecting suitable Kx samples from the global data set which have the variable features that most closely accord to the variable features of the particular subject x to form the neighbourhood Dx; (d) ranking the Vx variable features within the neighbourhood Dx in order of importance to the outcome of vector x and obtaining a weight vector Wx for all variable features Vx; (e) creating a prognostic model Mx, having a set of model parameters Px and the other parameters from (a)-(d); (f) testing the accuracy of the model Mx at e) for each sample from Dx; (g) storing both the accuracy from (f), and the model parameters developed in (a) to (e); (h) repeating (a) and/or (b) whilst applying an optimisation procedure to optimise Vx and/or Kx, to determine their optimal values, before repeating (c)-(h) until maximum accuracy at (f) is achieved.

Description

CROSS-REFERENCE TO RELATED APPLICATIONS[0001]This application is a continuation application, and claims the benefit under 35 U.S.C. §§120 and 365 of PCT Application No. PCT / NZ2009 / 000222, filed on Oct. 15, 2009, which is hereby incorporated by reference. PCT / NZ2009 / 000222 also claimed priority from New Zealand Patent Application No. 572036, filed on Oct. 15, 2008, which is hereby incorporated by reference. PCT / NZ2009 / 000222 also claimed priority U.S. Patent Application No. 61 / 105,742, filed on Oct. 15, 2008, which is hereby incorporated by reference.BACKGROUND[0002]1. Field[0003]The described technology relates to data analysis and predictive systems and related methodologies. In particular the described technology relates to customised or personalised data analysis and predictive systems and related methodologies.[0004]2. Description of Related Technology[0005]The concept of personalised medicine has been promoted widely in the recent years through the collection of personalised da...

Claims


Application Information

Patent Timeline
Patent Type & Authority Applications(United States)
IPC IPC(8): G06F17/16G06N20/00G06Q10/00G16B20/20G16B40/20
CPCG06F19/24G06F19/18G06Q10/04G06N99/005G06N20/00G16B40/00G16B20/00G16H50/20G16B20/20G16B40/20
Inventor KASABOV, NIKOLA KIRILOV
Owner KASABOV NIKOLA KIRILOV
Why Eureka
Try Eureka