Robust high resolution spectrum estimation method for accurate phasor, harmonic and interharmonic measurement in power systems

a spectrum estimation and high-resolution technology, applied in the direction of electric devices, instruments, transportation and packaging, etc., can solve the problems of resolution, significant leakage and picket fence effects of dft, severe harmonic and interharmonic distortion in power system signals, etc., to achieve enhanced noise tolerance, robust and accurate, and high frequency resolution

Inactive Publication Date: 2013-07-04
UNIV OF CONNECTICUT
View PDF4 Cites 19 Cited by
  • Summary
  • Abstract
  • Description
  • Claims
  • Application Information

AI Technical Summary

Benefits of technology

[0009]The present disclosure provides a high resolution Subspace-Least Mean Square (S-LMS) method for harmonic and interharmonic measurement in power systems. The S-LMS method is robust and accurate, and provides higher frequency resolution, enhanced tolerance of noise, and better performance under fundamental frequency deviations as compared with the conventional methods described above.
[0010]The S-LMS method combines the strengths of the Subspace concept and the Least Mean Square approach for harmonic and interharmonic measurement, providing accurate estimations of any harmonics and interharmonics even in noisy environments and / or fast dynamic conditions with a data sampling window of only 33.3 milliseconds (ms). The S-LMS method thereby provides fast and highly accurate phasor, harmonic, and interharmonic measurements for power system monitoring and control.
[0011]The speed of the S-LMS method can be further increased by each of three schemes: (1) a “sparsity” (or “heuristic”) scheme that permits a sparse number of candidate frequencies to be scanned to reduce searching loads; (2) a “catch-and-pinpoint” scheme that employs an iterative multisectional search approach to accelerate location of harmonics and interharmonics; and (3) a “hybrid” scheme that combines the “sparsity” and “catch-and-pinpoint” schemes to achieve still greater increases in speed as compared with the original S-LMS method. By using both the real-valued and imaginary-valued components of the signal, each of the schemes (heuristic—Heu, catch-and-pinpoint—CP, and hybrid—Hyb) increases or improves the speed, accuracy, resiliency, and robustness of the S-LMS method.
[0012]Signal vectors and noise vectors are, in general, complex-valued. By adopting only the real-valued component of these complex vectors, each of the above schemes can have a corresponding real-implemented version (i.e., HeuR, CPR, and HybR) that further increases speed and accuracy of the method as compared with the original S-LMS method.
[0013]Thus, including the three “real-implemented” versions, the present disclosure provides a total of six different schemes to improve the speed, accuracy, resiliency, and robustness of the S-LMS method.
[0014]The sparsity, catch-and-pinpoint, and hybrid schemes can also improve the accuracy of harmonics measurements for high-voltage (HV) power systems where interharmonics are often negligible. By using the sparsity of power system signals, these schemes are not only faster but also more accurate and more robust as compared with the original S-LMS method.

Problems solved by technology

The increasing uses of renewable energy resources and of power electronic devices have resulted in severe harmonic and interharmonic distortions in power system signals.
However, in real-world power systems, interharmonics often exist with time-varying or long periodicity intervals.
Thus, DFT suffers from significant leakage and picket fence effects, and also the significant problem of resolution because of several invalid assumptions made in this method, such as zero data or repetitive data outside of the duration of observations.
However, if both interharmonic and harmonic components exist in the test signal, or during serious dynamic events (e.g., loss of synchronism and slow oscillation), measurement accuracy of DFT is inevitably lower than in the steady state without harmonic or off-harmonic disturbances.
However, a disadvantage of windowed DFT is that frequency resolution is decreased compared to conventional DFT, meaning a longer data window is required.
This makes windowed DFT unsuitable for measuring interharmonics which are usually unstable and time-varying.

Method used


Image

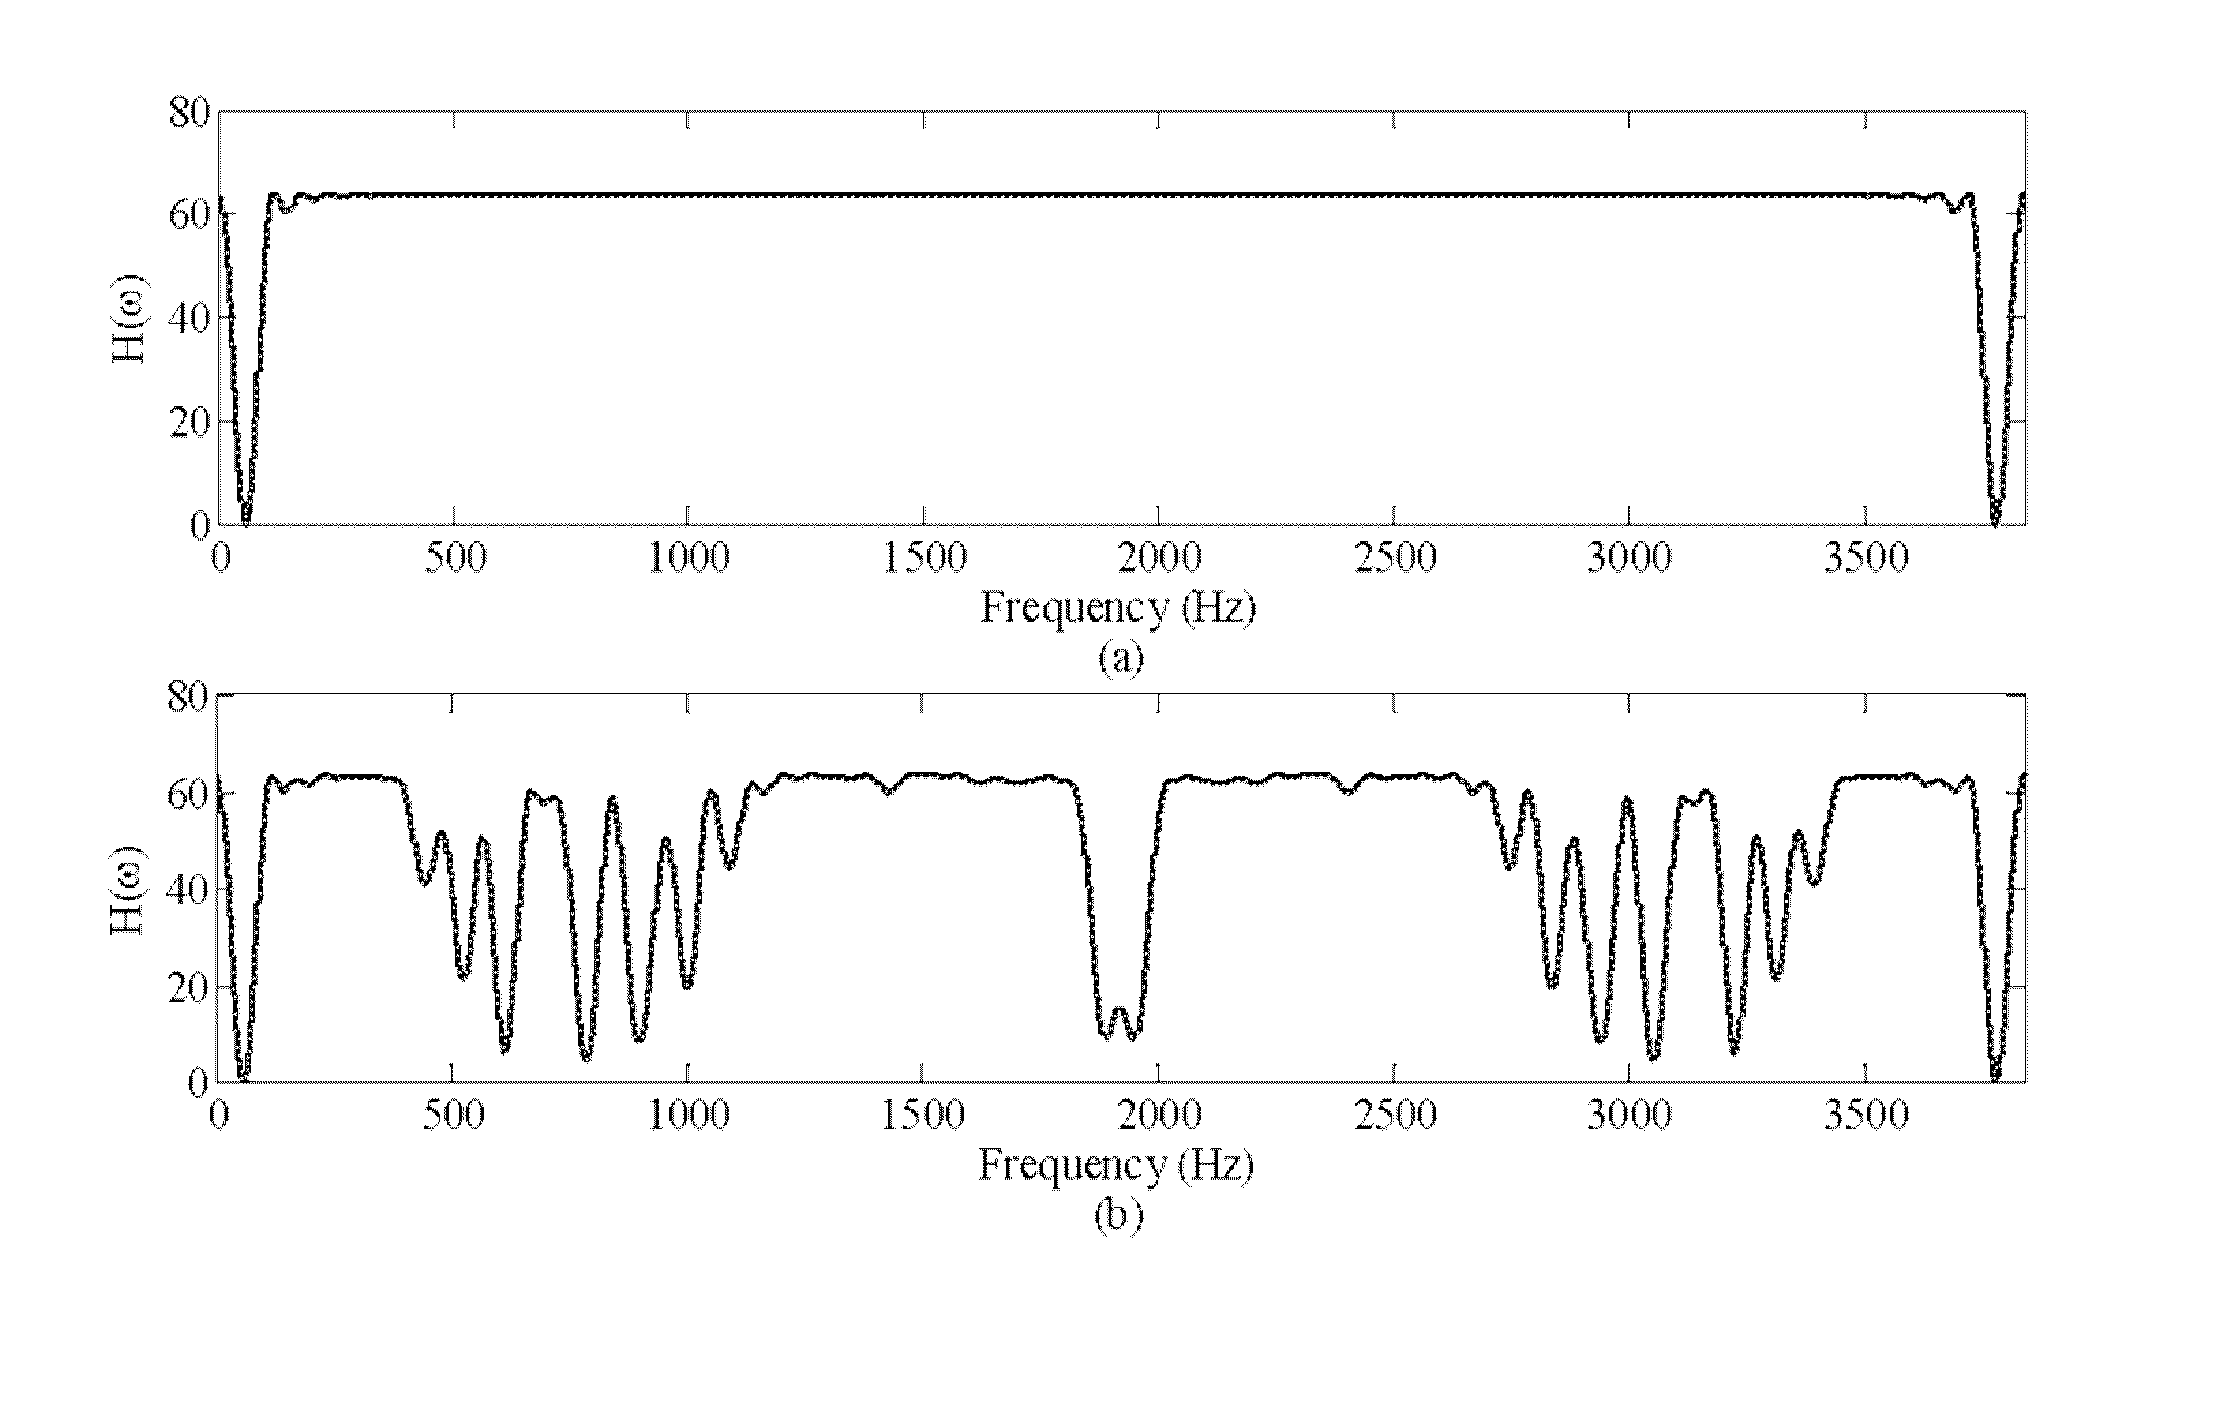
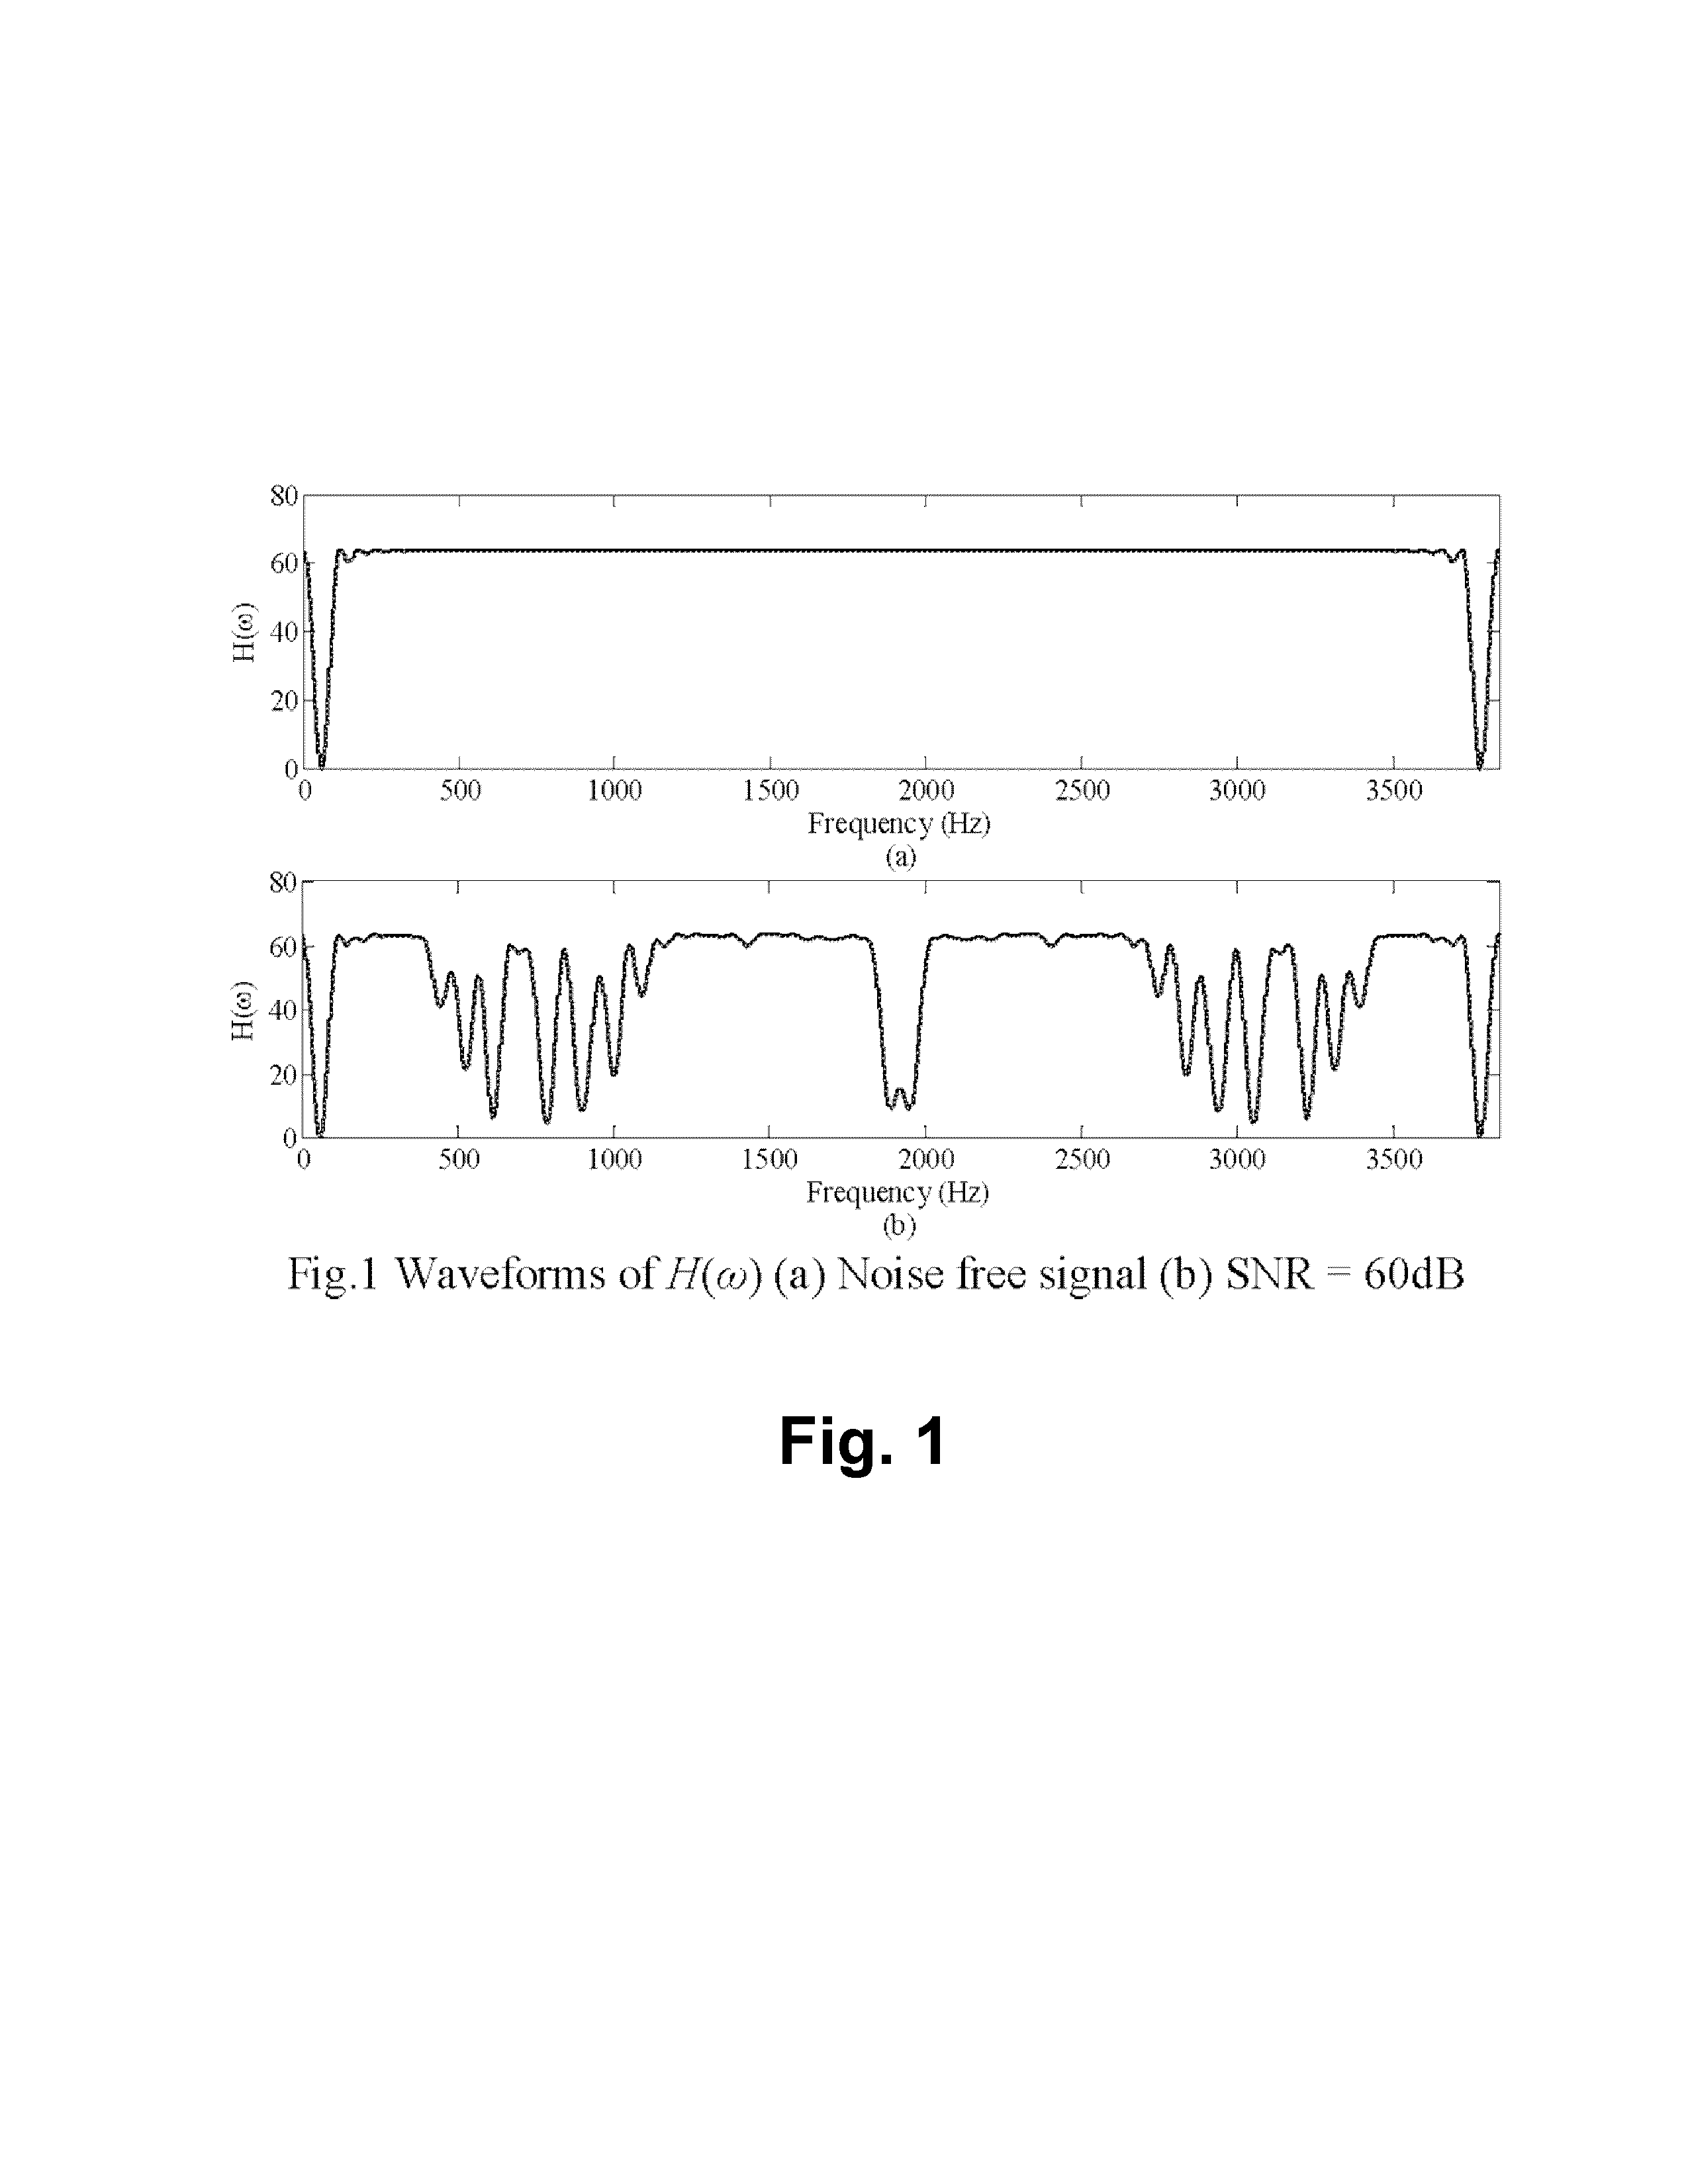
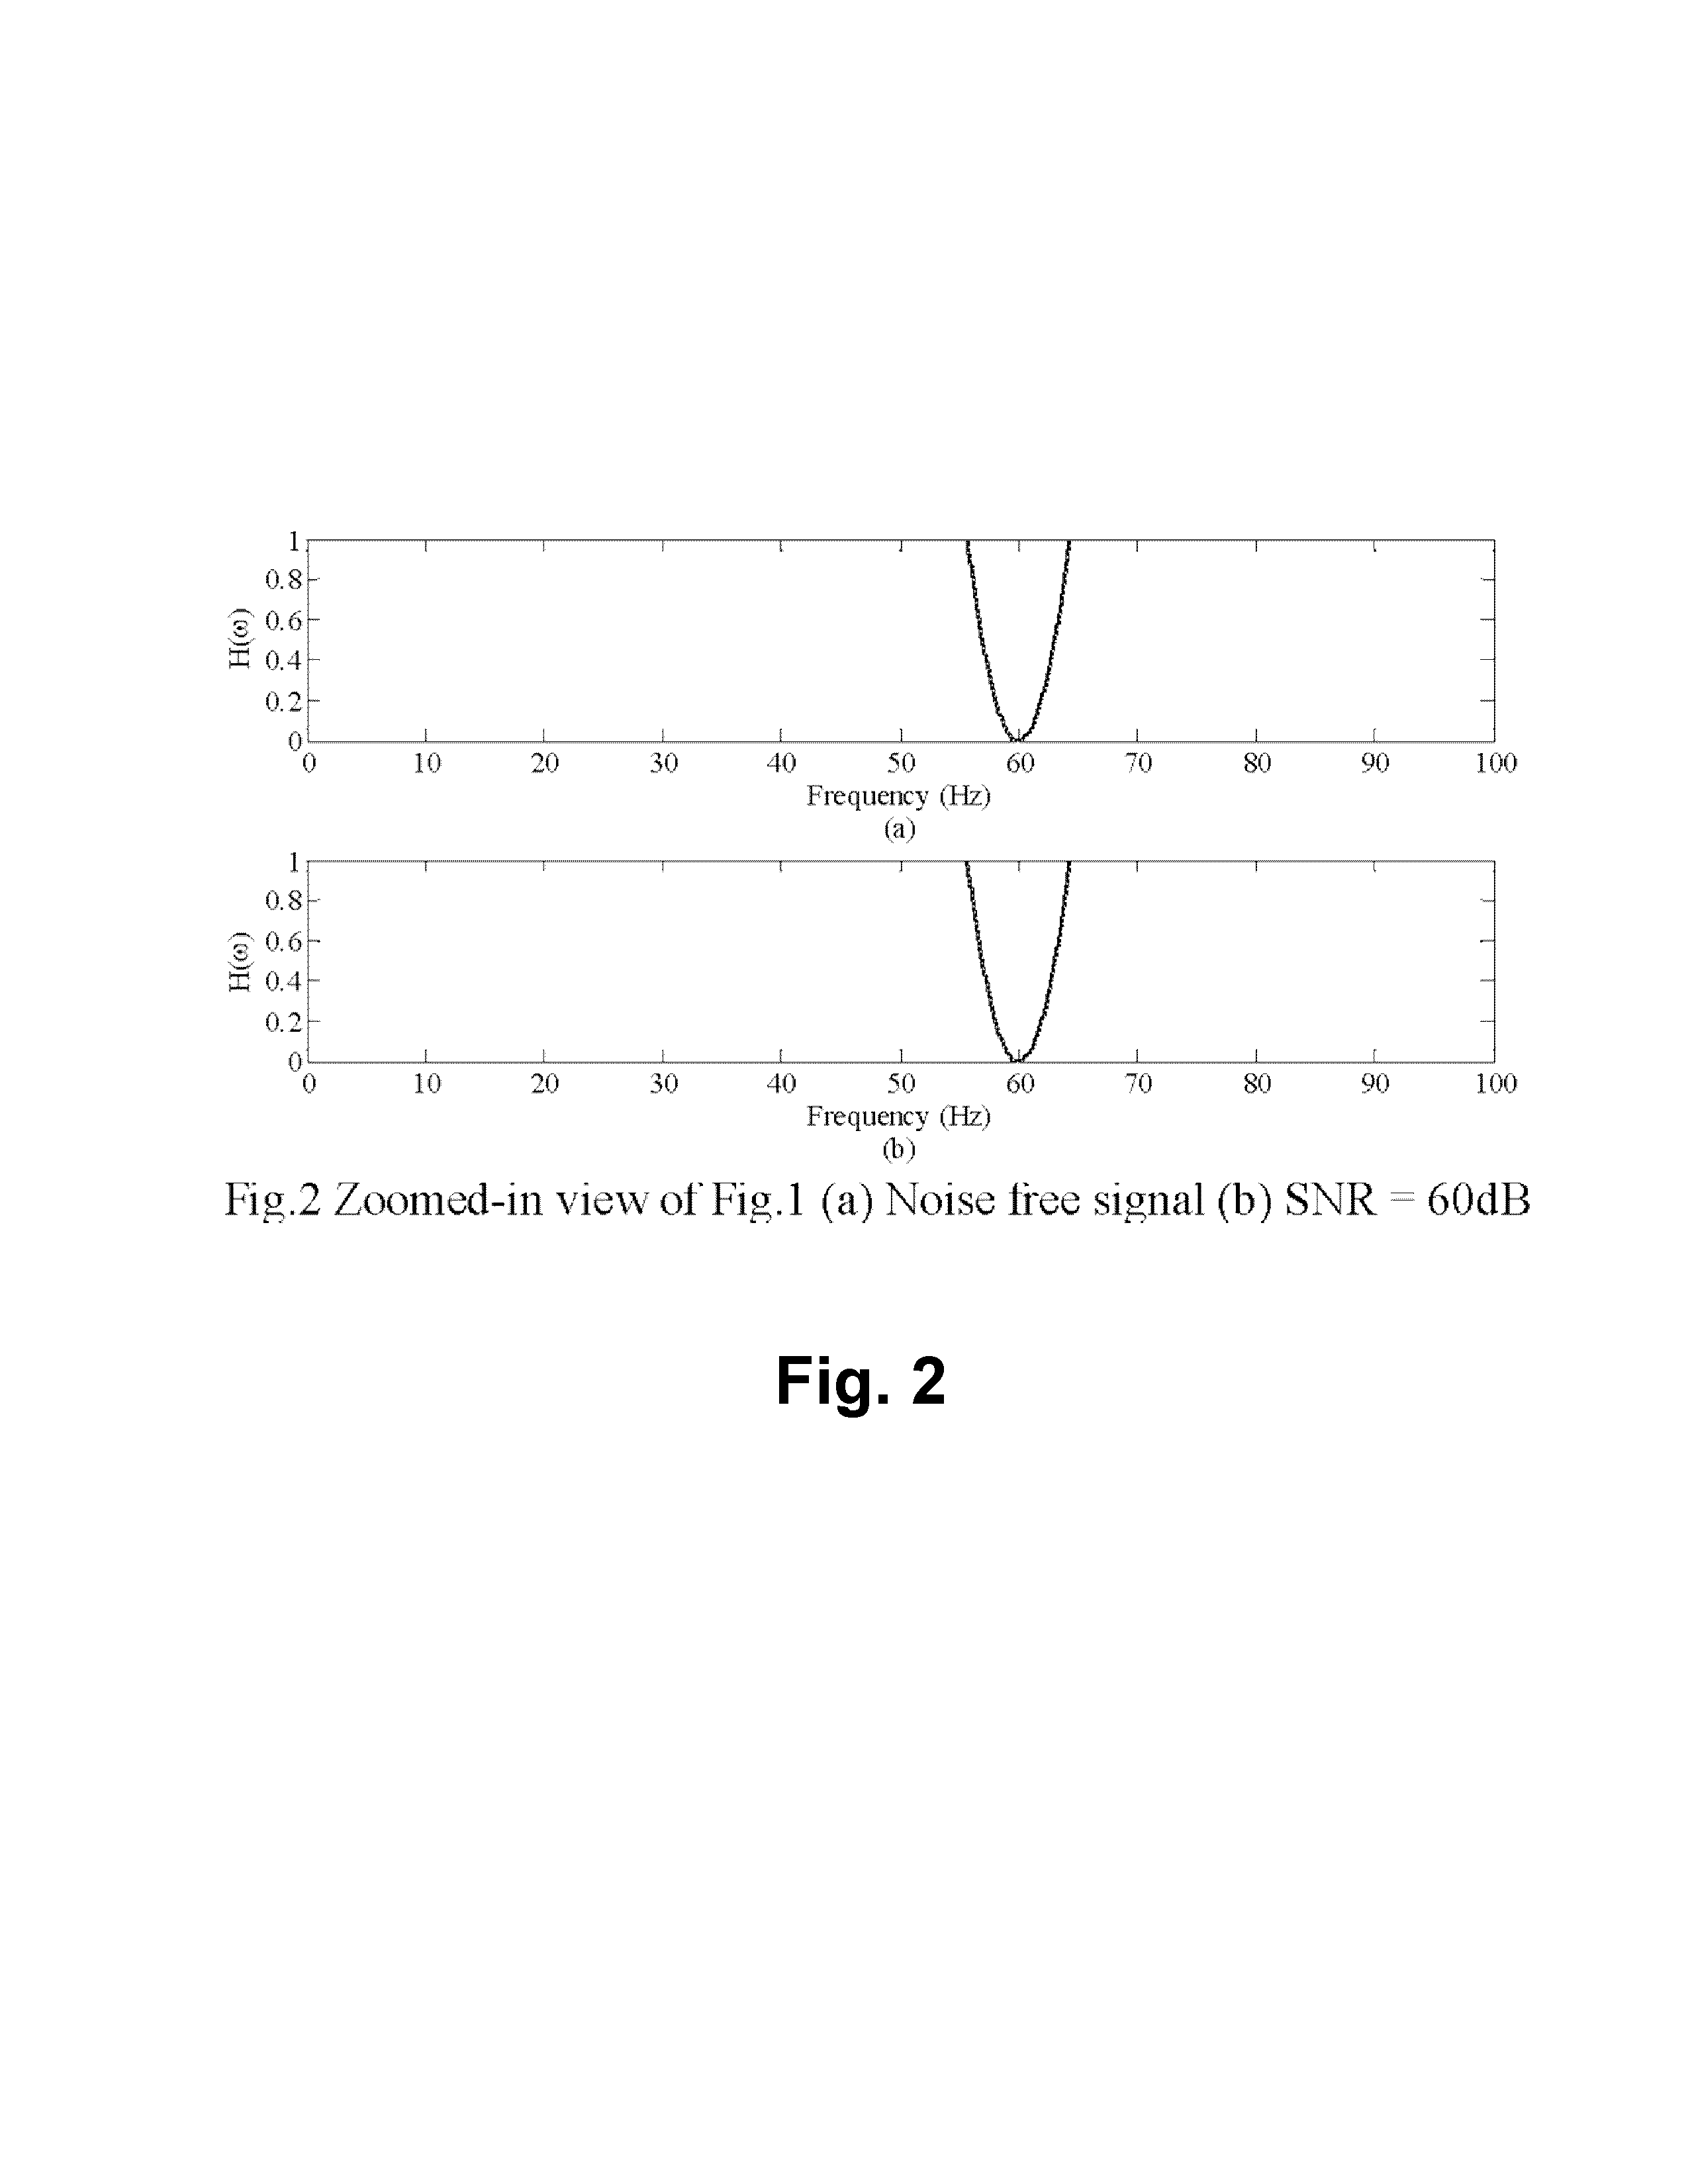
  • Robust high resolution spectrum estimation method for accurate phasor, harmonic and interharmonic measurement in power systems
  • Robust high resolution spectrum estimation method for accurate phasor, harmonic and interharmonic measurement in power systems
  • Robust high resolution spectrum estimation method for accurate phasor, harmonic and interharmonic measurement in power systems

Examples


case 1

[0094]

x(n)=∑iAicos(n2πfiΔt+φi),

where values of Ai, fi, and φi are given in Table I below. The test signal is composed of five tones: fundamental frequency component at 60 Hz, 9th harmonic at 540 Hz, and three interharmonic components at 98 Hz, 252 Hz and 312 Hz.

TABLE ITable I: Signal Parameters and Measurement Results Using S-LMSSIGNAL PARAMETERS AND MEASUREMENT RESULTSUSING S-LMSAiActual values1.000.200.100.100.02(pu)Measured values1.000.200.100.100.02fiActual values60.098.0252.0312.0540.0(Hz)Measured values60.098.0252.0312.0540.0φiActual values0.0060.0030.000.0090.00(°)Measured values0.0060.0030.000.0090.00

[0095]The spectra obtained by Discrete Fourier transform (DFT) and by S-LMS are illustrated in FIGS. 5(a) and 5(b), respectively. FIG. 6(a) is a magnified view of a portion of FIG. 5(a), and FIG. 6(b) is a magnified view of a portion of FIG. 5(b) in the area where the x-axis is from 0 to 600 Hz and the y-axis is from 0 to 0.25. As can be seen most clearly in FIG. 6(a), the DFT f...

case 2

[0096] x(t)=cos(2πf1t+φ1)+0.2 cos(2πf2t+φ2), where f1=60 Hz, f2=60.2 Hz, φ1=0, and φ2=π / 6.

[0097]Case 2 was a study to verify the ultra-high resolution of S-LMS. The test signal carries two components with a frequency difference of Δf=0.2 Hz. To separate these two components in Case 2, the DFT method needs a data window length longer than 1 / Δf, that is, at least 5 seconds. In contrast, S-LMS does not have such stringent limitations, and can separate the two components accurately with a data window of 1 / 30 seconds.

[0098]FIG. 9(a) and FIG. 9(b) show the spectra obtained by DFT and S-LMS, respectively, with a data window length of 1 / 30 seconds. FIG. 10(a) is a magnified view of a portion of FIG. 9(a), and FIG. 10(b) is a magnified view of a portion of FIG. 9(b) in the area where the x-axis is from 59.9 to 60.3 Hz and the y-axis is from 0 to 1e-5. From FIGS. 9 and 10, it can be seen that DFT was unable to distinguish the two components. Instead, they are merged together in the DFT spectr...

case 3

[0100]

x(n)=∑iAicos(n2πfiΔt+φi)+w(n)

where w(n) is a white noise such that SNR is 50 dB, and values of Ai, fi, and φi are given in Table III below.

TABLE IIITable III; Signal Parameters and Measurement Results UsingS-LMS (SNR = 50 dB)SIGNAL PARAMETERS AND MEASUREMENT RESULTSUSING S-LMS (SNR = 50 DB)AiActual value1.000.200.100.100.02(pu)Measured value1.000.200.100.100.02fiActual value60.098.0252.0312.0540.0(Hz)Measured value60.098.0252.0312.0539.6φiActual value0.0060.0030.000.0090.00(°)Measured value0.0059.8929.960.0089.50

[0101]The signal in Case 3 is similar to that in Case 1, with the only exception of the 50 dB white noise. FIGS. 12(a) and 12(b) are the spectra obtained using DFT and S-LMS methods, respectively. FIG. 13(a) is a magnified view of a portion of FIG. 12(a), and FIG. 13(b) is a magnified view of a portion of FIG. 12(b) in the area where the x-axis is from 0 to 100 Hz and the y-axis is from 0 to 0.25.

[0102]From these results, it can be seen that S-LMS provided high levels ...


PUM


Abstract

A high-resolution Subspace-Least Mean Square (S-LMS) method for harmonic and interharmonic measurement in power systems is provided. The eigenvector corresponding to the smallest eigenvalue is used to calculate the frequencies of the signal, and the least mean square method is used to estimate the amplitude and phase angle of harmonic and interharmonic components based on the computed frequencies and time domain measurements of the signal. Three schemes, namely sparsity, catch-and-pinpoint, and hybrid are presented. The S-LMS method provides accurate phasor, harmonic and interharmonic measurements for power system monitoring. The speed, accuracy, and resilience of the S-LMS method can be further increased by each of the three schemes. The method has a wide range of applications in power quality analyzers, synchronized phasor measurement, situational awareness, dynamic equivalencing, and smart meters.

Description

CROSS-REFERENCE TO RELATED APPLICATIONS[0001]This application claims the benefit of U.S. Provisional Application No. 61 / 581,535, filed on Dec. 29, 2011, the entire contents of which are incorporated by reference herein.STATEMENT REGARDING FEDERALLY SPONSORED RESEARCH[0002]This invention was made with government support under Contract No. DE-EE0003226, awarded by the Golden Field Office, U.S. Department of Energy. The government has certain rights in the invention.BACKGROUND OF THE DISCLOSURE[0003]1. Field of Disclosure[0004]A method is disclosed for harmonic and interharmonic measurement in power systems using a high-resolution Subspace-Least Mean Square (S-LMS) method. The method provides higher frequency resolution, enhanced noise tolerance, and improved performance under fundamental frequency deviations as compared with present methods. The speed, accuracy, and resilience of the S-LMS method can be further increased by three schemes. The S-LMS method of the present disclosure may...

Claims


Application Information

Patent Timeline
Patent Type & Authority Applications(United States)
IPC IPC(8): G06F17/17G06F17/16G01R21/00
CPCG06F17/10G06F17/17G01R21/00Y02E60/728G01R23/20G01R19/2513Y04S10/265G06F17/16Y02E60/00Y04S10/00Y04S10/22Y02E40/70
Inventor ZHANG, PENGXUE, HUIABDOLLAHI, ALI
Owner UNIV OF CONNECTICUT
Why Eureka
Try Eureka