Determination of gene expression levels of a cell type

a cell type and gene expression technology, applied in the field of gene expression level analysis, can solve the problems of inpractical procedures in the setting of clinical service laboratories, laborious and tedious cell subpopulation separation, and limitations in current methods of gene expression analysis in peripheral blood samples

Active Publication Date: 2013-07-25
THE CHINESE UNIVERSITY OF HONG KONG
View PDF1 Cites 13 Cited by
  • Summary
  • Abstract
  • Description
  • Claims
  • Application Information

AI Technical Summary

Benefits of technology

[0008]Embodiments can provide methods, systems, and compositions to determine gene expression level (transcript abundance) of a specified cell-type subpopulation by analysis of a cell mixture sample composed of multiple subpopulations of various cell-types without the need of prior separation of the component cell-type subpopulations. For example, a target gene and a reference gene can be identified as being informative for a specific cell-type subpopulation. A gene can be defined as being informative for a subpopulation when at least 50% of the gene's transcripts (or other percentage greater than 50%) in the cell mixture are from the subpopulation. Informative genes can be identified from calibration experiments that may involve isolating subpopulation, but such experiments can be performed by a creator of an assay, and not during production runs. A relative abundance between the informative target and reference gene in the cell mixture can be used as a biomarker, e.g., as equivalent to the relative abundance in a sample of isolated cells of the subpopulation. As described herein, this relative expression level in the cell mixture of the informative target and reference genes can correlate to the relative expression when measured in the isolated subpopulation. Thus, a similar biomarker can be obtained without the difficult step of isolating the cells of the subpopulation.

Problems solved by technology
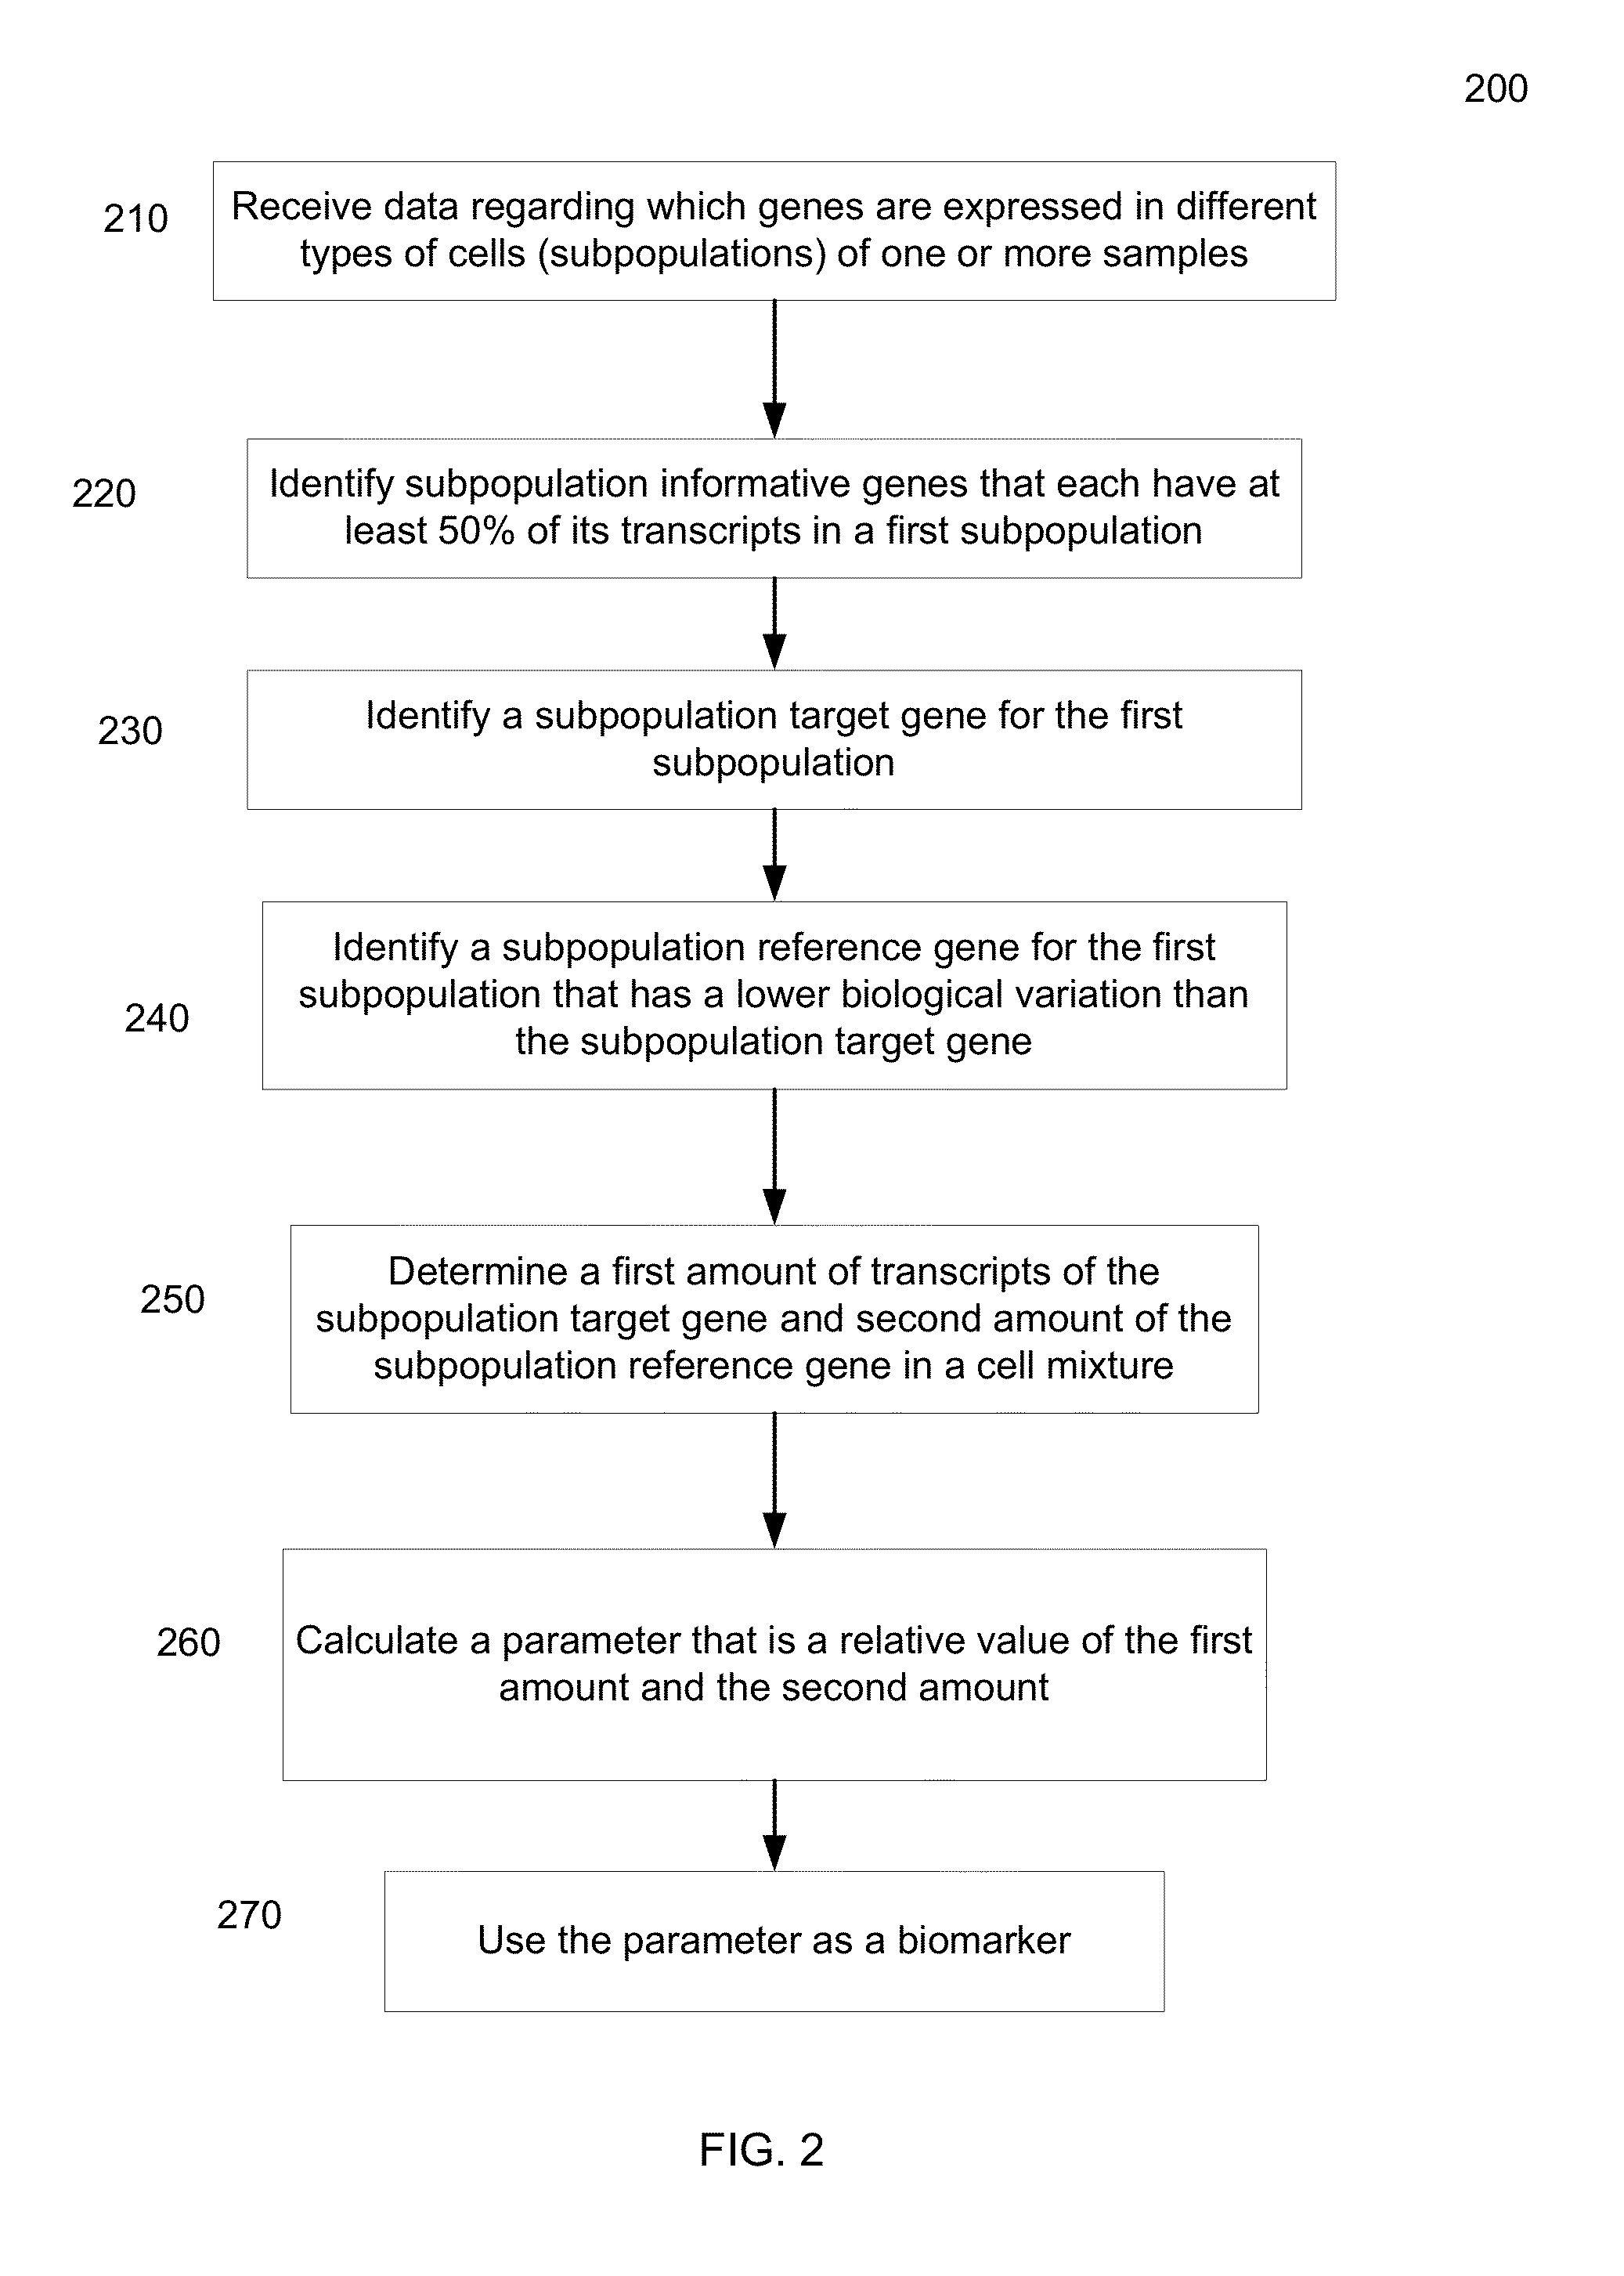
Cell subpopulations separation is laborious and tedious.
Such procedure is basically not practical in the setting of a clinical service laboratory.
Thus, there are limitations in current methods of analysis of gene expression in peripheral blood samples.

Method used


Image

  • Determination of gene expression levels of a cell type
  • Determination of gene expression levels of a cell type
  • Determination of gene expression levels of a cell type

Examples


example 1

V-1. Example 1

B Lymphocytes

[0130]The following examples are provided by way of illustration only and not by way of limitation. Those of skill in the art will readily recognize a variety of non-critical parameters that could be changed or modified to yield essentially the same or similar results.

[0131]A. Preparation

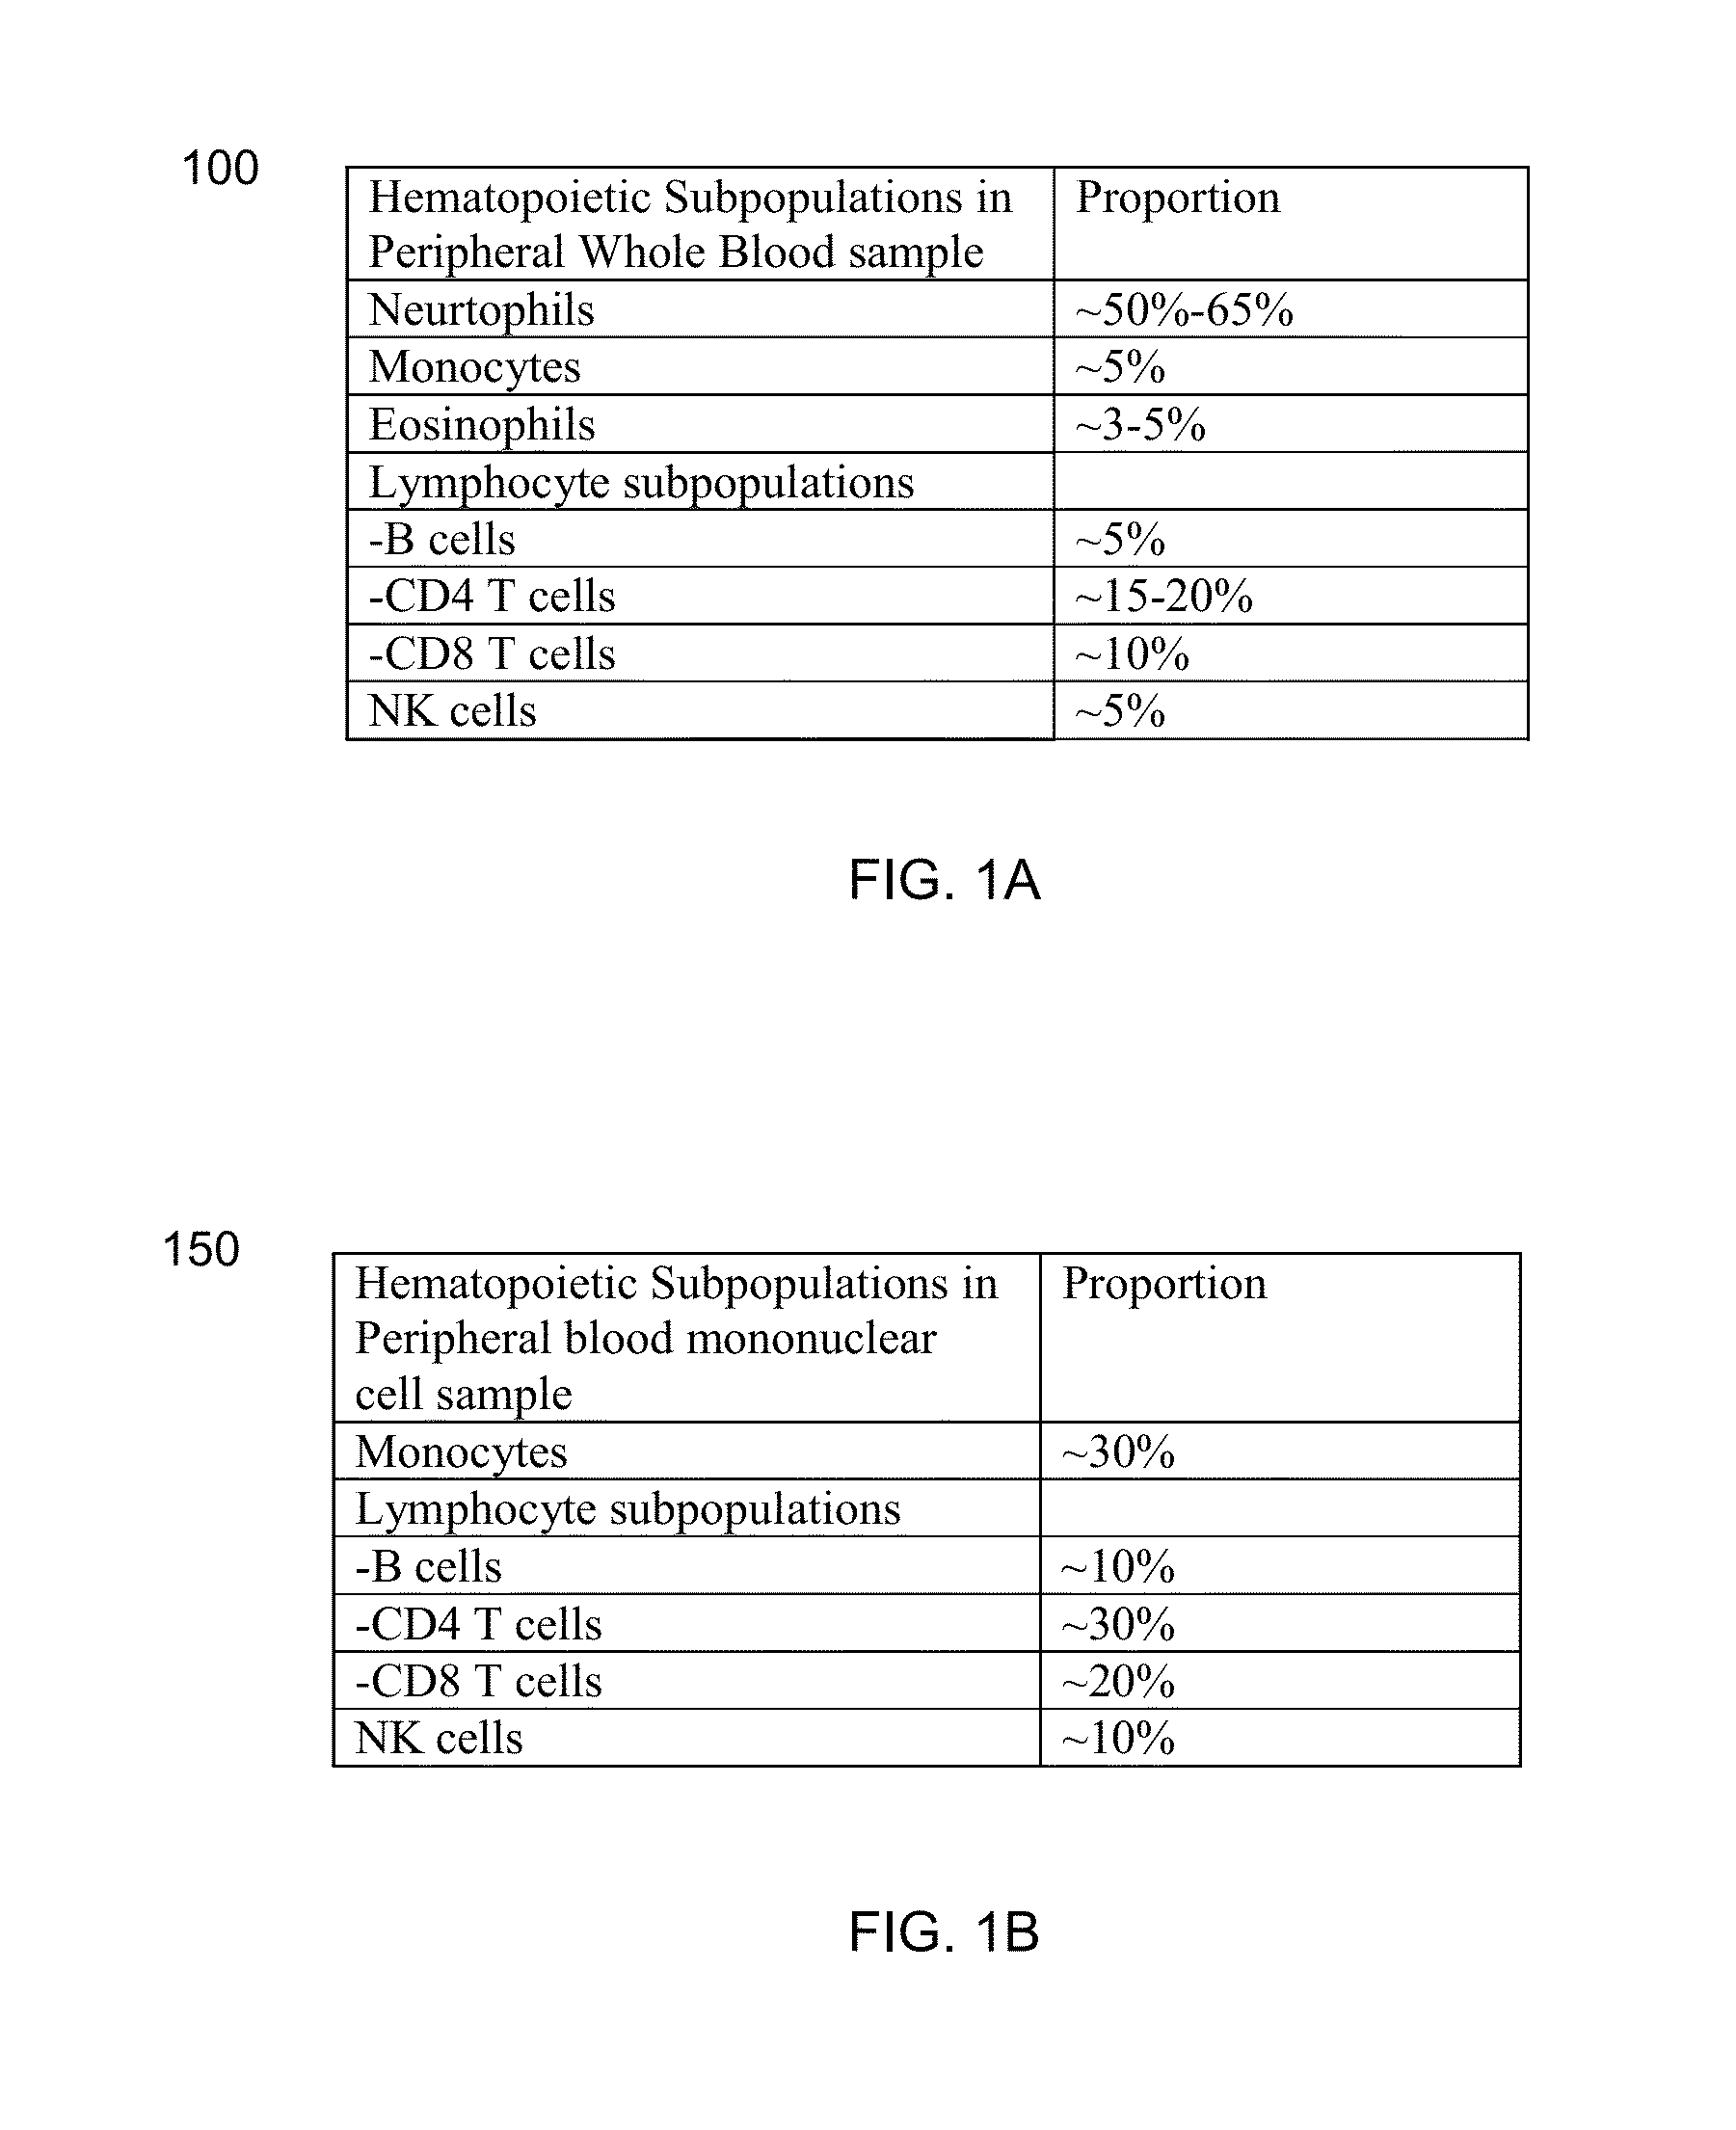
[0132]Blood samples were collected from 22 healthy volunteers. All samples were processed to collect B lymophocytes by magnetic bead cell separation. Quantification of candidate references genes were carried out in (1) Peripheral whole blood treated with Tizol, (2) peripheral blood collected in PAX tubes, (3) PBMC collected by Ficoll preparation and (4) the purified B lymphocytes by 2 steps reverse transcription real-time PCR.

[0133]Although both red blood cells and platelets are not nucleated cell, both contains gene transcripts. However, both of them only contain transcripts of much smaller number of genes than nucleated hematopoietic subpopulations, which is the leukocyt...

example 2

V-2. Example 2

Total T Lymphocytes

[0152]Regarding methods and subjects, blood samples of thirty consented healthy individuals were included in this example. Two types of samples were used, which were (1) peripheral whole blood immediately treated with Trizol reagent (Invitrogen, US) after collection and (2) CD3 total T cells separated (or enriched) samples from each individuals. For isolation of CD3+ve total T cells subpopulation, PBMC was prepared from freshly collected whole blood samples. Then CD3 micro beads (Miltenyi Biotec) was added. After incubation as instructed by the manufacturer's protocol, the mixture was then washed and passed through a magnetic field in a LS column (Miltenyi Biotec). After further rounds of washing inside the column, the enriched / purified samples of the CD3+ve T cells subpopulation were harvested by elution after removal of the magnetic field. An aliquot of the enriched sample was analysed by two-color immunofluorescence flow cytometry to confirm enric...

example 3

V-3. Example 3

Granulocytes

[0159]Regarding methods and subjects, blood samples of eighty consented healthy individuals were included in this example. In this example, two types of samples were used, which were (1) peripheral whole blood immediately treated with Trizol reagent (Invitrogen, US) after collection and (2) granulocytes separated (or enriched) samples from each individuals. Granulocyte subpopulation was separated from other nucleated cells by Ficoll solution following standard protocol. Granulocytes were collected from the Ficoll-RBC interface after standing in room temperature and centrifugation. After rounds of washing, the enriched / purified samples of granulocytes subpopulation were collected as pellet after centrifugation and treated by Trizol reagent and stored at −80° C.

[0160]TA of the following candidate genes were examined by real-time QPCR after reverse transcription: AQP1, BCL2A1, CEACAM6, CEACAM8, Clorf24, CSF2, DEFA4, FCGR3B, IL-4, IL-8, IL8RB, LTF, MMP25, MS4A3...


PUM

PropertyMeasurementUnit
volumeaaaaaaaaaa
temperatureaaaaaaaaaa
total volumeaaaaaaaaaa

Abstract

Methods, systems, and compositions can determine gene expression level of a specified cell-type subpopulation by direct analysis of a cell mixture sample composed of multiple subpopulations of various cell-types without the need of prior separation of the component cell-type subpopulations. A target gene and a reference gene can be identified as being informative for a specific cell-type subpopulation when at least 50% of the gene's transcripts in the cell mixture are from the subpopulation. This relative expression level in the cell mixture of the informative target and reference genes can correlate to the relative expression when measured in the isolated subpopulation. Thus, a similar biomarker can be obtained without the difficult step of isolating the cells of the subpopulation.

Description

CROSS-REFERENCES TO RELATED APPLICATION[0001]This application is a non-provisional of and claims the benefit of U.S. Patent Application No. 61 / 510,445, entitled “METHODS, PROCESS AND COMPOSITIONS FOR DETERMINATION OF GENE EXPRESSION LEVELS OR TRANSCRIPT ABUNDANCE OF A CELL TYPE,” filed on Jul. 21, 2011, which is herein incorporated by reference in its entirety for all purposes.FIELD OF INVENTION[0002]The present disclosure relates to an analysis of gene expression level (transcript abundance) in different hematopoietic subpopulations in blood samples. More particularly, embodiments can determine transcript abundance of a gene in a particular subpopulation of hematopoietic cells in a mixture of different cell types without the need to separate the cells to obtain a cell fraction of the particular subpopulation.BACKGROUND[0003]Expression levels, transcript abundance (TA), of genes in peripheral blood cells are important biomarkers. Current methods using gene TA in peripheral blood sam...

Claims


Application Information

Patent Timeline
Patent Type & Authority Applications(United States)
IPC IPC(8): G06F19/20C12Q1/68G16B25/10G16B20/20
CPCC12Q1/6809G06F19/18G06F19/20G16B20/00G16B20/20G16B25/10G16B25/00
Inventor TANG, LEUNG SANG NELSON
Owner THE CHINESE UNIVERSITY OF HONG KONG
Why Eureka
Try Eureka