Prediction method of glomerular filtration rate from urine samples after kidney transplantation

a glomerular filtration rate and urine sample technology, applied in the field of prediction of glomerular filtration rate (gfr) from urine samples after kidney transplantation, can solve the problems of limited set of established clinical diagnostic markers that lack sufficient specificity and sensitivity and detect, measures only one aspect of kidney function, and does not have high specificity and sensitivity

Inactive Publication Date: 2014-08-21
KYUNGPOOK NAT UNIV IND ACADEMIC COOP FOUND
View PDF4 Cites 14 Cited by
  • Summary
  • Abstract
  • Description
  • Claims
  • Application Information

AI Technical Summary

Benefits of technology

[0012]Other objects and advantage of the present invention will become apparent from the detailed description to follow taken in conjugation with the appended claims and drawings.
[0013]In one aspect of the present invention, there is provided a method for predicting glomerular filtration rate (GFR) from urine samples after kidney transplantation to provide an information needed for predict renal function after the transplantation, comprising detecting metabolic profiles of 5a-androst-3-en-17-one (AS), glycocholic acid (GC), sphingosine (SG), tryptophan (TR) and histidine (HT) from urine samples of patients.
[0014]In the method for predicting glomerular filtration rate (GFR) according to the present invention, the phrase “detecting metabolic profiles” means that the quantity (peak intensity) of the five metabolites are detected by LC / MS analysis from the urine samples. Preferably, after the detection of metabolic profiles, an equation for predicting GFR can be derived using PLS loading from PLS analysis between the five metabolites and GFR.
[0015]In a preferred embodiment, the method for predicting glomerular filtration rate (GFR) according to the present invention comprises the following steps:
[0016](1) measuring peak intensities of 5a-androst-3-en-17-one (AS), glycocholic acid (GC), sphingosine (SG), tryptophan (TR) and histidine (HT) by using LC / MS analysis from urine samples of patients;
[0017](2) obtaining each normalized metabolite intensities from the peak intensities by performing log2 normalization using quantile normalization algorithm;

Problems solved by technology

One of the challenges in nephrology today is the limited set of established clinical diagnostic markers that lack sufficient specificity and sensitivity and detect a disease process at a stage when the injury cannot be fully reversed (1).
Even estimated GFR using serum creatinine, widely considered the prime putative surrogate endpoint in kidney transplant recipients, has the main limitation that it measures only one aspect of kidney function and does not have high specificity and sensitivity (2-4).
Further, if kidney function is not affected, creatinine monitoring will not detect the damage to a graft (5).
However, blood urea nitrogen (BUN) and creatinine will not be raised above the normal range until 60% of total kidney function is lost.
However, the inulin clearance slightly overestimates the glomerular function.
Incomplete urine collection is an important source of error in inulin clearance measurement.
However, creatinine estimates of GFR have their limitations.
A common mistake made when just looking at serum creatinine is the failure to account for muscle mass.
Previous metabolomics studies have focused on identifying single individual metabolic biomarkers of a damaged graft, but these metabolites are not specific to monitoring kidney function during transplantation (15-17) and are not yet fully elucidated for their ability to confirm quantitative changes in metabolic profiles associated with kidney function over time.

Method used


Image

  • Prediction method of glomerular filtration rate from urine samples after kidney transplantation
  • Prediction method of glomerular filtration rate from urine samples after kidney transplantation
  • Prediction method of glomerular filtration rate from urine samples after kidney transplantation

Examples


example 1

Patient Characteristics

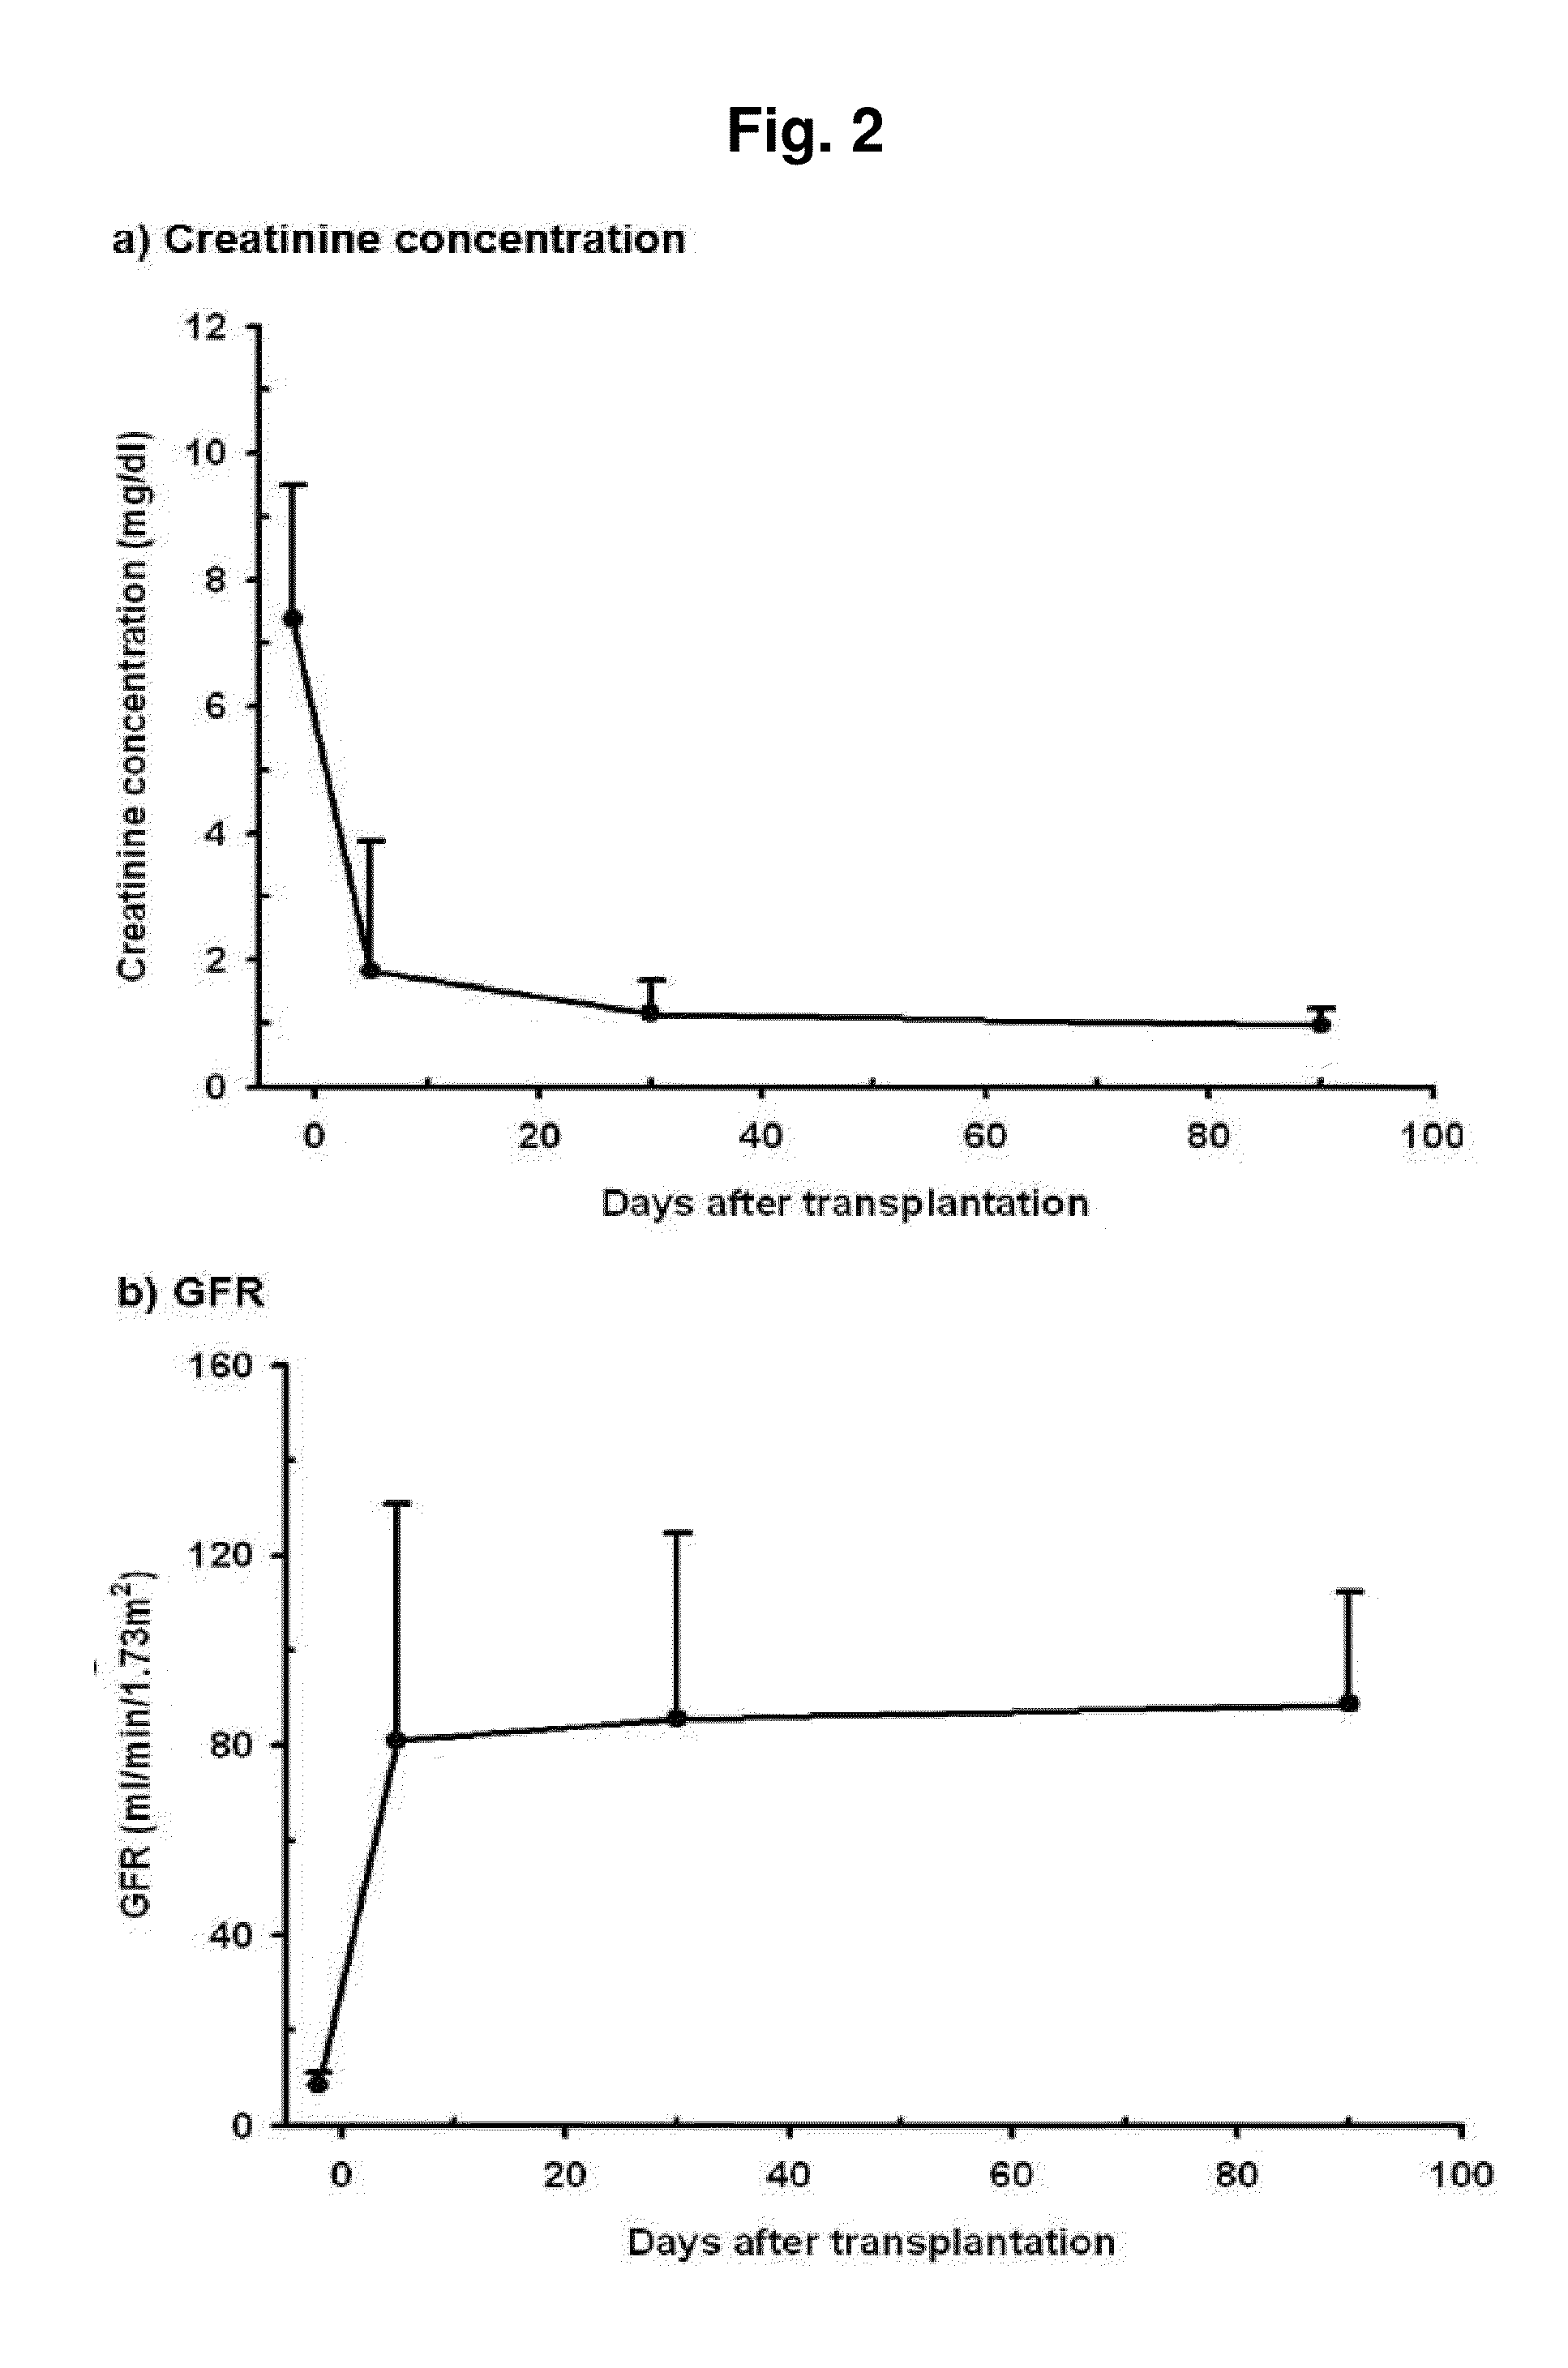
[0075]Twelve patients with a mean age of 42±10.4 years were enrolled and followed up until 90 days after transplantation. A total of 66.7% of them had chronic glomerulonephritis. No acute rejections occurred up to 90 days. The estimated GFR by creatinine level showed a sharp increase from 8.6±2.57 to 80.9±49.86 and stabilized at 88.7±23.82 ml / min / 1.73 m2 on 90 days after transplantation (FIG. 2). Because GFR describes kidney function best (31), it was selected as a response variable (Y) in the PLS analysis. There was also a significant increase in urine volume (average 1354.8±578.2 ml) on 5 days, and then a stable mean urine output of 870.0±445.98 ml was observed on 90 days after transplantation (data not shown).

example 2

Urinary Metabolic Profiling Pre- and Post-Kidney Transplantation

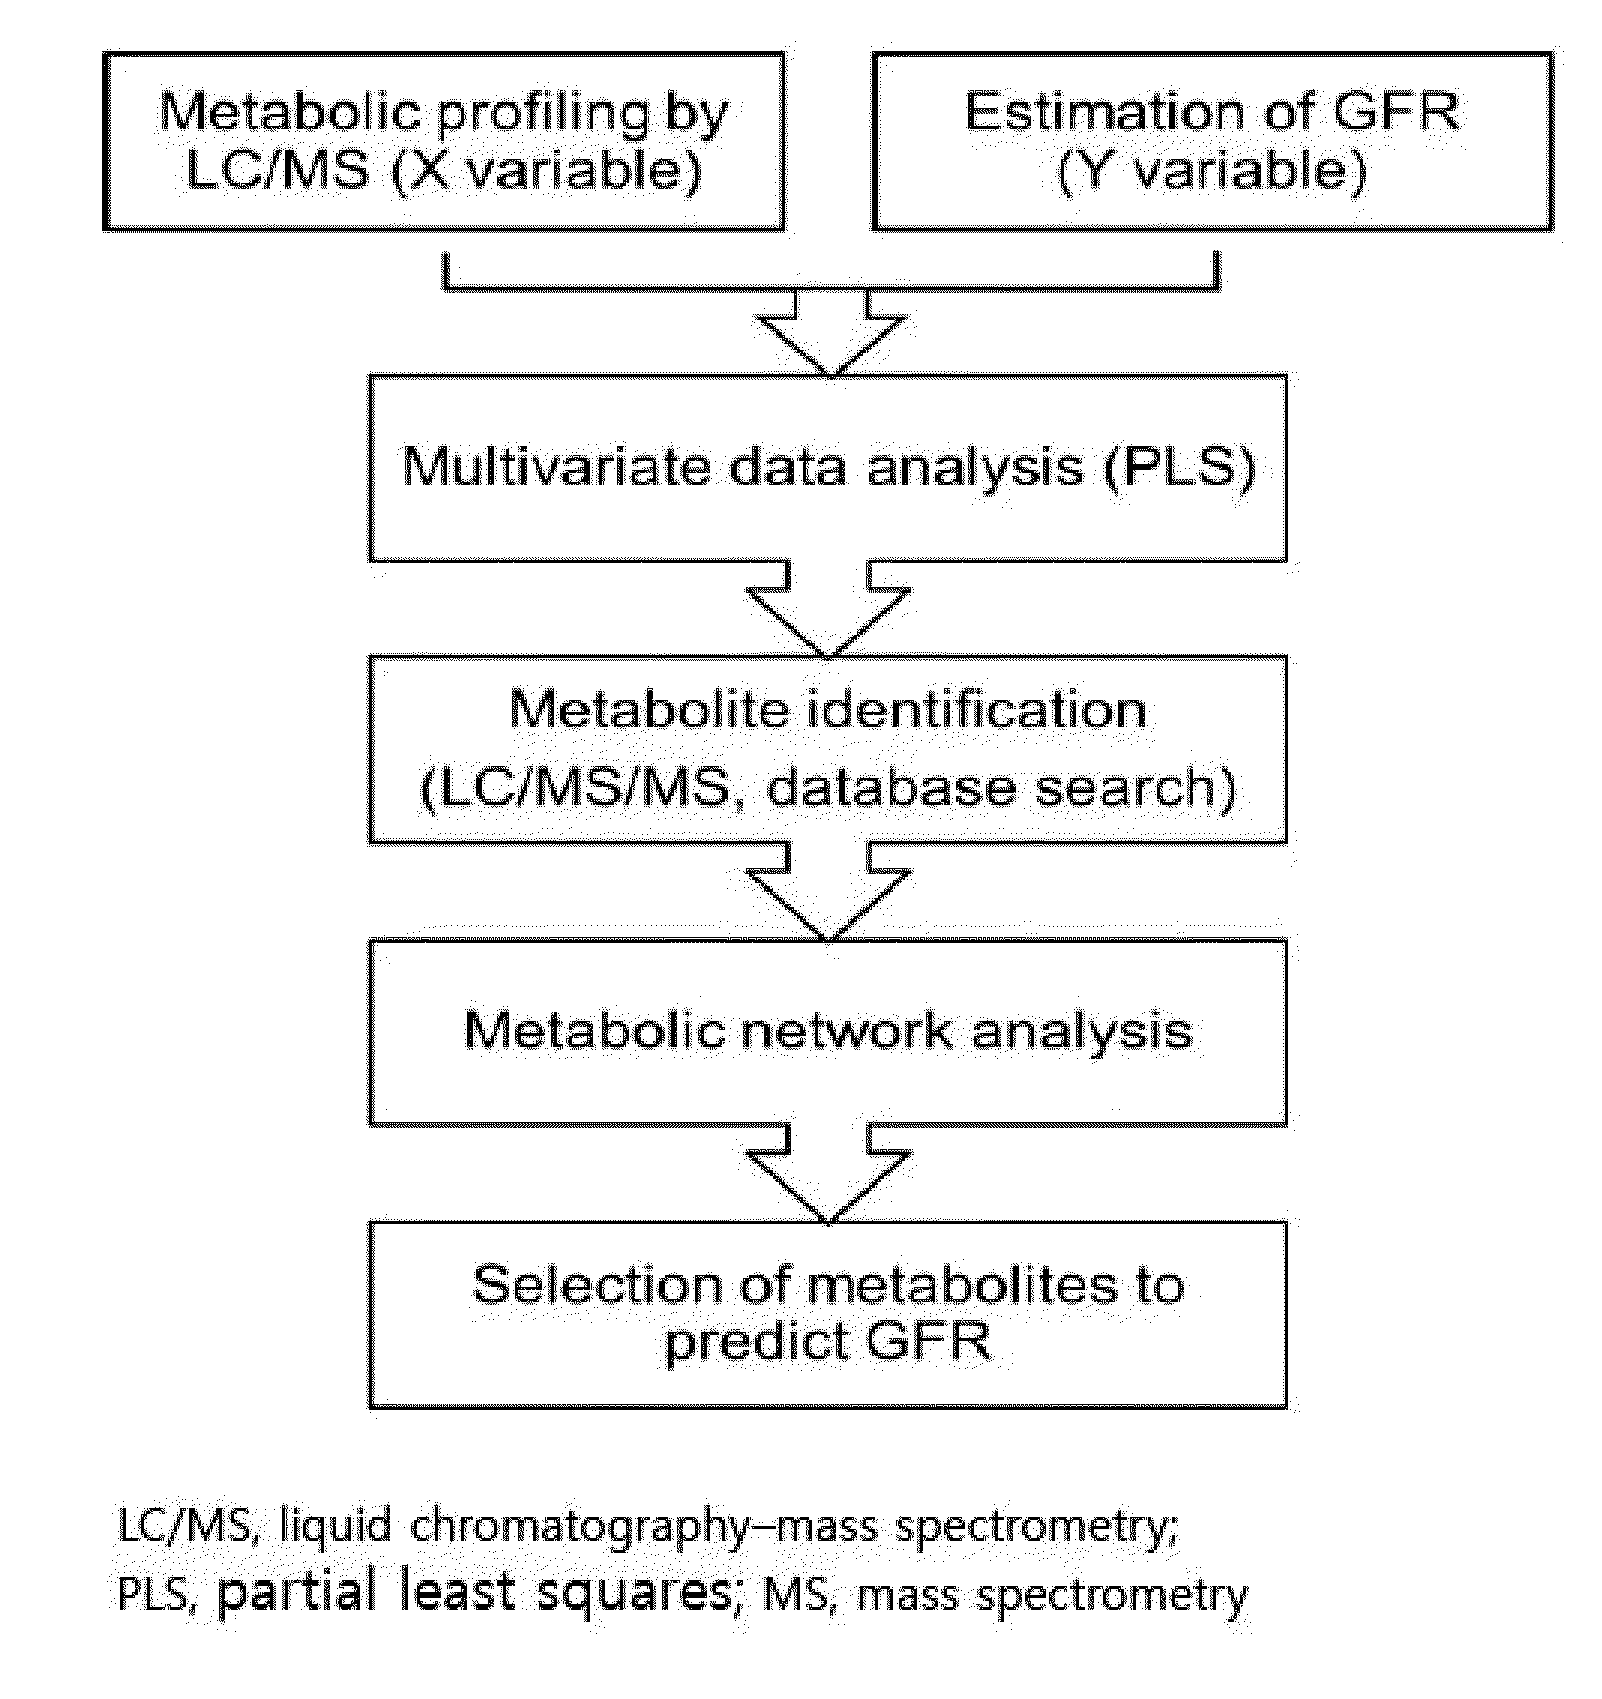
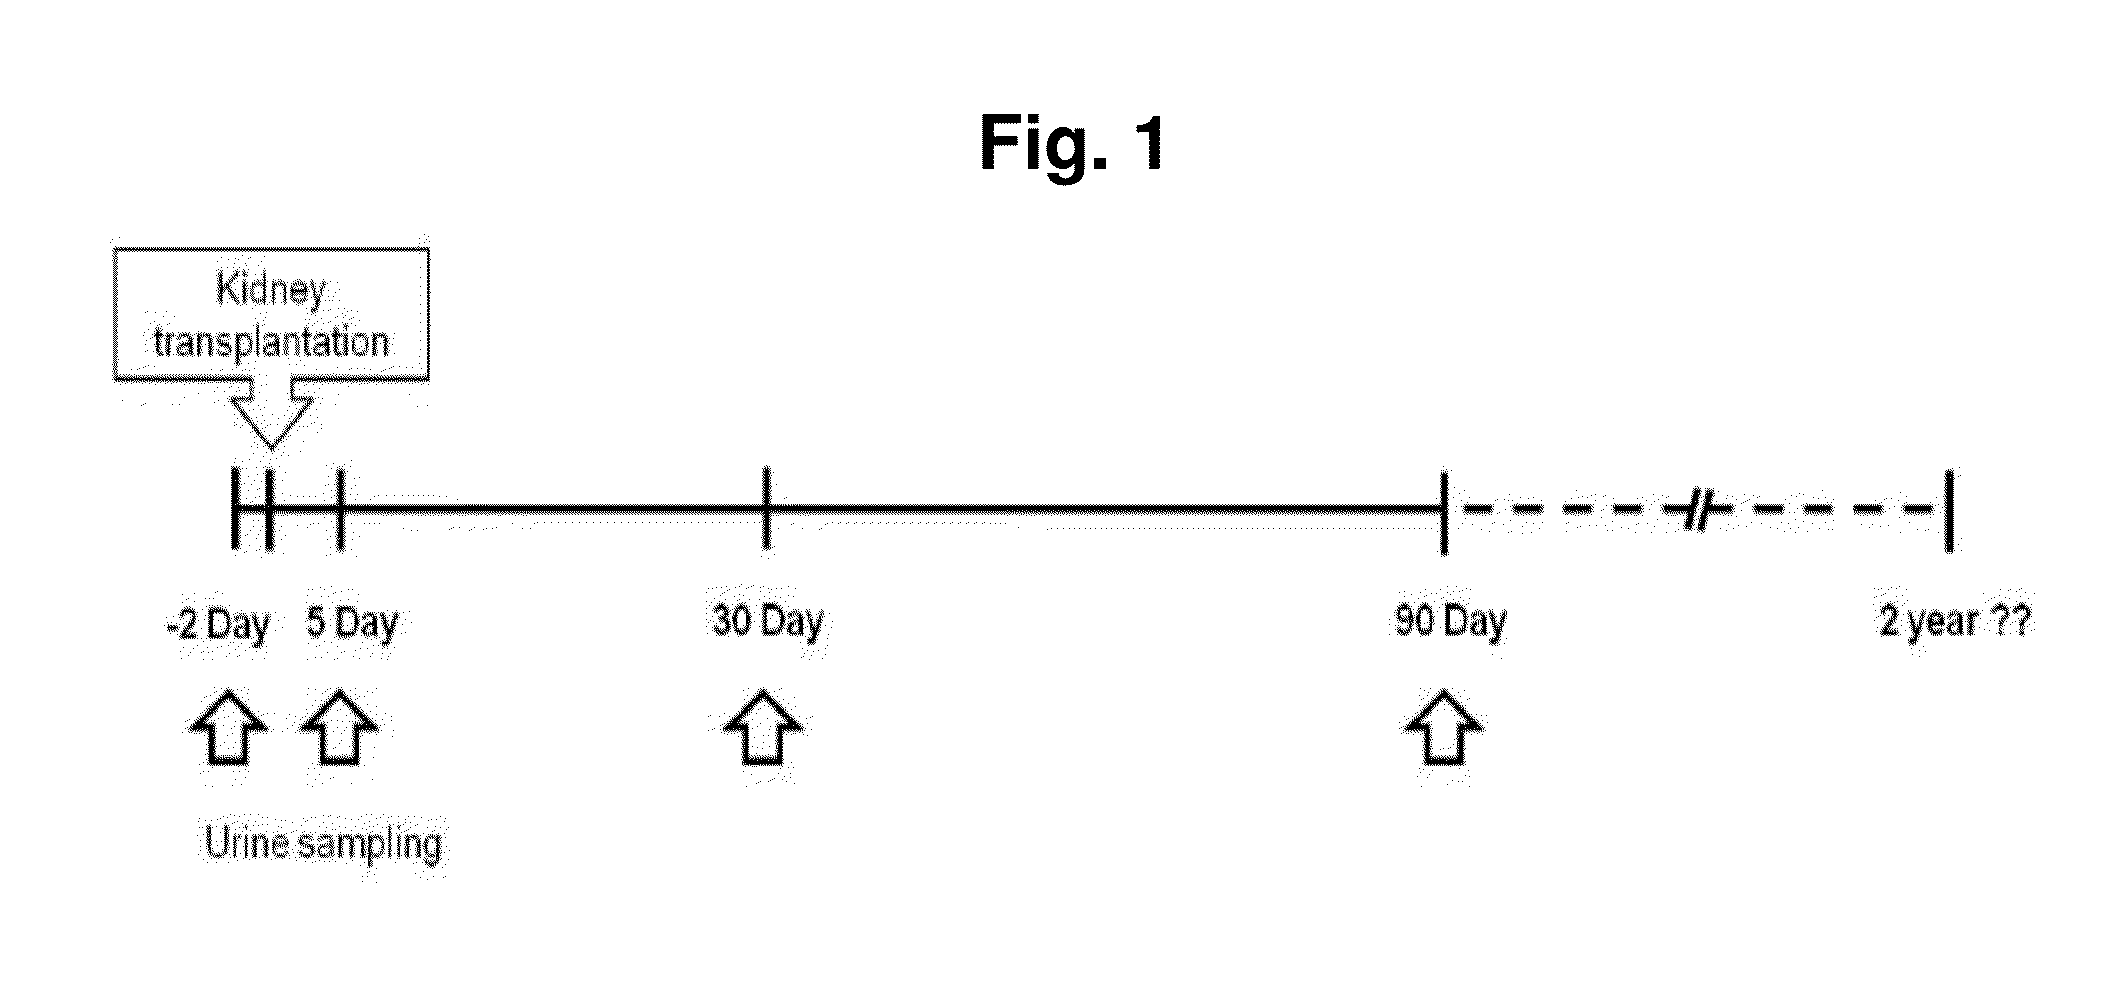
[0076]We obtained global metabolic profiles of urine samples that were collected pre and post-transplantation from 12 kidney recipients (FIG. 1). Each peak-intensity represents the individual urinary metabolomes. And chromatograms of urinary metabolic profiling showed significant differences in peaks depending on the treatment time even after exclusion of background and exogenous (drug) peaks (data not shown). After exclusion of peaks corresponding to drugs and drug metabolites, 999 common metabolite ions (metabolite features) from endogenous metabolites with their respective intensities (peak areas) were obtained as a metabolic dataset. These intensities were used as a predictor variable (X) during subsequent multivariate data analysis. The principle component analysis (PCA) plot of quality-control values indicated that the stability and reproducibility of the LC / MS profiling analysis was confirmed that obtained metabo...

example 3

Selection of Metabolites Highly Correlated with GFR

[0077]We applied the PLS model to select potential metabolites that had the highest correlation with GFR. First, we selected two statistically significant LVs (LV1 and LV2) from PLS analysis as indicated by the high goodness of fit (R2=0.82) and high eigenvalues (15.8 and 3.83 for LVs, respectively). The plot of PLS scores from two LVs shows three groups (circled) among patient samples (FIG. 5a). The trajectory of plots indicated by the arrow reflects the significant changes in metabolic profiles, which correlated well with GFR over time. The metabolic changes between pre- and post-transplantation were obvious, but the metabolic pattern overlapped among samples that were collected on 30 and 90 days. This pattern showed that its differentiation was decreased due to the stable kidney function after kidney transplantation. This PLS model had a high predictability (Q2=0.702) and explained overall 81.9% of the total variation. LV2 explai...


PUM

PropertyMeasurementUnit
capillary temperatureaaaaaaaaaa
particle sizeaaaaaaaaaa

Abstract

Disclosed is a prediction method of glomerular filtration rate (GFR) from urine samples after kidney transplantation to provide an information needed for predict renal function after the transplantation, more particularly to a prediction method of glomerular filtration rate (GFR) from urine samples after kidney transplantation, which comprises detecting metabolic profiles of five biomarkers, 5a-androst-3-en-17-one (AS), glycocholic acid (GC), sphingosine (SG), tryptophan (TR) and histidine (HT), from urine samples of patients. Glomerular filtration rate (GFR) after kidney transplantation can be predicted more rapidly and precisely to provide an information needed for predict renal function after the transplantation by using five metabolites as biomarkers. The method provides more specific, sensitive, and reliable biomarkers that monitor clinical outcomes and adverse renal events after kidney transplantation, such as rejection, drug toxicity, delayed graft function, and infection.

Description

TECHNICAL FIELD[0001]The present invention relates to a prediction method of glomerular filtration rate (GFR) from urine samples after kidney transplantation to provide an information needed for predict renal function after the transplantation, more particularly to a prediction method of glomerular filtration rate (GFR) from urine samples after kidney transplantation, which comprises detecting metabolic profiles of five biomarkers from urine samples of patients.BACKGROUND ART[0002]One of the challenges in nephrology today is the limited set of established clinical diagnostic markers that lack sufficient specificity and sensitivity and detect a disease process at a stage when the injury cannot be fully reversed (1). Even estimated GFR using serum creatinine, widely considered the prime putative surrogate endpoint in kidney transplant recipients, has the main limitation that it measures only one aspect of kidney function and does not have high specificity and sensitivity (2-4). Furthe...

Claims


Application Information

Patent Timeline
Patent Type & Authority Applications(United States)
IPC IPC(8): G01N33/493
CPCG01N33/493G01N33/50G01N33/743G01N2570/00G01N2800/245G01N2800/347G01N30/72
Inventor KIM, YONG-LIMYOON, YOUNG-RANSEO, JUNG-JU
Owner KYUNGPOOK NAT UNIV IND ACADEMIC COOP FOUND
Why Eureka
Try Eureka