

Methods and Compositions for Diagnosis of Inflammatory Liver Disease
a technology composition, which is applied in the field of methods and compositions for diagnosis of inflammatory liver disease, can solve the problems of inability to distinguish infectious hepatitis from aih or pbc from psc, the level of ap may not consistently stay elevated in a large proportion of patients, and the individual values of each biomarker are not able to distinguish infectious hepatitis from aih or pbc from
- Summary
- Abstract
- Description
- Claims
- Application Information
AI Technical Summary
Benefits of technology
Problems solved by technology
Method used
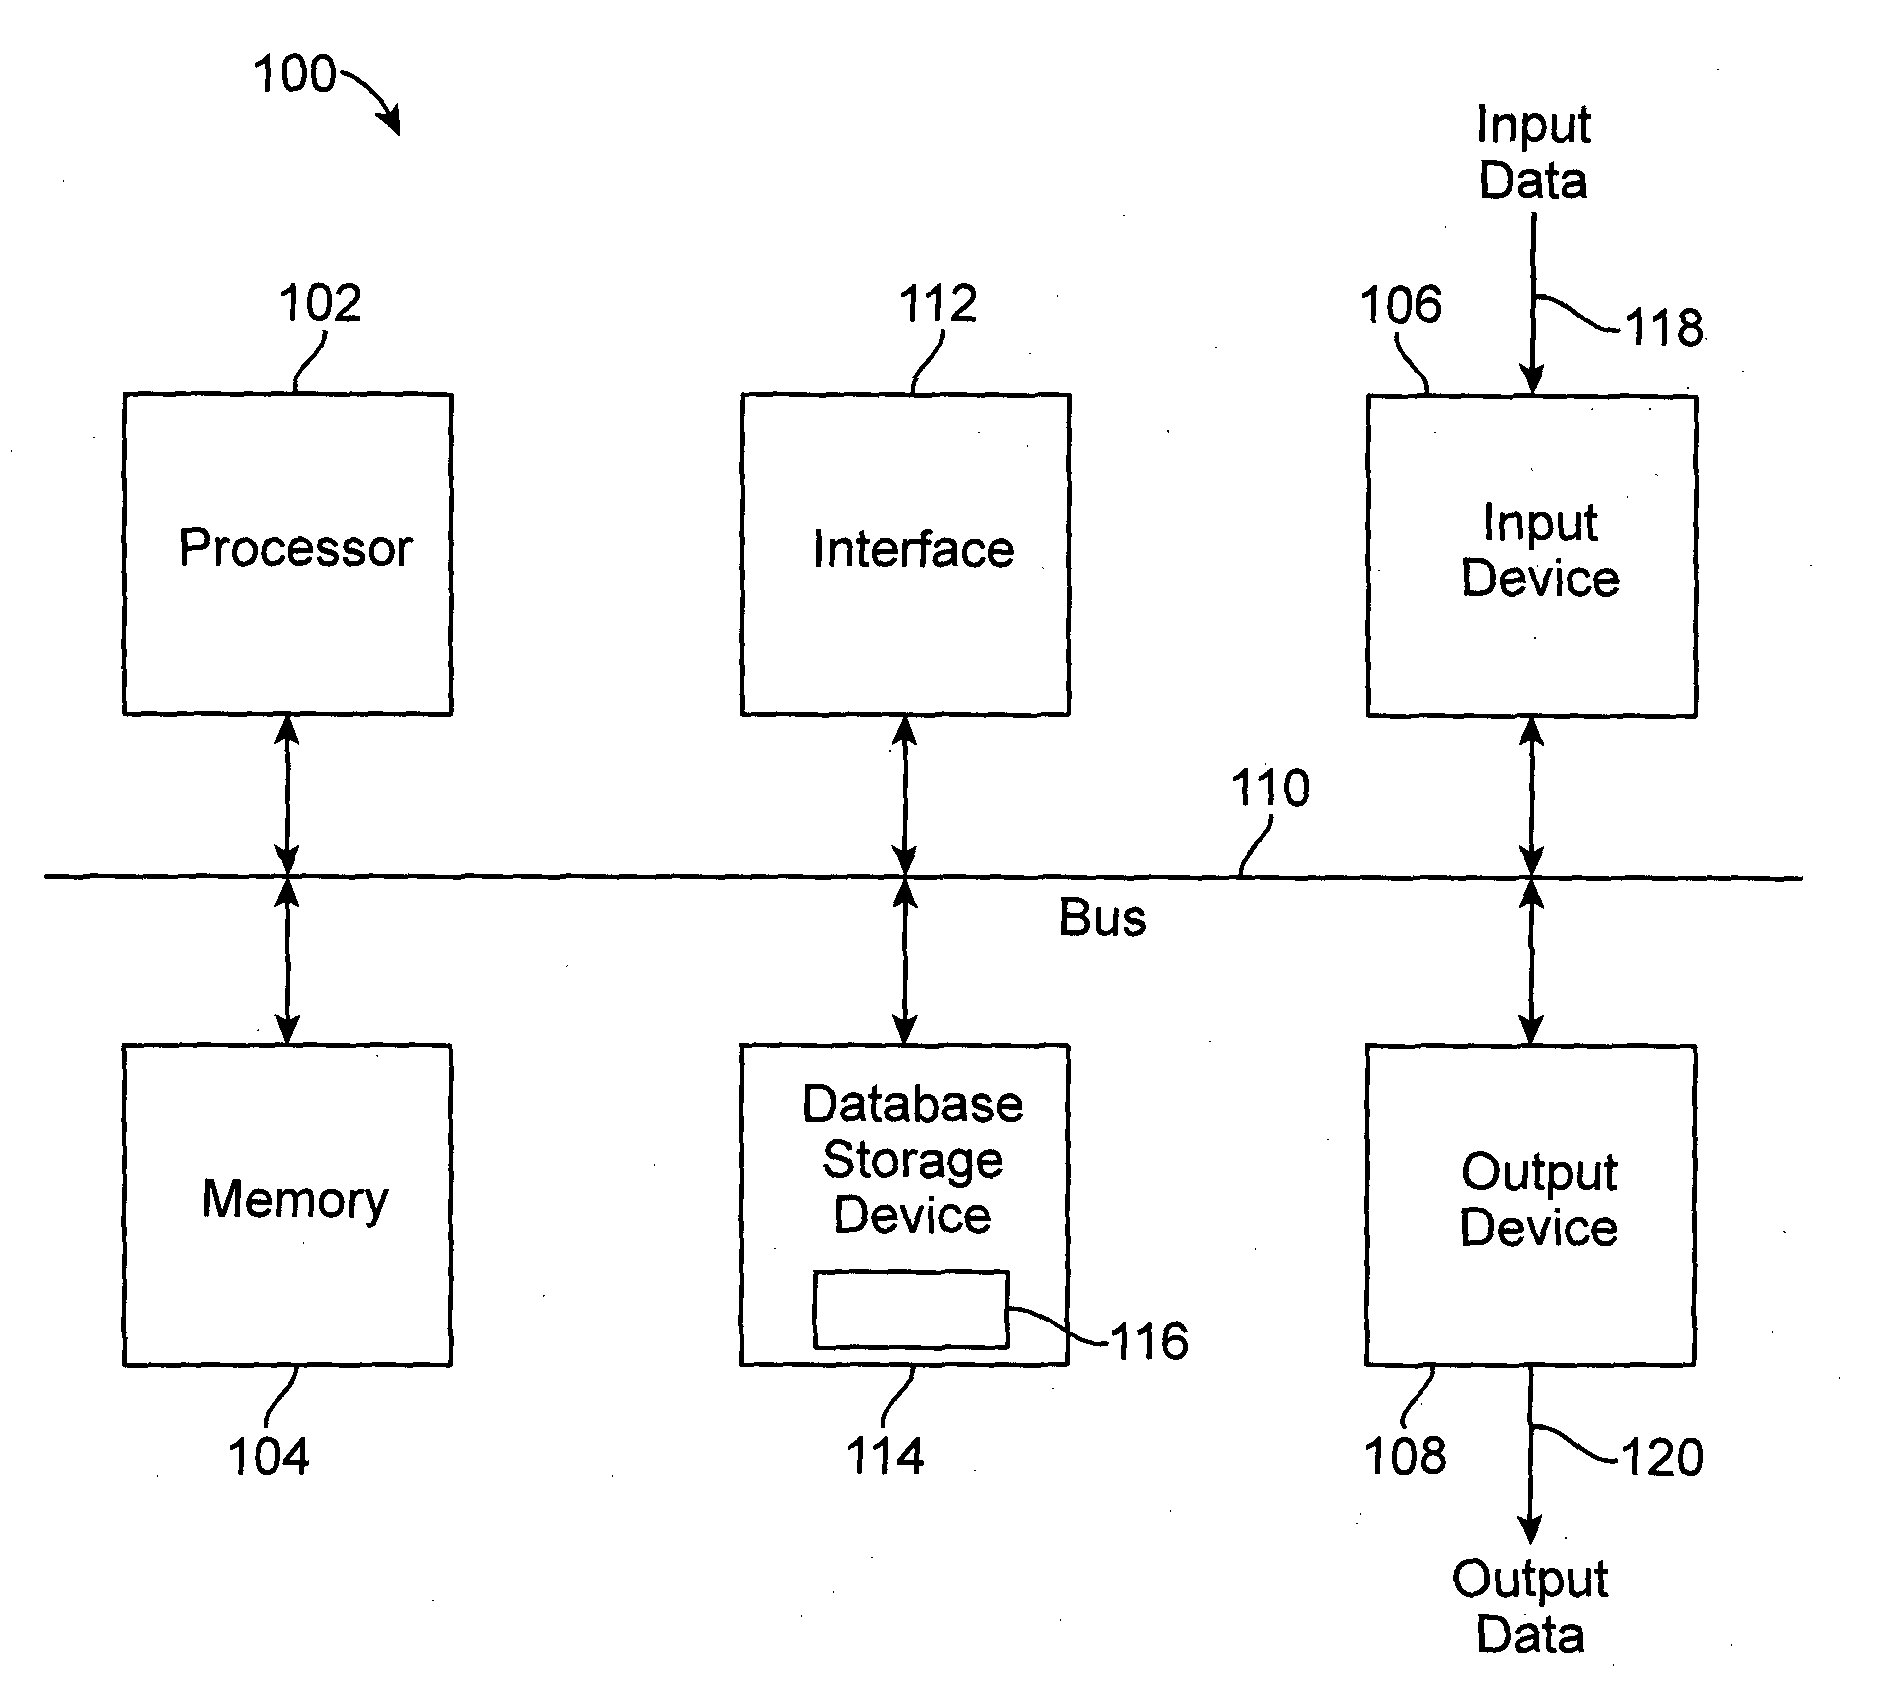
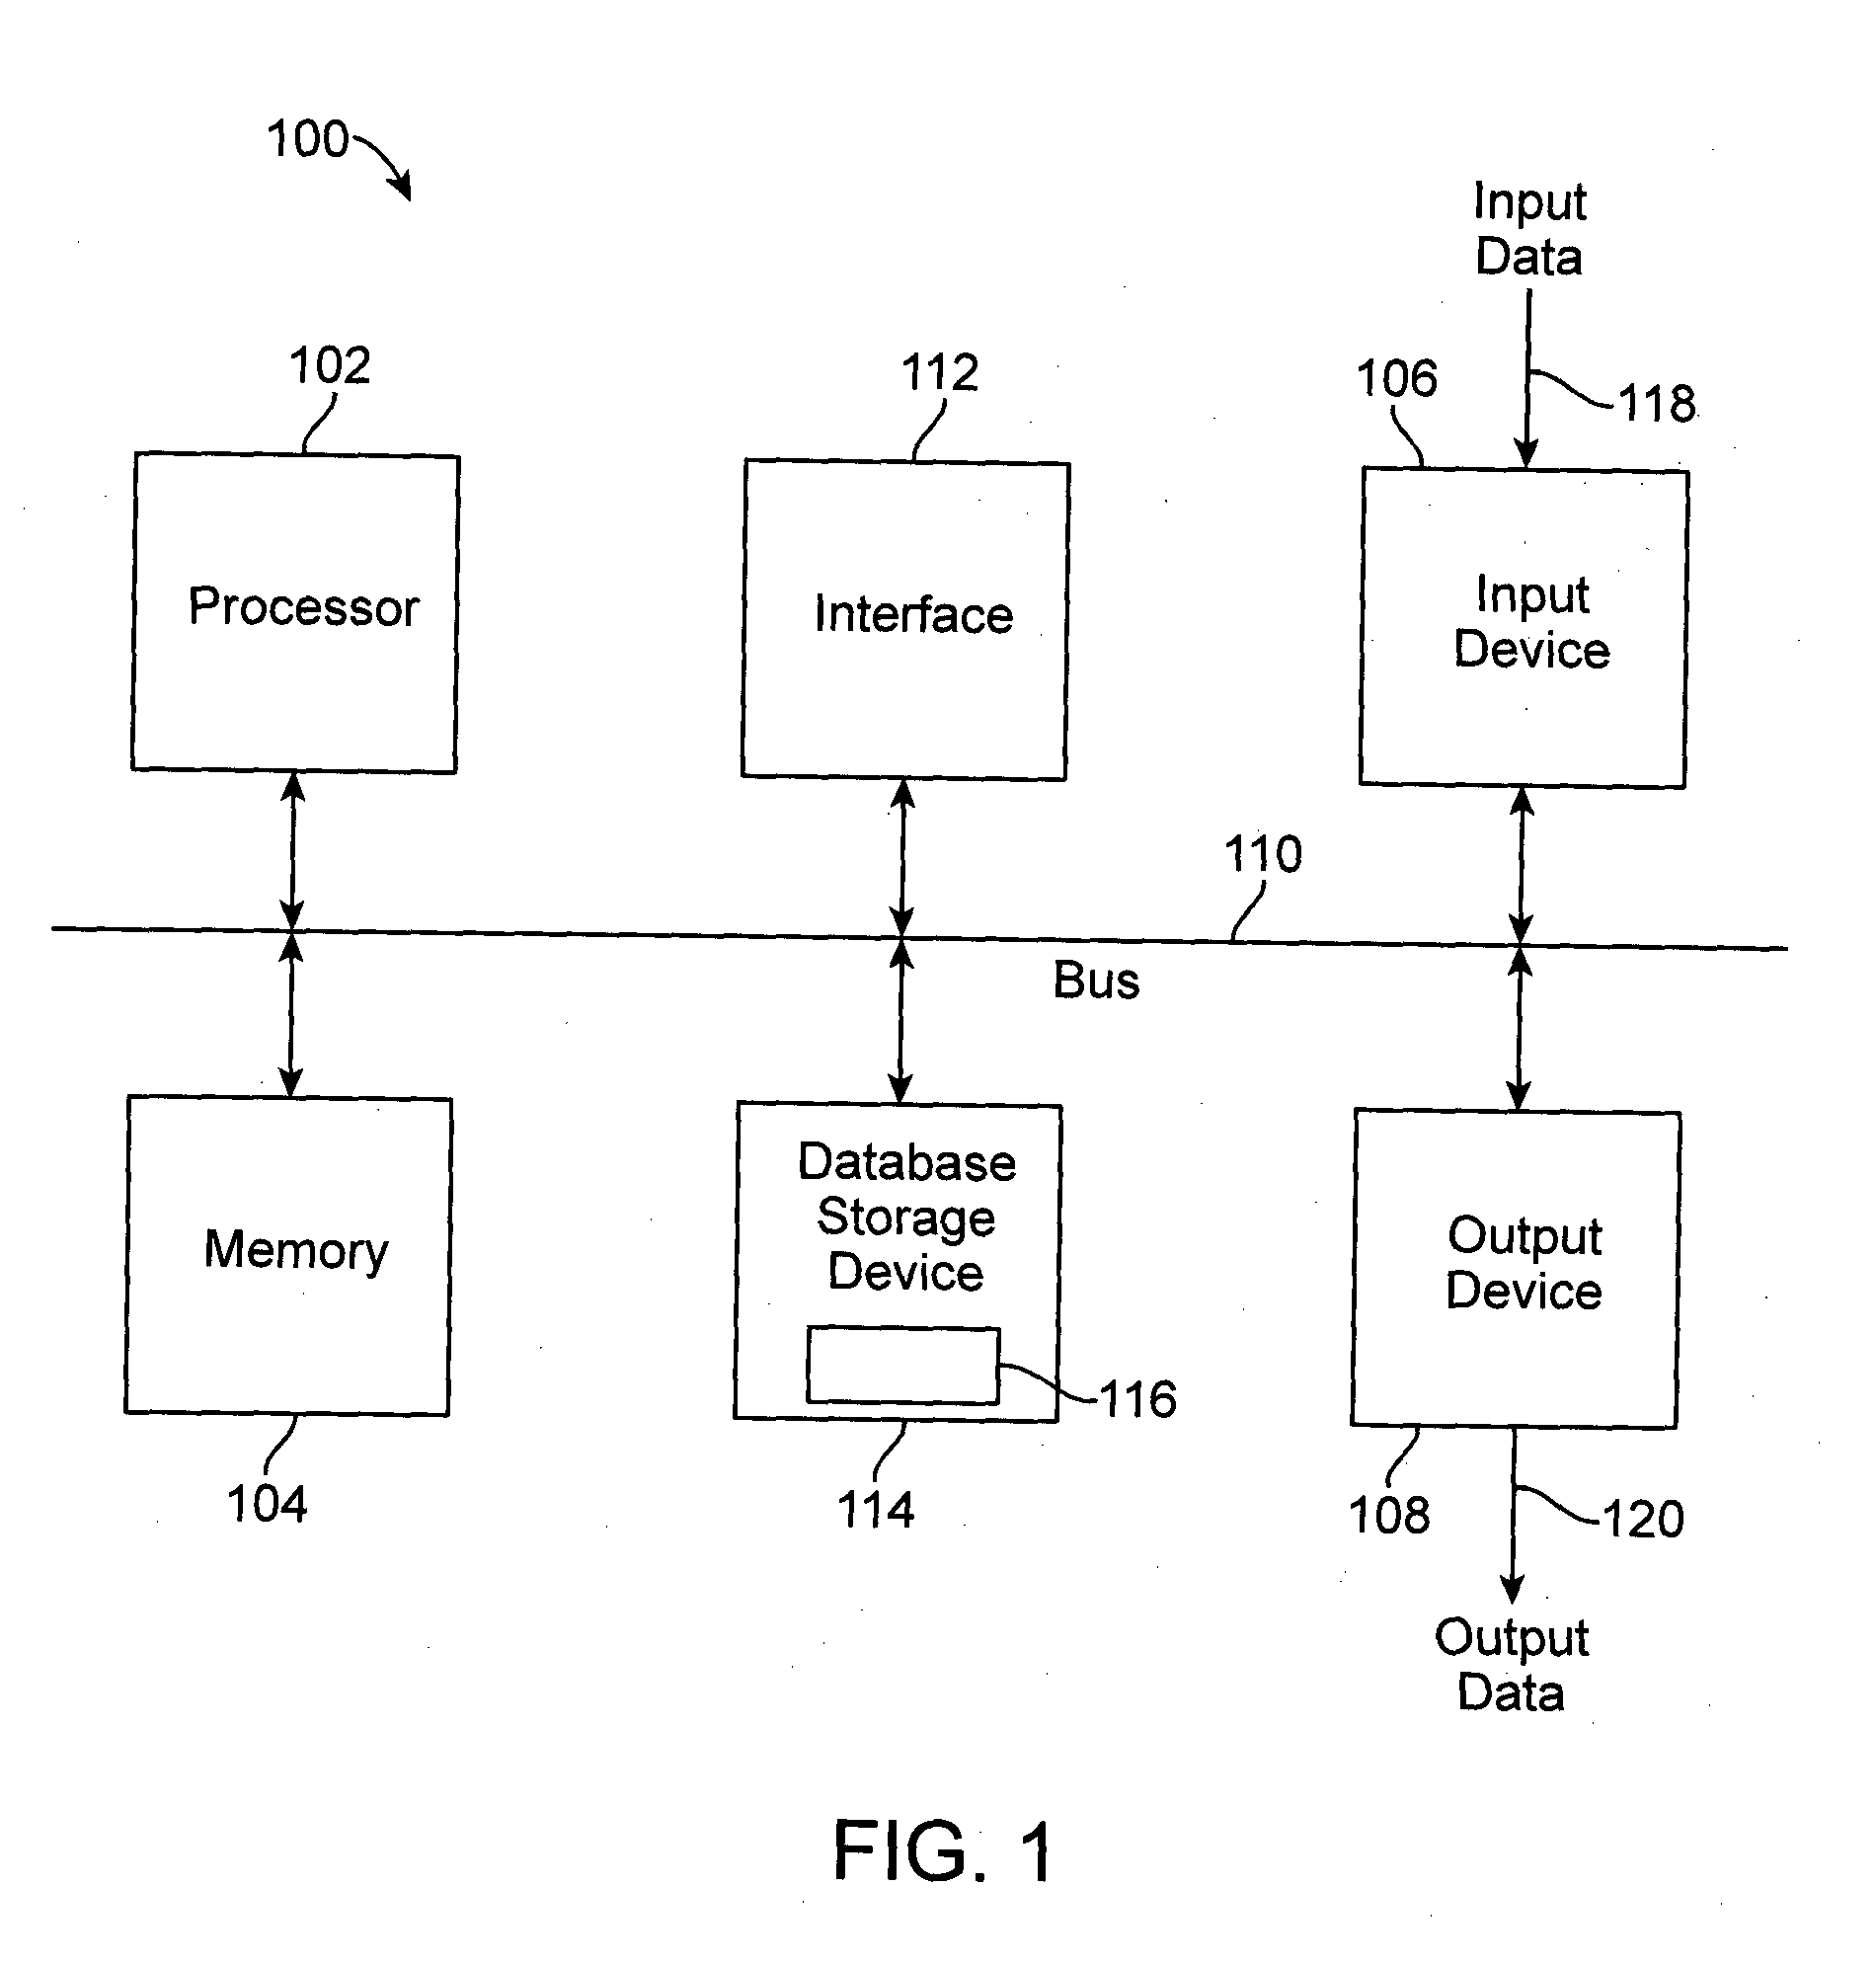
Image

Examples
example 1
Analysis of Cytokines / Chemokines
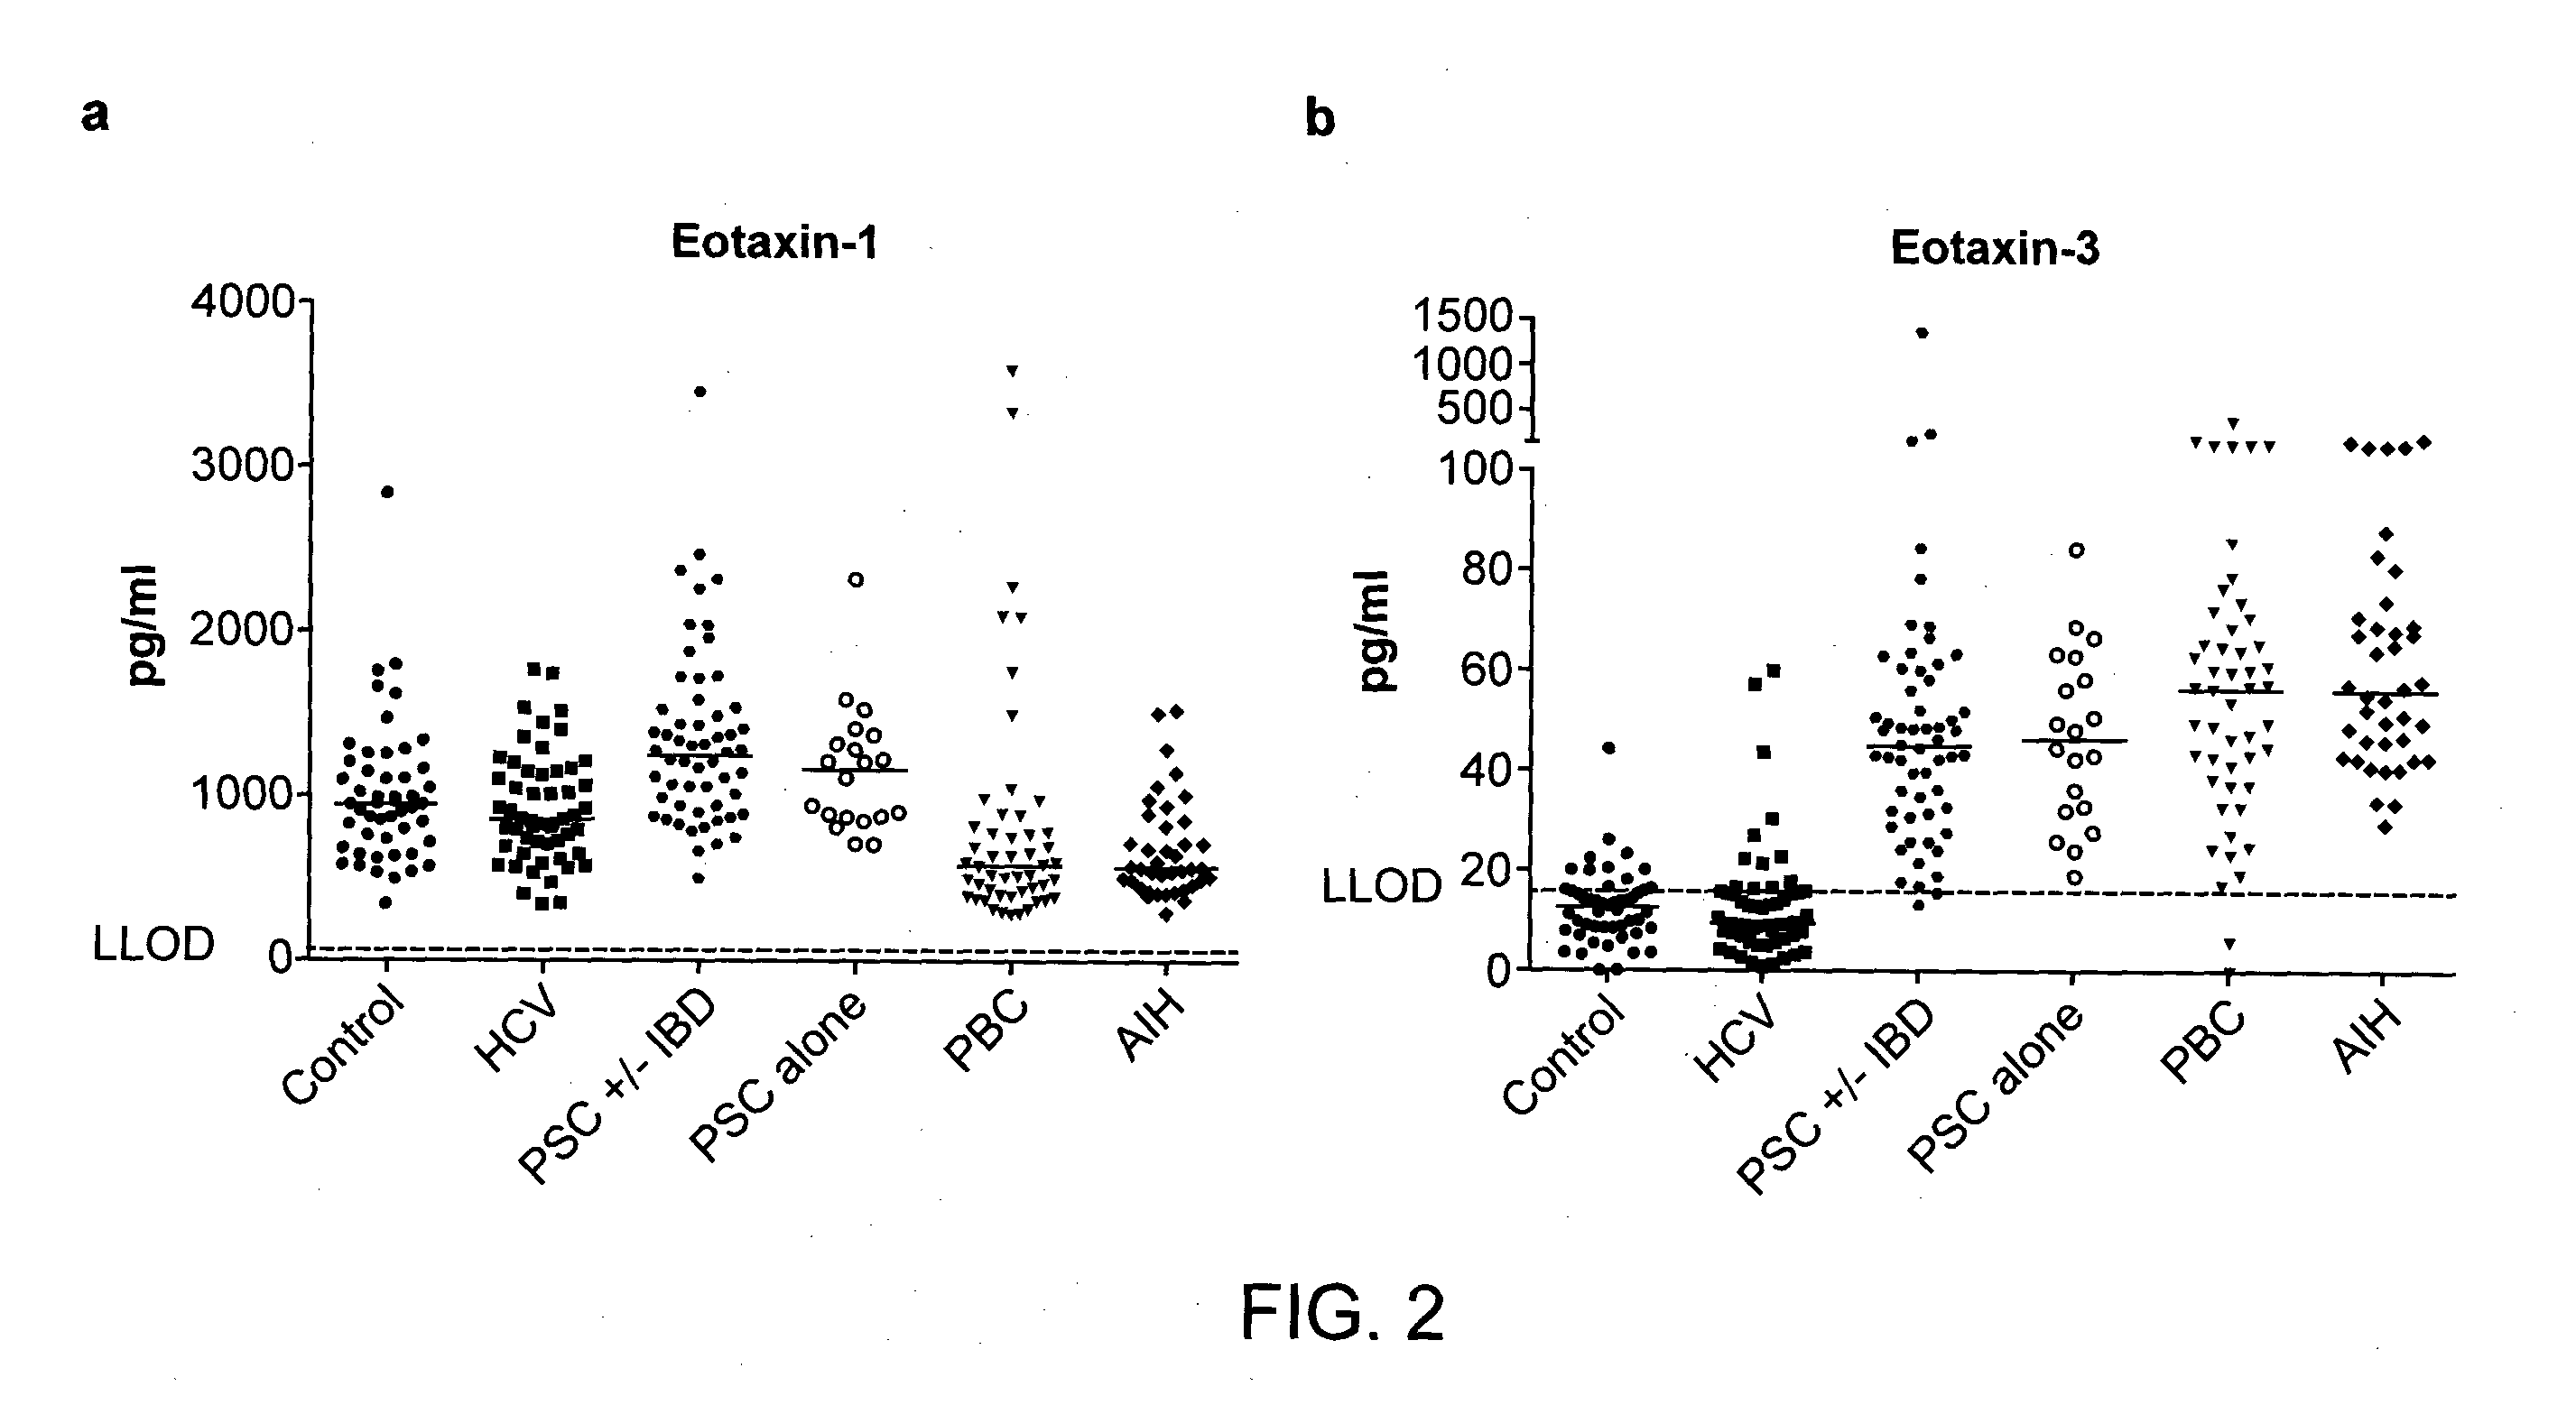
[0285]Sera samples were collected from healthy individuals and from patients diagnosed with HCV, AIH, PBC, or PSC and evaluated for the level of cytokines / chemokines.
[0286]The number of patients in each group included 50 healthy controls, 54 HCV-infected patients, 80 PSC patients (which included 20 patients having PSC only, 22 patients with PSC and ulcerative colitis (UC) 16 patients with PSC and CD (Crohn's disease), 13 patients with PSC+AIH, and 9 patients with PSC, UC, and AIH), 50 patients with PBC and 40 patients with AIH. Diagnosis for HCV was based on serology and PCR. Diagnosis of PSC, UC, CD, and AIH were made by clinical examination and paraclinical testing that could include testing for AMA for PBC and other autoantibodies for AIH, as well as ERC / MRC for PSC, and, in some instance, liver pathology. All HCV patients were chronic HCV patients that were either not responders to treatment or not candidates for treatment. Since PSC is accompanie...
example 2
Analysis of E3, E1, MDC and IL-15 Serum Levels
[0291]The data obtained from Example 1 were subjected to statistical analysis. Different threshold values were selected so as to discriminate between selected conditions (e.g., between a control (e.g., healthy or HCV-infected) and a liver disease of at least AIH, PBC and / or PSC).
[0292]FIGS. 3-8 provide tables summarizing the results of this analysis. The percentage values indicate the percentage of individuals of the group in that row that met the criteria set out at the top of the column. The values in the columns adjacent and to the left of the percentage values provide the numbers of individuals in each group that were positive (top value) of the total tested (bottom value). “Ctrl / HCV” indicates patients in the healthy control and HCV-infected groups were combined. “PSC, PBC or AIH” refers to a combination of all patients with AIH, PBC, and PSC. “PSC+ / −IBD+ / −AIH” included PSC patients whether having PSC alone, PSC with or without IBD,...
example 3
Roc Curve Analyses
[0306]The data obtained from Example 1 were subjected to analysis using Prism (GraphPad Prism Version 5.00, Prism Software Corporation, Irvine, Calif., USA) to generate a receiver-operator curve (ROC). ROC curves are a standard way of illustrating the relationship between sensitivity and specificity for a specific test, thus providing guidance as to values for desired sensitivity and specificity, e.g., when comparing values from normal and abnormal. Prism was used to generate ROC curves for sensitivity and specificity of each of the E3, E1, MDC, and IL-15 at various cut-offs for HCV, PSC, PBC, and AIH against healthy control (left columns for each of FIGS. 9-13) as well as PSC, PBC, and AIH against HCV (right columns for each of FIGS. 9-13). Prism automatically calculates many pairs of sensitivity and specificity using each value in the data table as the cut-off value. The confidence interval for each possible cut-off in our calculation is 95%.
[0307]The area under ...
PUM
 Abstract
Description
Claims
Application Information