

Honeycomb structure
- Summary
- Abstract
- Description
- Claims
- Application Information
AI Technical Summary
Benefits of technology
Problems solved by technology
Method used
Image

Examples
first embodiment
(1) Honeycomb Structure (First Embodiment)
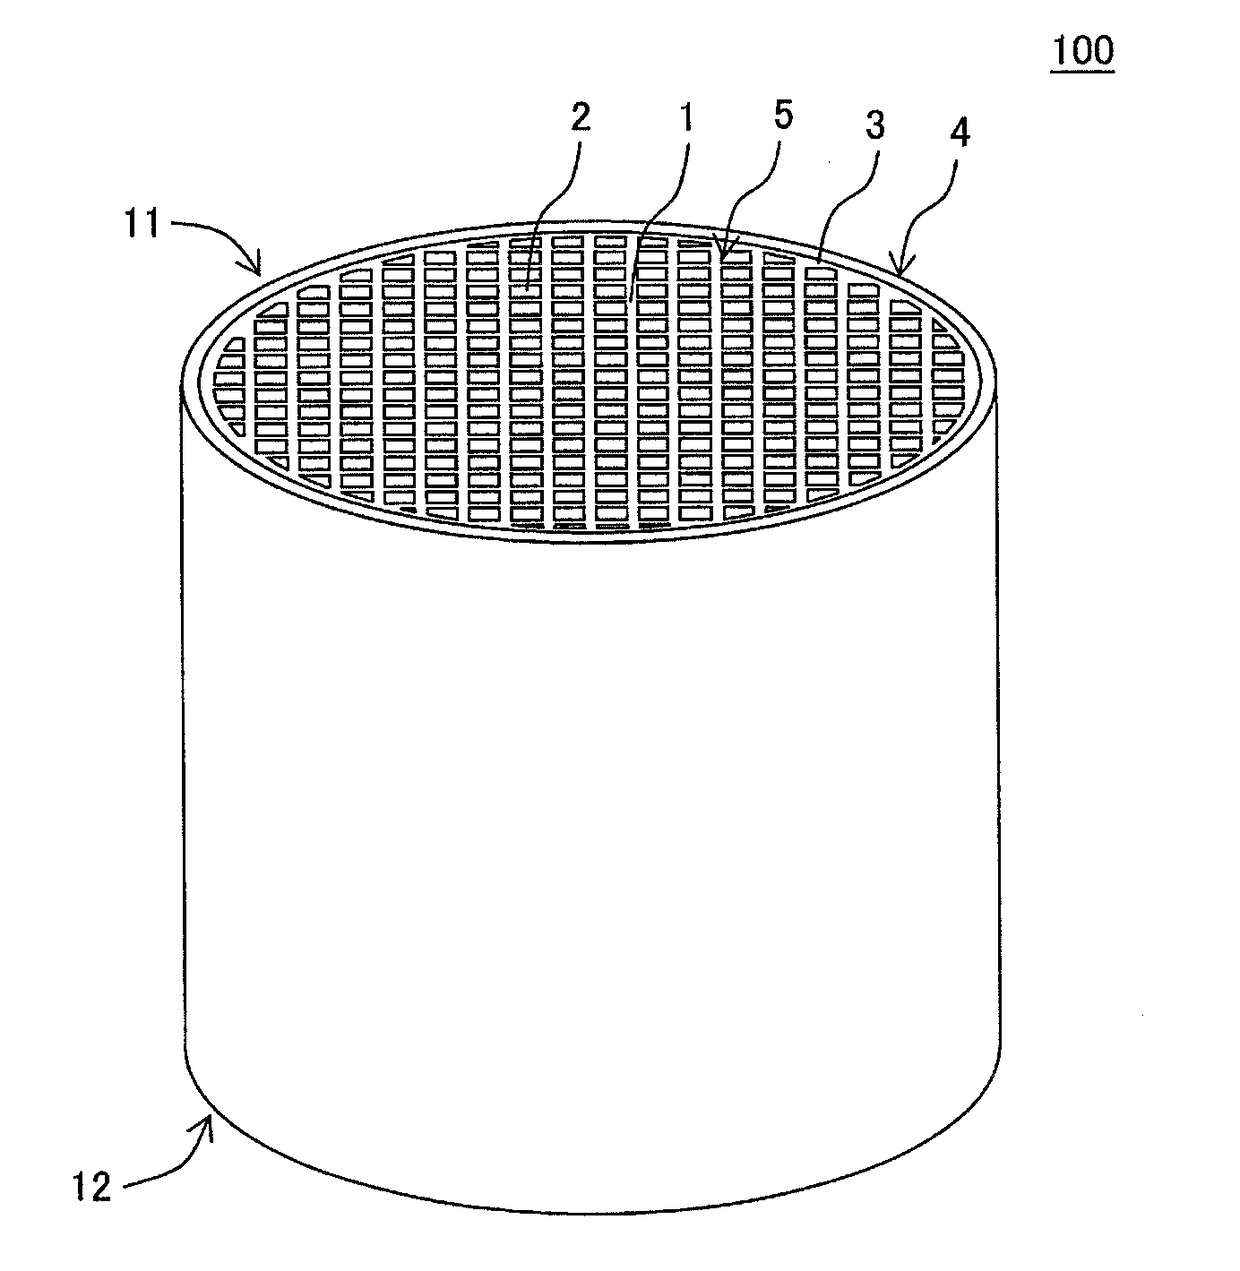
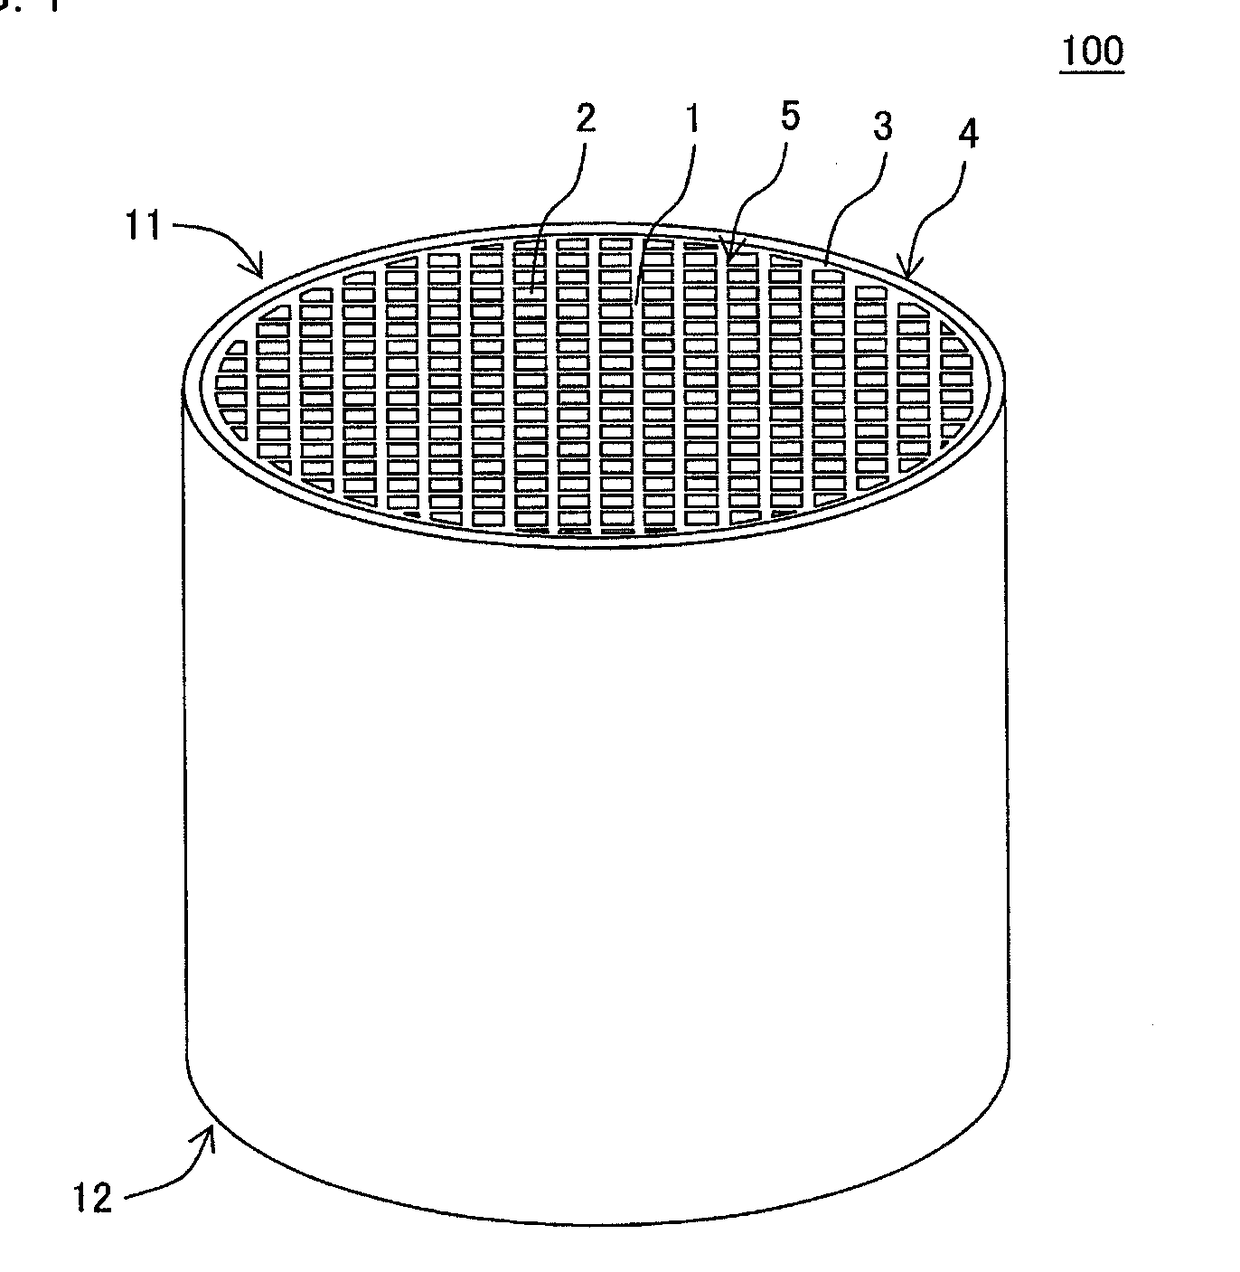
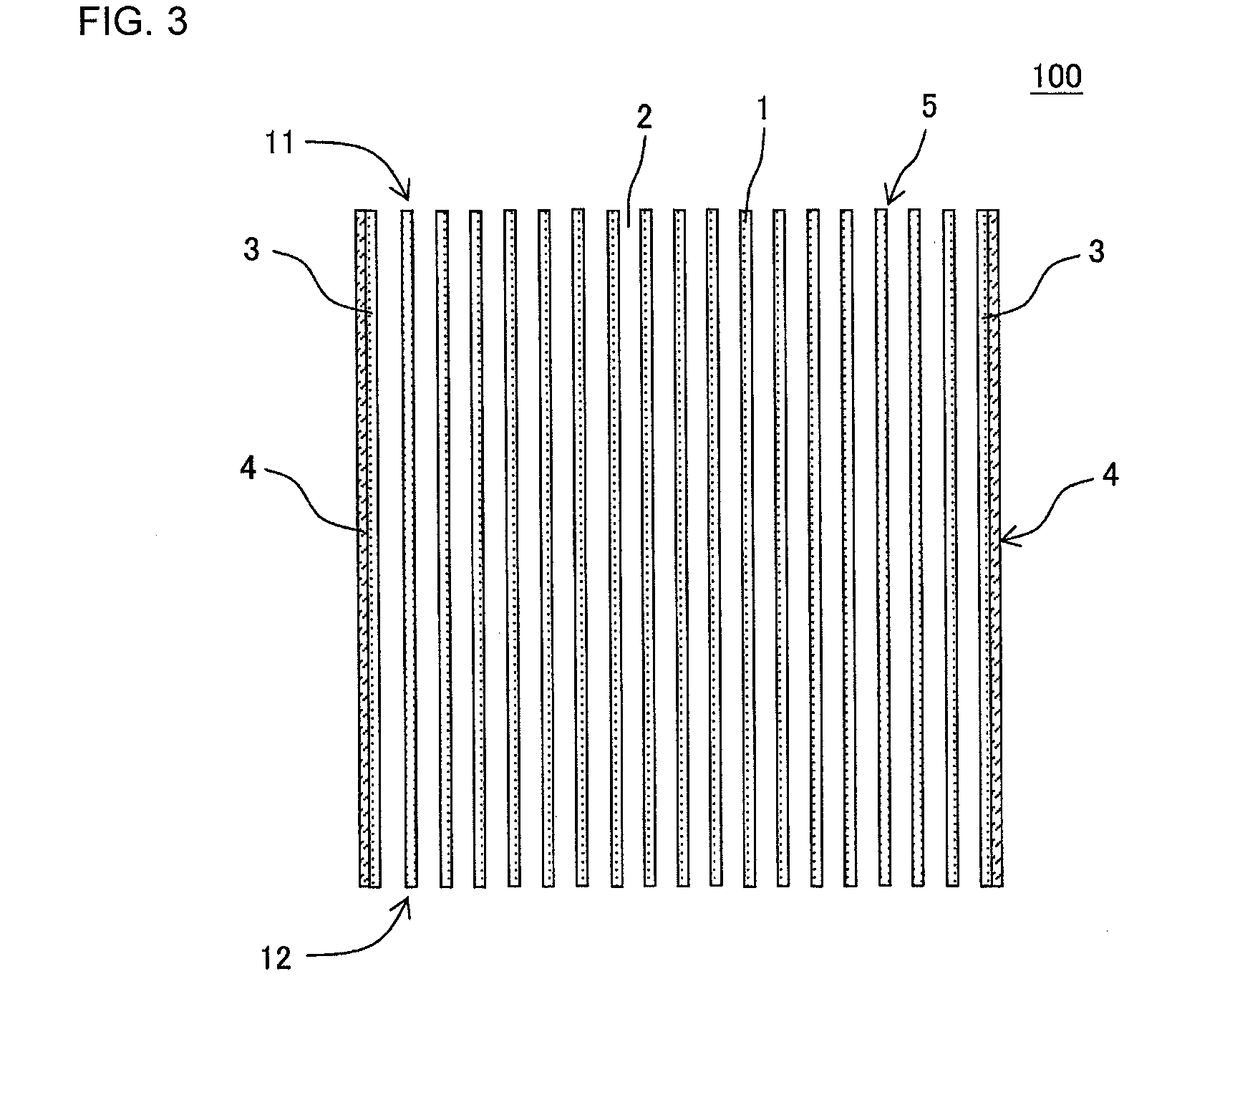
[0031]A first embodiment of a honeycomb structure of the present invention is such a honeycomb structure 100 as shown in FIG. 1 to FIG. 4. The honeycomb structure 100 further includes a second circumferential wall 4 on an outer side of a honeycomb structure body 5. The honeycomb structure body 5 has porous partition walls 1 and a first circumferential wall 3. The honeycomb structure body 5 does not have an interface between the partition walls 1 and the first circumferential wall 3. That is, it can be considered that the honeycomb structure body 5 is a structure in which the partition walls 1 are continuous with the first circumferential wall 3. The partition walls 1 of the honeycomb structure body 5 define a plurality of cells 2 extending from an inflow end face 11 to an outflow end face 12 to form through channels for a fluid. The first circumferential wall 3 is disposed to surround at least a part of a circumference of the partition walls...
second embodiment
(2) Honeycomb Structure (Second Embodiment)
[0052]Next, description will be made as to a second embodiment of the honeycomb structure of the present invention. It is preferable that the honeycomb structure of the second embodiment is constituted similarly to the hitherto described honeycomb structure of the first embodiment, except that a shape of the surface of a first circumferential wall is an uneven face having unevenness. Here, FIG. 5 is a plan view schematically showing an inflow end face of the second embodiment of the honeycomb structure of the present invention. FIG. 6 is an enlarged plan view showing enlarged parts of the first circumferential wall and a second circumferential wall of the honeycomb structure shown in FIG. 5.
[0053]As shown in FIG. 5 and FIG. 6, a honeycomb structure 200 of the present embodiment includes a honeycomb structure body 25 and a second circumferential wall 24. The honeycomb structure body 25 has porous partition walls 21, and a first circumferenti...
example 1
[0068]To 100 parts by mass of cordierite forming raw material, 35 parts by mass of dispersing medium, 6 parts by mass of organic binder and 0.5 parts by mass of dispersing agent were added, mixed and kneaded to prepare a kneaded material for extrusion. As the cordierite forming raw material, alumina, aluminum hydroxide, kaolin, talc and silica were used. Water was used as the dispersing medium, cokes having an average particle diameter of 1 to 10 μm were used as a pore former, hydroxypropyl methylcellulose was used as the organic binder, and ethylene glycol was used as the dispersing agent.
[0069]Next, the kneaded material was extruded by using a honeycomb formed body preparing die, and a honeycomb formed body was obtained so that its overall shape was a round pillar shape.
[0070]Then, the honeycomb formed body was dried with a microwave drier, and further completely dried with a hot air drier. Afterward, both end faces of the honeycomb formed body were cut to adjust a dimension of th...
PUM
| Property | Measurement | Unit |
|---|---|---|
| Length | aaaaa | aaaaa |
| Length | aaaaa | aaaaa |
| Thickness | aaaaa | aaaaa |
Abstract
Description
Claims
Application Information