Method of diagnosis of adrenal insufficiency
- Summary
- Abstract
- Description
- Claims
- Application Information
AI Technical Summary
Benefits of technology
Problems solved by technology
Method used
Image
Examples
example 2
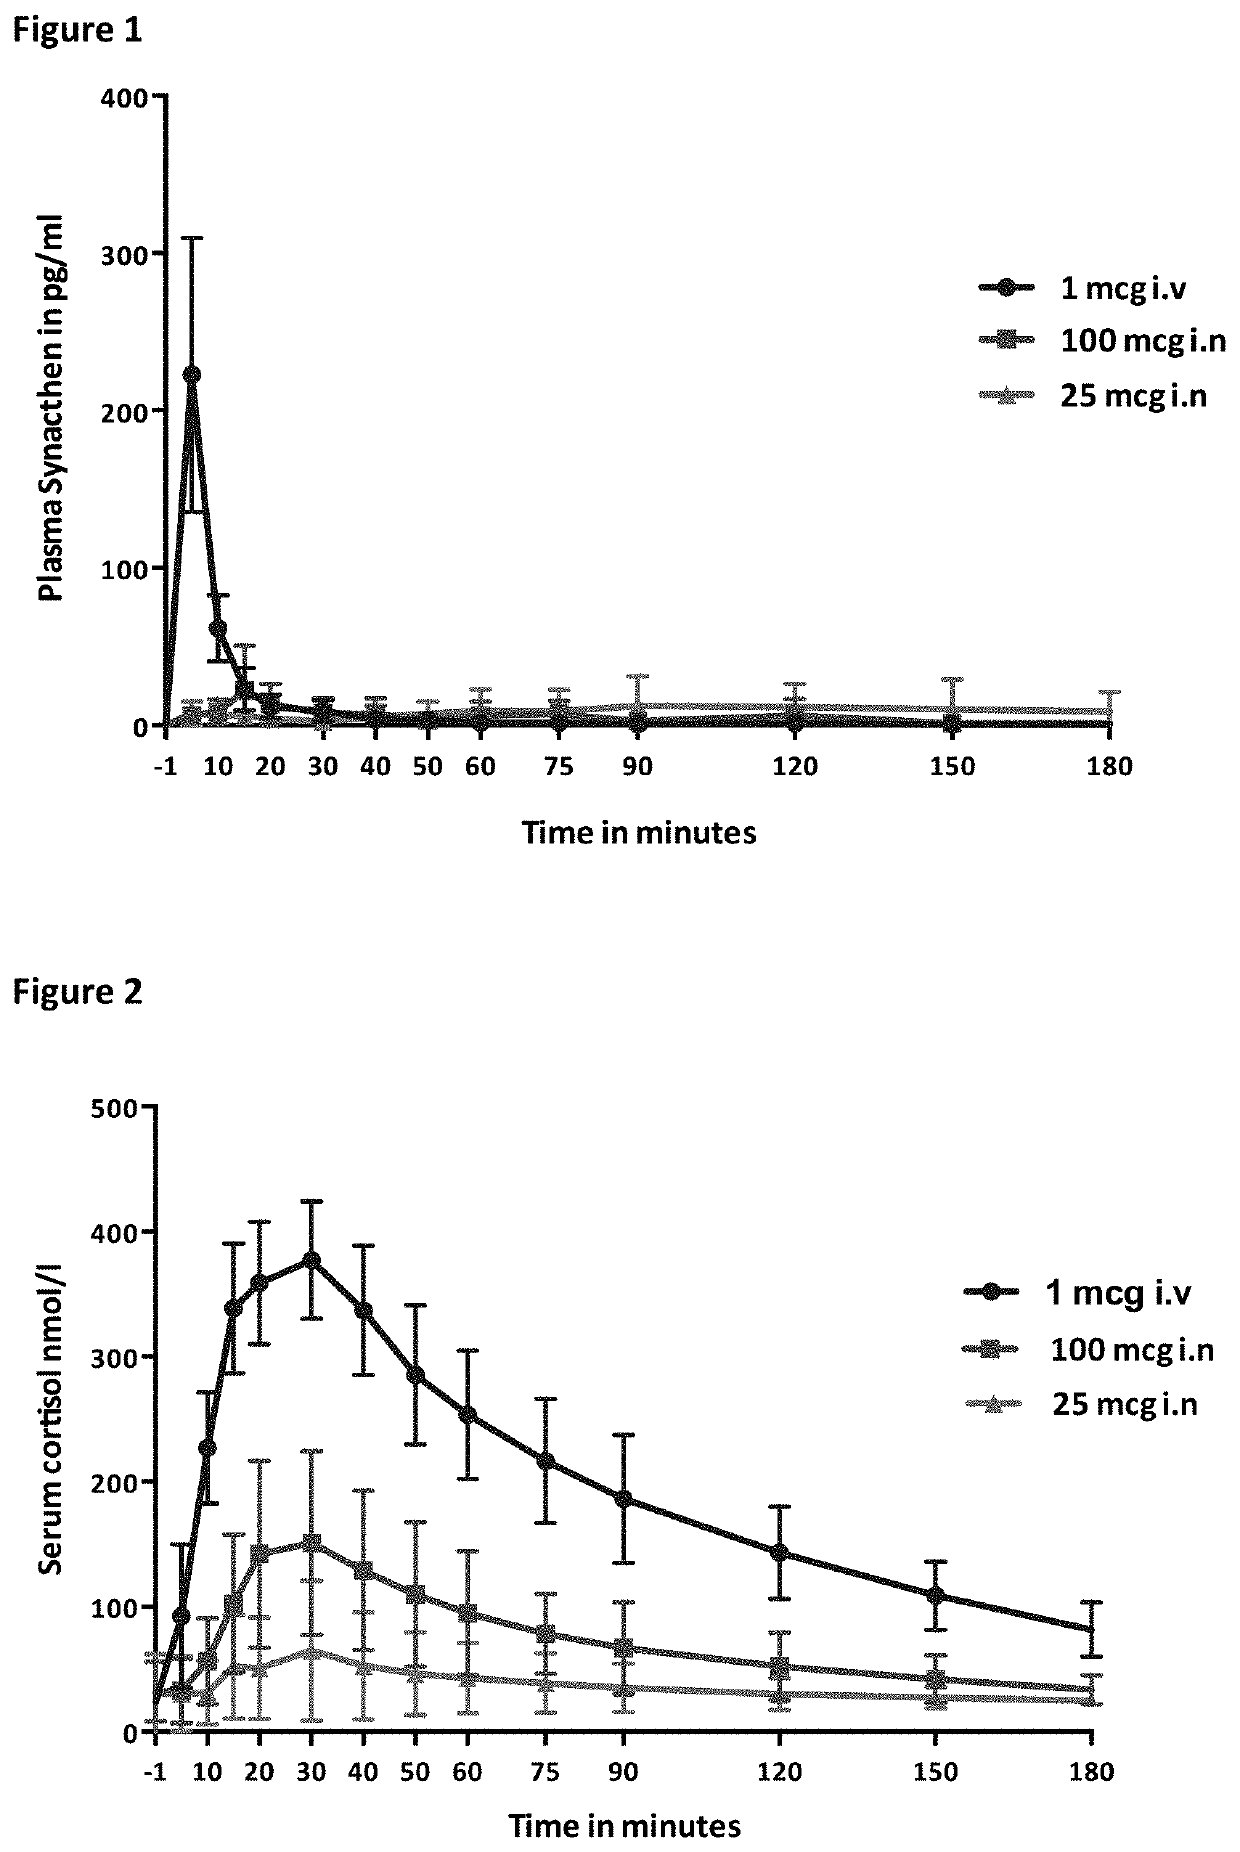
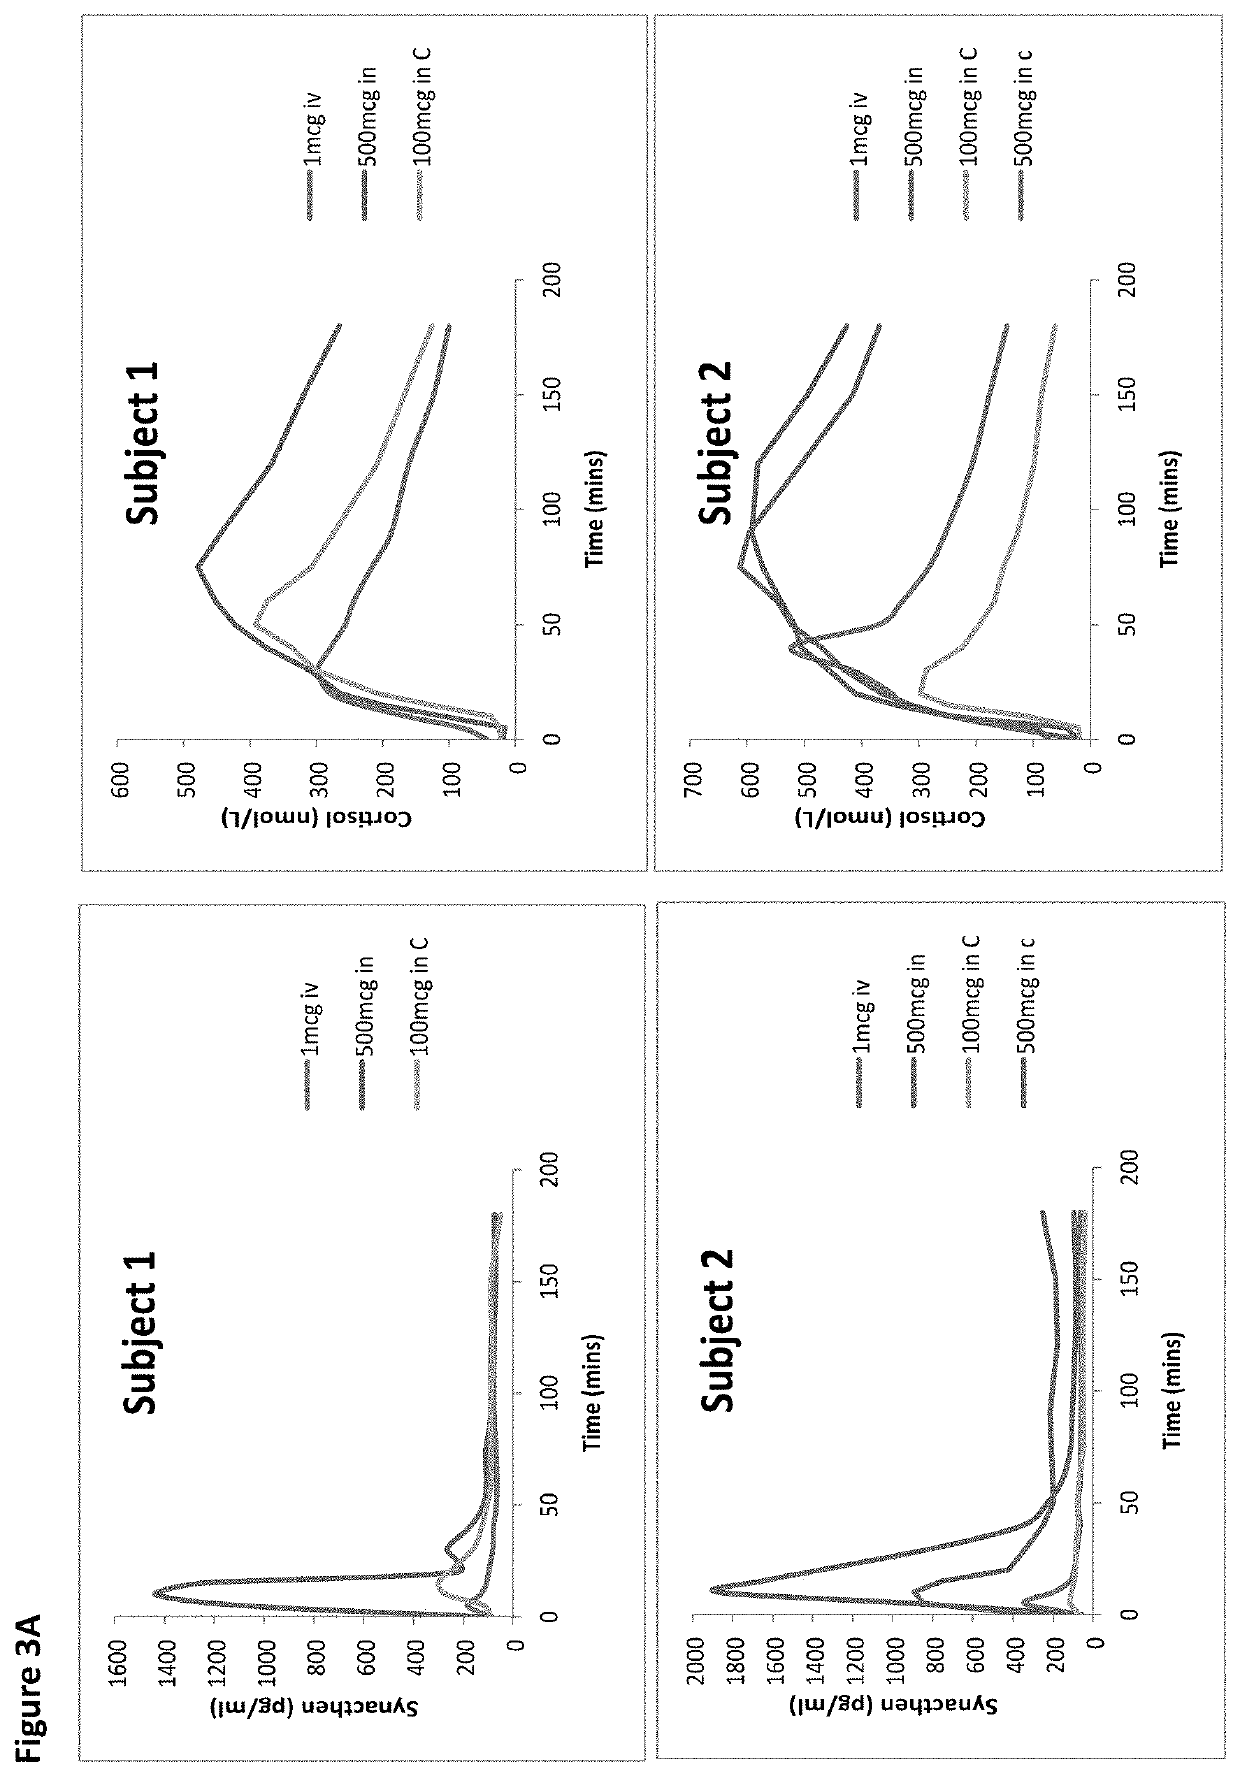
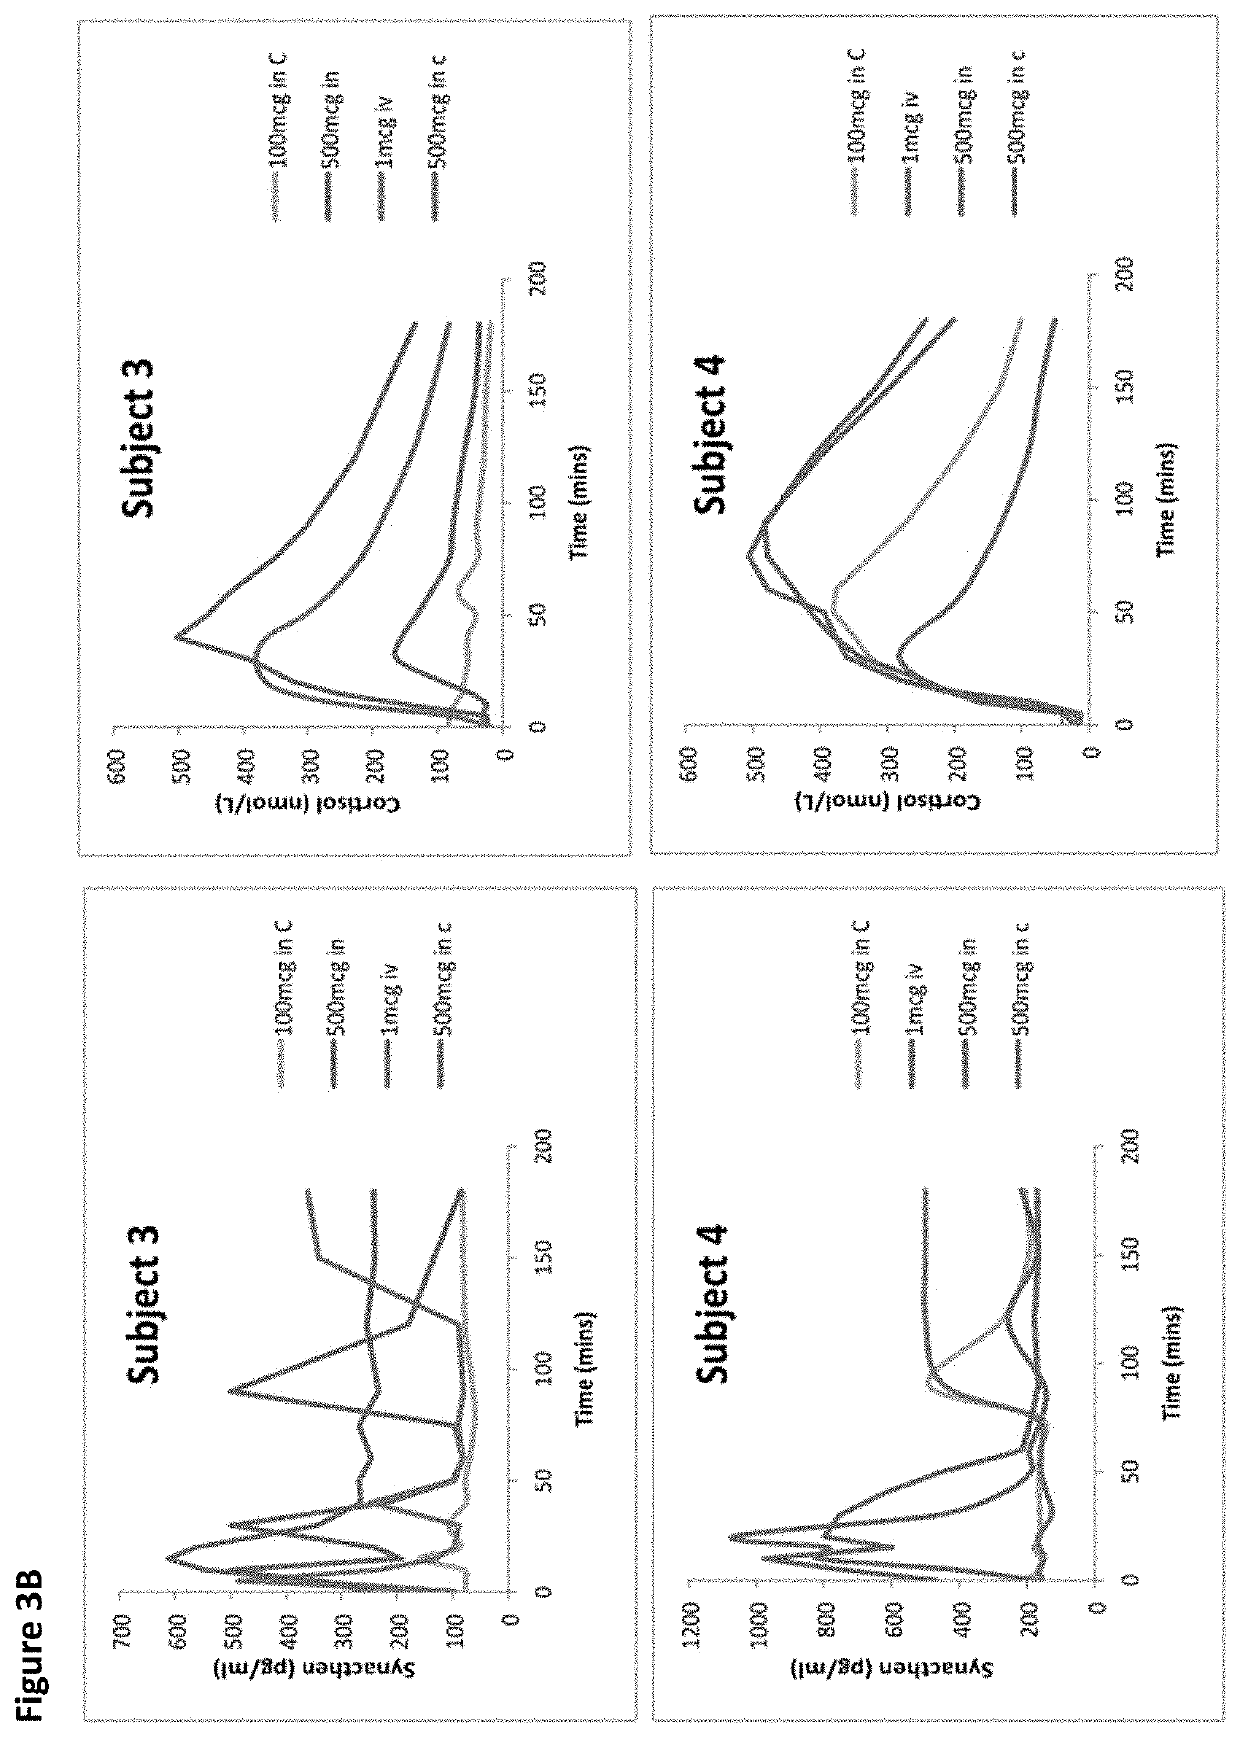
[0234]The two 1 mcg i.v tests produced broadly similar plasma Synacthen responses, both with a suppressed cortisol response. Considerable variability in plasma Synacthen levels with all formulations and serum cortisol response following nasal administration are demonstrated by the large ranges and SDs and can be seen by the large error bars (FIGS. 1, 2, 4, 5). The calculation of CVs gives a measure of variability and is considerably smaller for the i.v dose than the nasal formulations. When chitosan is added to 100 mcg tetracosactide it reduces the variability of peak plasma Synacthen values (CV falls from 187.8% to 52.6%) however with the 500 mcg tetracosactide dose the addition of chitosan appears to worsen variability (80.1% to 107.5%). The addition of chitosan reduced the variability of peak serum cortisol at both doses (100 mcg 59.2% to 47.8% and 500 mcg from 45.6% to 20.6%). The timing of the cortisol peak is seen to vary more after nasal Synacthen than following i.v administr...
example 3
[0241]IV 250mcg test (N=12)
[0242]Plasma cortisol rose 5 minutes after Synacthen administration (FIG. 8a). Plasma cortisol Tmax was at 120 minutes for all participants. The IV 250 mcg SST was the least variable, with standard deviations ranging from ±31.94-53.04 nmol / l for time-points. Mean plasma cortisol concentration:[0243]30 minutes: 406.8nmol / l (±44.33, range 349-477),[0244]60 minutes: 510.5nmol / l (±49.15, range 433-581).
[0245]IN 500 mcg Test (N=12)
[0246]Cortisol levels increased 10 minutes after intranasal Synacthen administration, later than in the IV test (FIG. 8c). Mean peak cortisol was lower in the lower dose IN test than the IV test, at 537.3 nmol / l (±77.65).
[0247]Plasma cortisol results for IN 500mcg were more variable than the IV test, as shown by higher standard deviations, except at 30 minutes post Synacthen. Results were nearly three times as spread at 90 and 120 minutes, although the lower mean concentration and varying Cmax and Tmax of the IN 500 mcg test should be...
example 4
[0260]Relationship between serum cortisol, salivary cortisol and salivary cortisone. The relational analysis of the NeSST Study (study 1) salivary samples, both to each other and the paired serum sample revealed a correlation, but not as tight as had been anticipated. The data from the NeSST2 Study (study 2) (FIGS. 13, 14, 15) and study 3 (NeSST2 1b) (FIGS. 19, 20, 21) were analysed in the same way. The NeSST Study and NeSST2 Study data were combined to give approximately 1150 paired samples. Tighter relationships than previously were seen between serum and salivary cortisol, salivary cortisol and cortisone and serum cortisol and salivary cortisone. A clear exponential, or biphasic response is seen between salivary and serum cortisol. A tight linear relationship between salivary cortisol and cortisone is observed and between serum cortisol and salivary cortisone.
PUM
| Property | Measurement | Unit |
|---|---|---|
| Time | aaaaa | aaaaa |
| Time | aaaaa | aaaaa |
| Mass | aaaaa | aaaaa |
Abstract
Description
Claims
Application Information
 - R&D
- Intellectual Property
- Life Sciences
- Materials
- Tech Scout
- Unparalleled Data Quality
- Higher Quality Content
- 60% Fewer Hallucinations
Browse by: Latest US Patents, China's latest patents, Technical Efficacy Thesaurus, Application Domain, Technology Topic, Popular Technical Reports.
© 2025 PatSnap. All rights reserved.Legal|Privacy policy|Modern Slavery Act Transparency Statement|Sitemap|About US| Contact US: help@patsnap.com


