
Computer implemented empirical mode decomposition method, apparatus, and article of manufacture for two-dimensional signals

a two-dimensional signal and empirical mode technology, applied in wave based measurement systems, instruments, using reradiation, etc., can solve problems such as difficult problems in analyzing physical signals, inability to achieve physical meaningful results, and insufficient total data span

Inactive Publication Date: 2001-10-30
NAT AERONAUTICS & SPACE ADMINISTATION U S GOVERNMENT AS REPRESENTED BY THE ADMISTRATOR OF THE
View PDF2 Cites 91 Cited by
  • Summary
  • Abstract
  • Description
  • Claims
  • Application Information

AI Technical Summary

Benefits of technology

The strength of the EMD method should be reiterated. EMD is built on the idea of identifying the various scales in the data which are quantities of great physical significance. Therefore, in the local extrema and curvature extrema Sifting Processes, orthogonality is not a consideration, but scales are. Since orthogonal decomposition is a characteristic for linear systems, violating this restriction is not a shortcoming but a breakthrough. Therefore, the decomposed IMF's may or may not be orthogonal. As such, this method can be applied to nonlinear data. Though the IMF's in most cases are practically orthogonal, it is a consequence rather than a requirement of the EMD.Another advantage of the method is the effective use of all the data representing the physical phenomenon. In the Sifting Processes, the longest scale is defined by the full length of the data. As a result, EMD can define many long period oscillations. As is well known, the Hilbert transform without sifting tends to identify the highest frequency (Boashash, 1992, "Estimating and Interpreting the Instantaneous Frequency of a Signal, Part I: Fundamentals", Proc. IEEE, 80, 520-538.), the extraction of the long period components is indeed a new feature of the EMD.Finally, though the EMD method will give IMF components, the individual component does not guarantee well-defined physical meaning. This is true for all decompositions, especially for methods with an a priori basis. In most cases, however, the IMF's do carry physical significance. Great caution should be exercised in making such attempts. The rule for interpreting the physical significance of the IMF's is that the scales should be clearly separated. Together with the Hilbert spectrum, the totality of the presentation should give a much more detailed representation of the physical processes than conventional methods.The invention being thus described, it will be obvious that the same may be varied in many ways. Such variations are not to be regarded as a departure from the spirit and scope of the invention, and all such modifications as would be obvious to one skilled in the art are intended to be included within the scope of the following claims.

Problems solved by technology

Analyzing physical signals is a difficult problem confronting many industries.
Unfortunately, previous methods have not yielded results which are physically meaningful.
(a) The total data span is too short;
(b) The data are nonstationary; and
(c) The data represent nonlinear processes.
Although problems (a)-(c) are separate issues, the first two problems are related because a data section shorter than the longest time scale of a stationary process can appear to be nonstationary.
This assumption may lead to inaccurate results and incorrect interpretation of the underlying physics as explained below.
Although the Fourier transform that is applied by these computer implemented methods is valid under extremely general conditions, there are some crucial restrictions: the system must be linear, and the data must be strictly periodic or stationary.
If these conditions are not met, then the resulting spectrum will not make sense physically.
Although linear approximation is an adequate solution for some applications, many physical phenomena are highly nonlinear and do not admit a reasonably accurate linear approximation.
Furthermore, imperfect probes / sensors and numerical schemes may contaminate data representative of the phenomenon.
Under these conditions, computer implemented methods which apples Fourier spectral analysis are of limited use.
For lack of alternatives, however, such methods still apply Fourier spectral analysis to process such data.
Moreover, the indiscriminate use of Fourier spectral analysis in these methods and the adoption of the stationary and linear assumptions may give misleading results some of which are described below.
Constrained by the conservation of energy principle, these spurious harmonics and the wide frequency spectrum cannot faithfully represent the true energy density of the lighting in the frequency and time space.
Thus, the Fourier components might make mathematical sense, but they often do not make physical sense when applied.
Although no physical process can be represented exactly by a delta function, some physical data such as the near field strong earthquake energy signals are of extremely short duration.
Furthermore, both nonstationarity and nonlinearity can induce spurious harmonic components that cause unwanted energy spreading and artificial frequency smearing in the Fourier spectrum.
The consequence is incorrect interpretation of physical phenomenon due to the misleading energy-frequency distribution for nonlinear and nonstationary data representing the physical phenomenon.
According to the above background, the state of the art does not provide a useful computer implemented tool for analyzing nonlinear, nonstationary physical signals.
Therefore, like the one-dimensional data processing techniques described above, the conventional processing techniques are simply inadequate to process such two-dimensional data.
However, many images contain inhomogeneous scales which cannot be satisfactorily separated, analyzed or processed by conventional image processing methods.
These problems include inaccurate interpretation of the underlying physics caused in part by energy spreading and frequency smearing in the Fourier spectrum.
With the physical approach and the approximation adopted here, the inventive method does not always guarantee a perfect instantaneous frequency under all conditions.
Other than these theoretical difficulties, on the practical side, serious problems of the spline fitting can occur near the ends, where the cubic spline fitting can have large swings.
Left by themselves, the end swings can eventually propagate inward and corrupt the whole data span especially in the low frequency components.
Unfortunately, the effects of the second condition, when carried to the extreme, could obliterate the physically meaningful amplitude fluctuations.
Although the mean can be treated as a zero reference, defining it is difficult, for the whole process is transient.
The components with the highest frequencies add little more energy, but they make the data look more complicated.
In fact, the highest frequency component is probably not physical, for the digitizing rate of the Pitot tube is too slow to capture the high frequency variations.
Although this local extrema Sifting Process is an excellent tool, it has difficulty analyzing a composite signal or profile having a weak signal component that cannot itself generate local extrema in the composite signal.
Furthermore, the Rice definitions cannot be applied to nonlinear and / or nonstationary data.
Because of the limitations set forth in Rice's assumptions, his results have also created some paradoxes: in may data sets, the number of the expected extrema computed from the above formula becomes unbounded.
This dilemma, however, has not alerted investigators to question Rice's formulae and the assumptions involved, but it has led most to reject any formula that involves moments higher than the 4th.
Such an approach limited the past statistical measure of time scale to the computation of zero-crossings which is too crude to be of any real use.
Refined as the extrema criterion is, it still lacks precision sometimes. By examining the data in closer detail, it can be found that the extrema spacing can miss some subtle time scale variations especially when a weak signal oscillation is overwhelmed by a larger oscillation.
As described above, the local extrema statistics has encountered difficulties already.
Fortunately, this difficulty is an artifact and the consequence of the linear and stationary assumptions invoked.
Consequently, the failure of the Rice model is another indication of the falsehood of the commonly invoked linearity and stationarity assumptions.
Since the sub-modes are all weak, it is impossible to extract them from the data by applying the local extrema Sifting Process.
Furthermore, the curvature extrema Sifting Process should be monitored carefully especially when the signal to noise ratio of the physical signal is low which could result in noise corruption and false readings.
Although the Hilbert transform can treat the monotonic trend as part of a longer oscillation, the energy involved in the residual trend could be overpowering.
Furthermore, a lower frequency resolution saves computation time for the computer implemented method.
Although the Hilbert Transform can treat the monotonic trend as part of a longer oscillation, the energy involved in the residual trend could be overpowering.
Furthermore, the wavelet result fails to capture the higher energy near the initial line along the y axis.
The thickness of these slabs indicates the poor frequency resolving power of the conventional wavelet techniques.
Although the satellite image shows many details of the hurricane cloud formation, the contrast is not high enough to clearly define the detailed cloud swirl streaks.

Method used


Image

  • Computer implemented empirical mode decomposition method, apparatus, and article of manufacture for two-dimensional signals
  • Computer implemented empirical mode decomposition method, apparatus, and article of manufacture for two-dimensional signals
  • Computer implemented empirical mode decomposition method, apparatus, and article of manufacture for two-dimensional signals

Examples


Embodiment Construction

As described above, the invention constructs upper and lower envelopes 20, 30 with a cubic spline in steps 210 and 230, respectively and in step 560. This cubic spline fitting, however, has both overshoot and undershoot problems. These problems can be alleviated by using more sophisticated spline methods, such as the taut spline in which the tension of the spline curve can be adjusted.

Another alternative is higher-order spline fitting. Although such higher-order spline fitting may be more accurate, it will, however, introduce more inflection points or extrema, and consume more computing time. Therefore, it is not recommended as a standard operation. In special cases, however, it may be useful.

As the spline fitting procedure is time consuming, more efficient methods can be devised by using simple mean values of successive extrema instead of computing the envelope-mean. In this way, only one spline fitting is required rather than two. Although this alternative is easier and faster to ...


PUM


Abstract

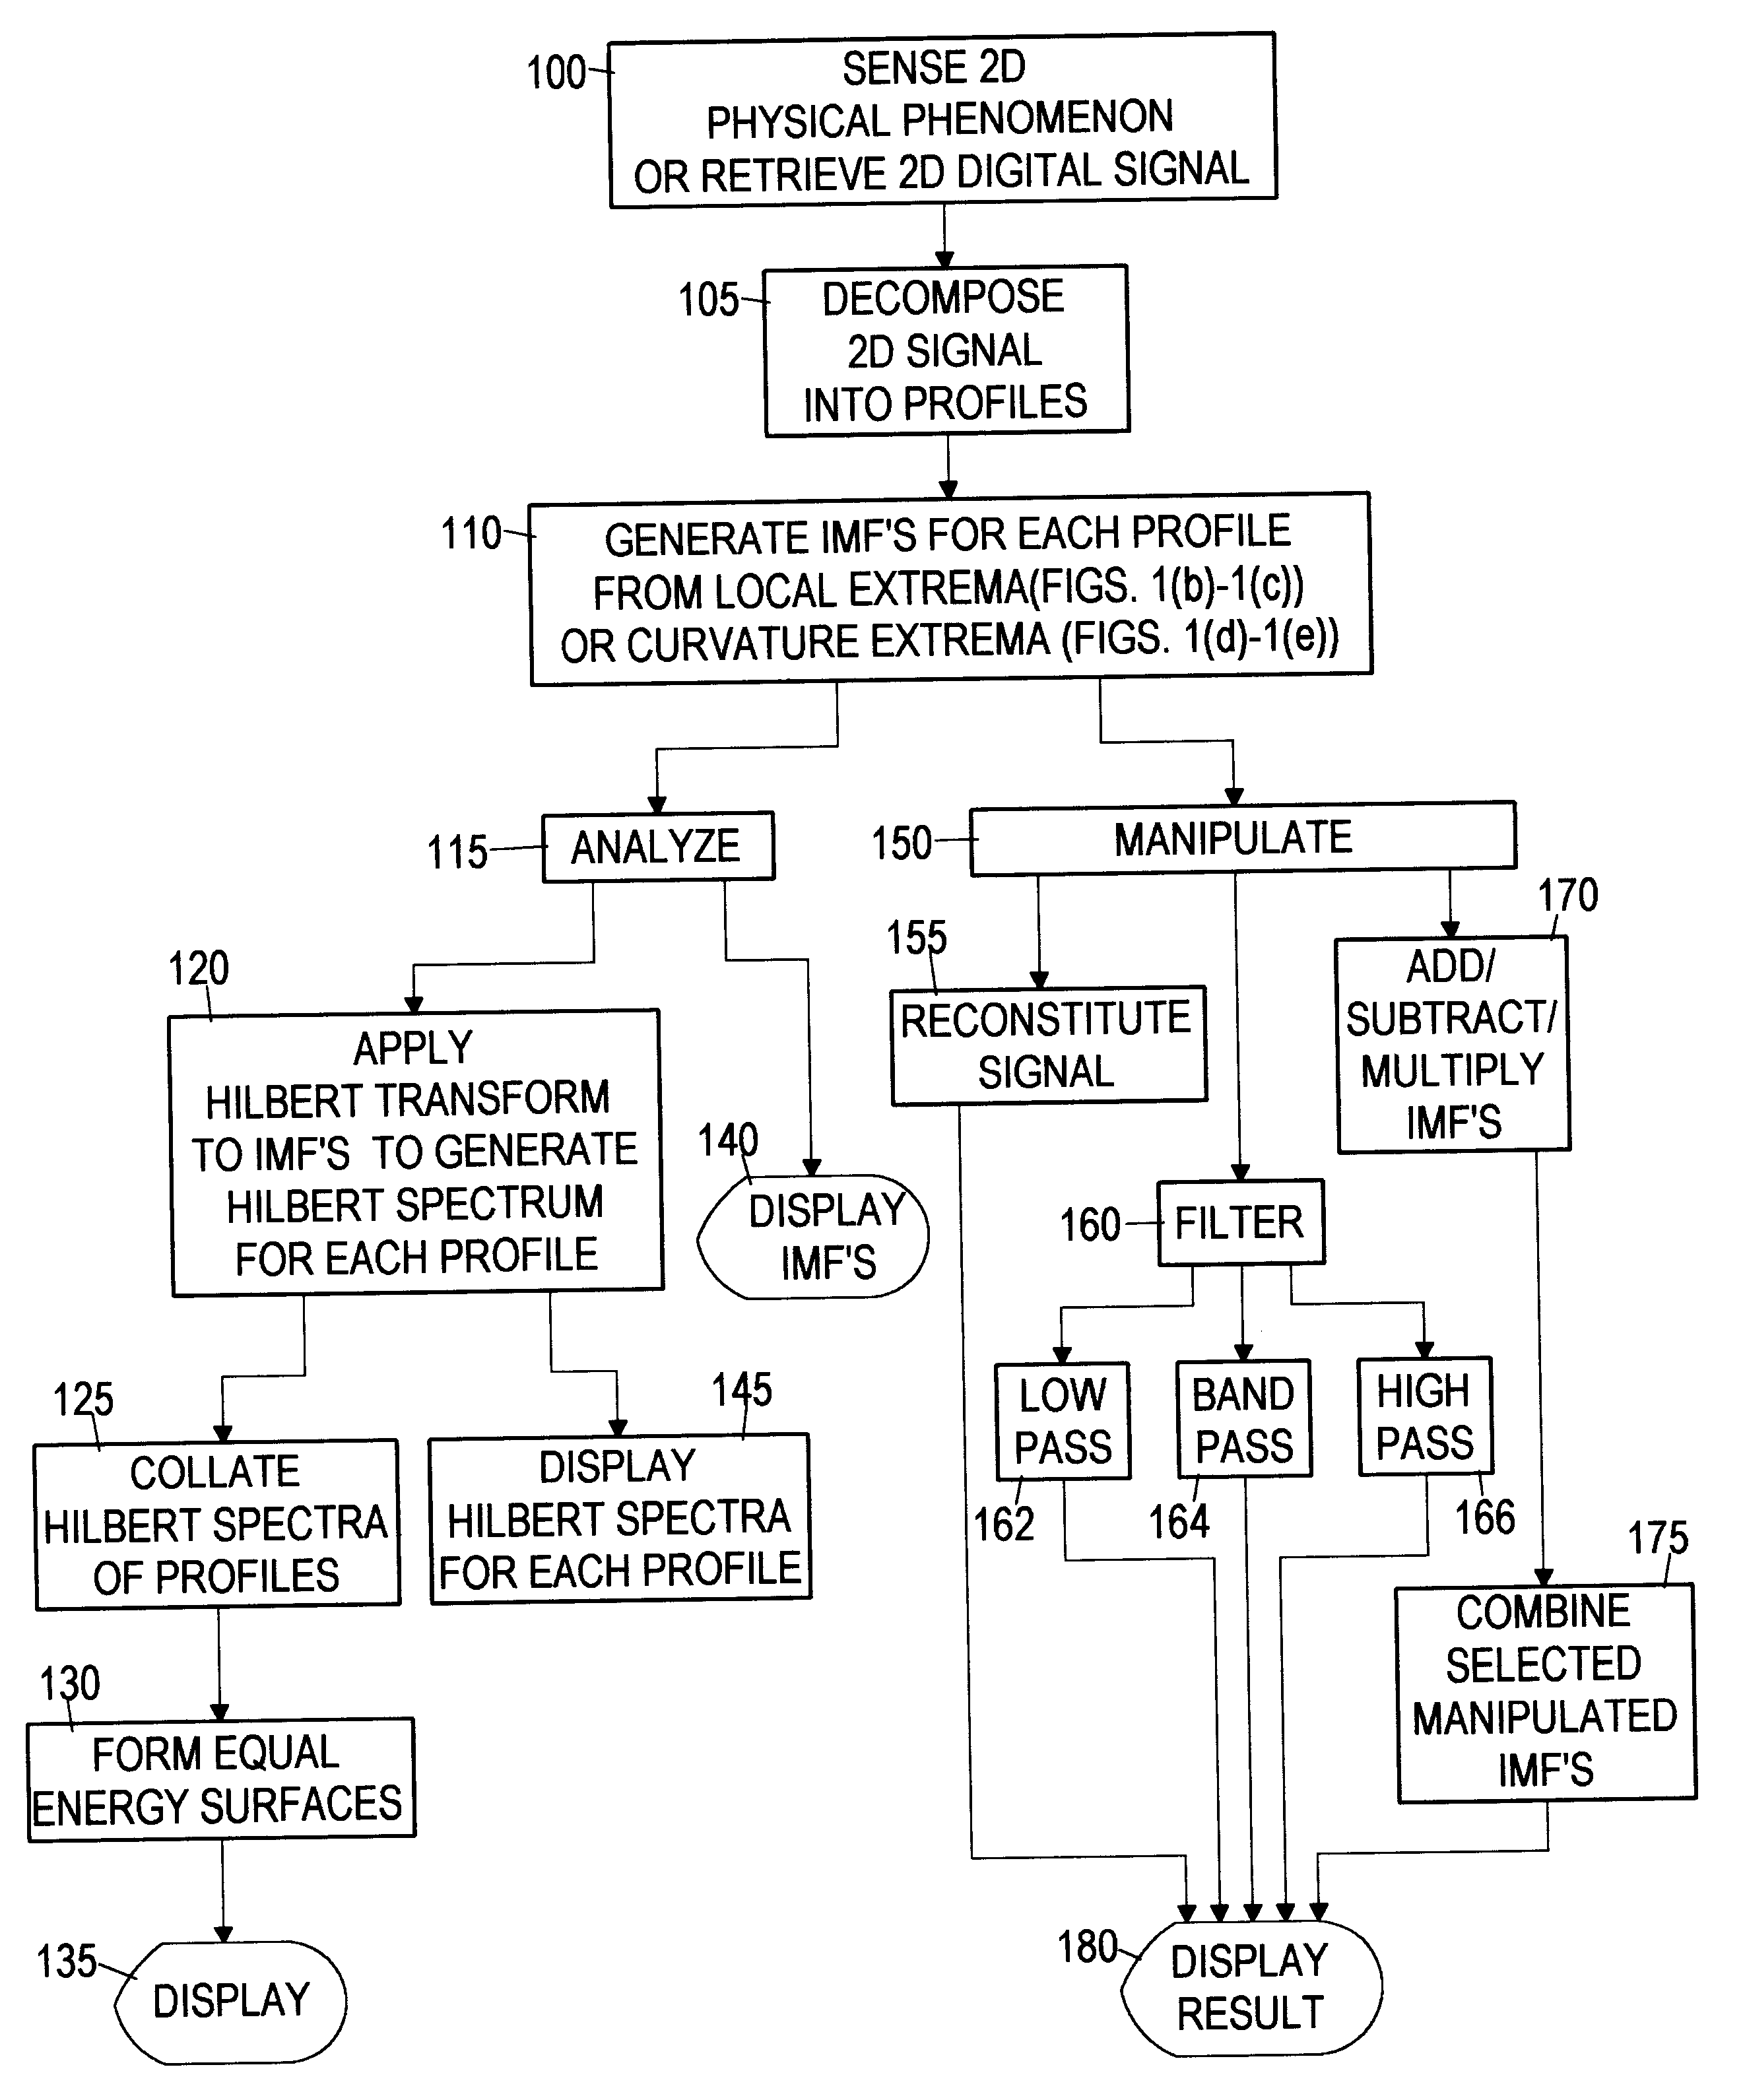
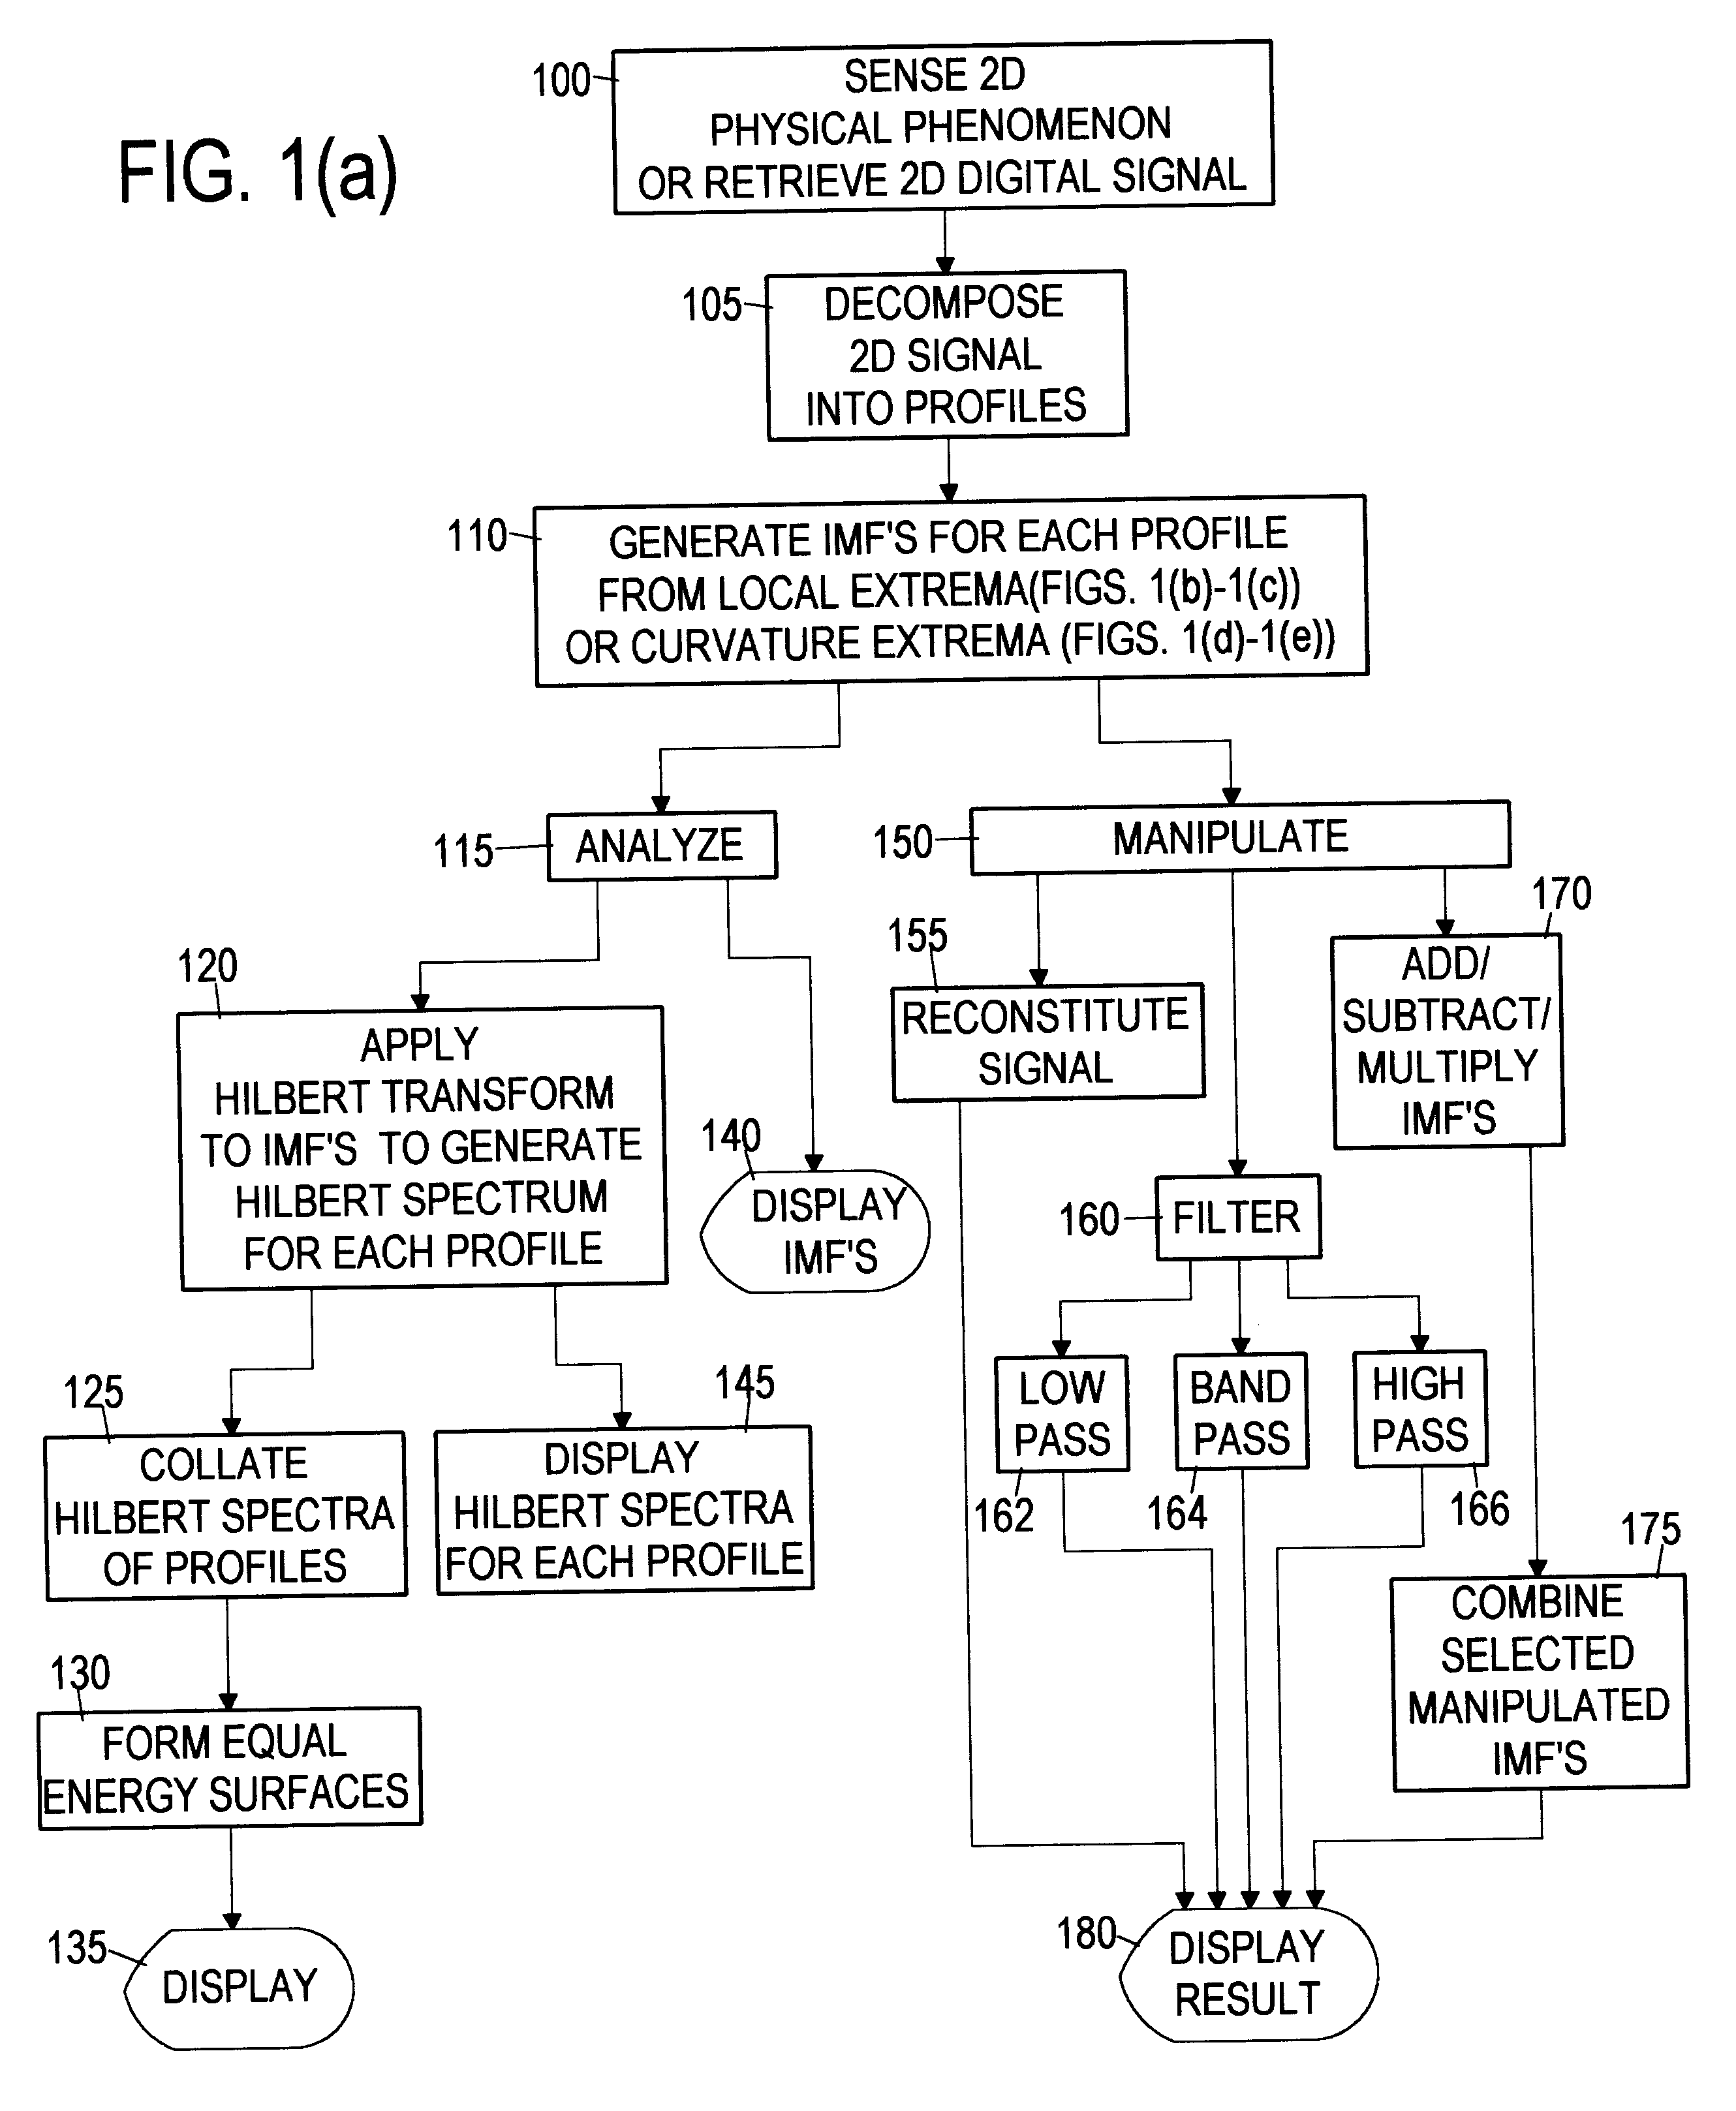
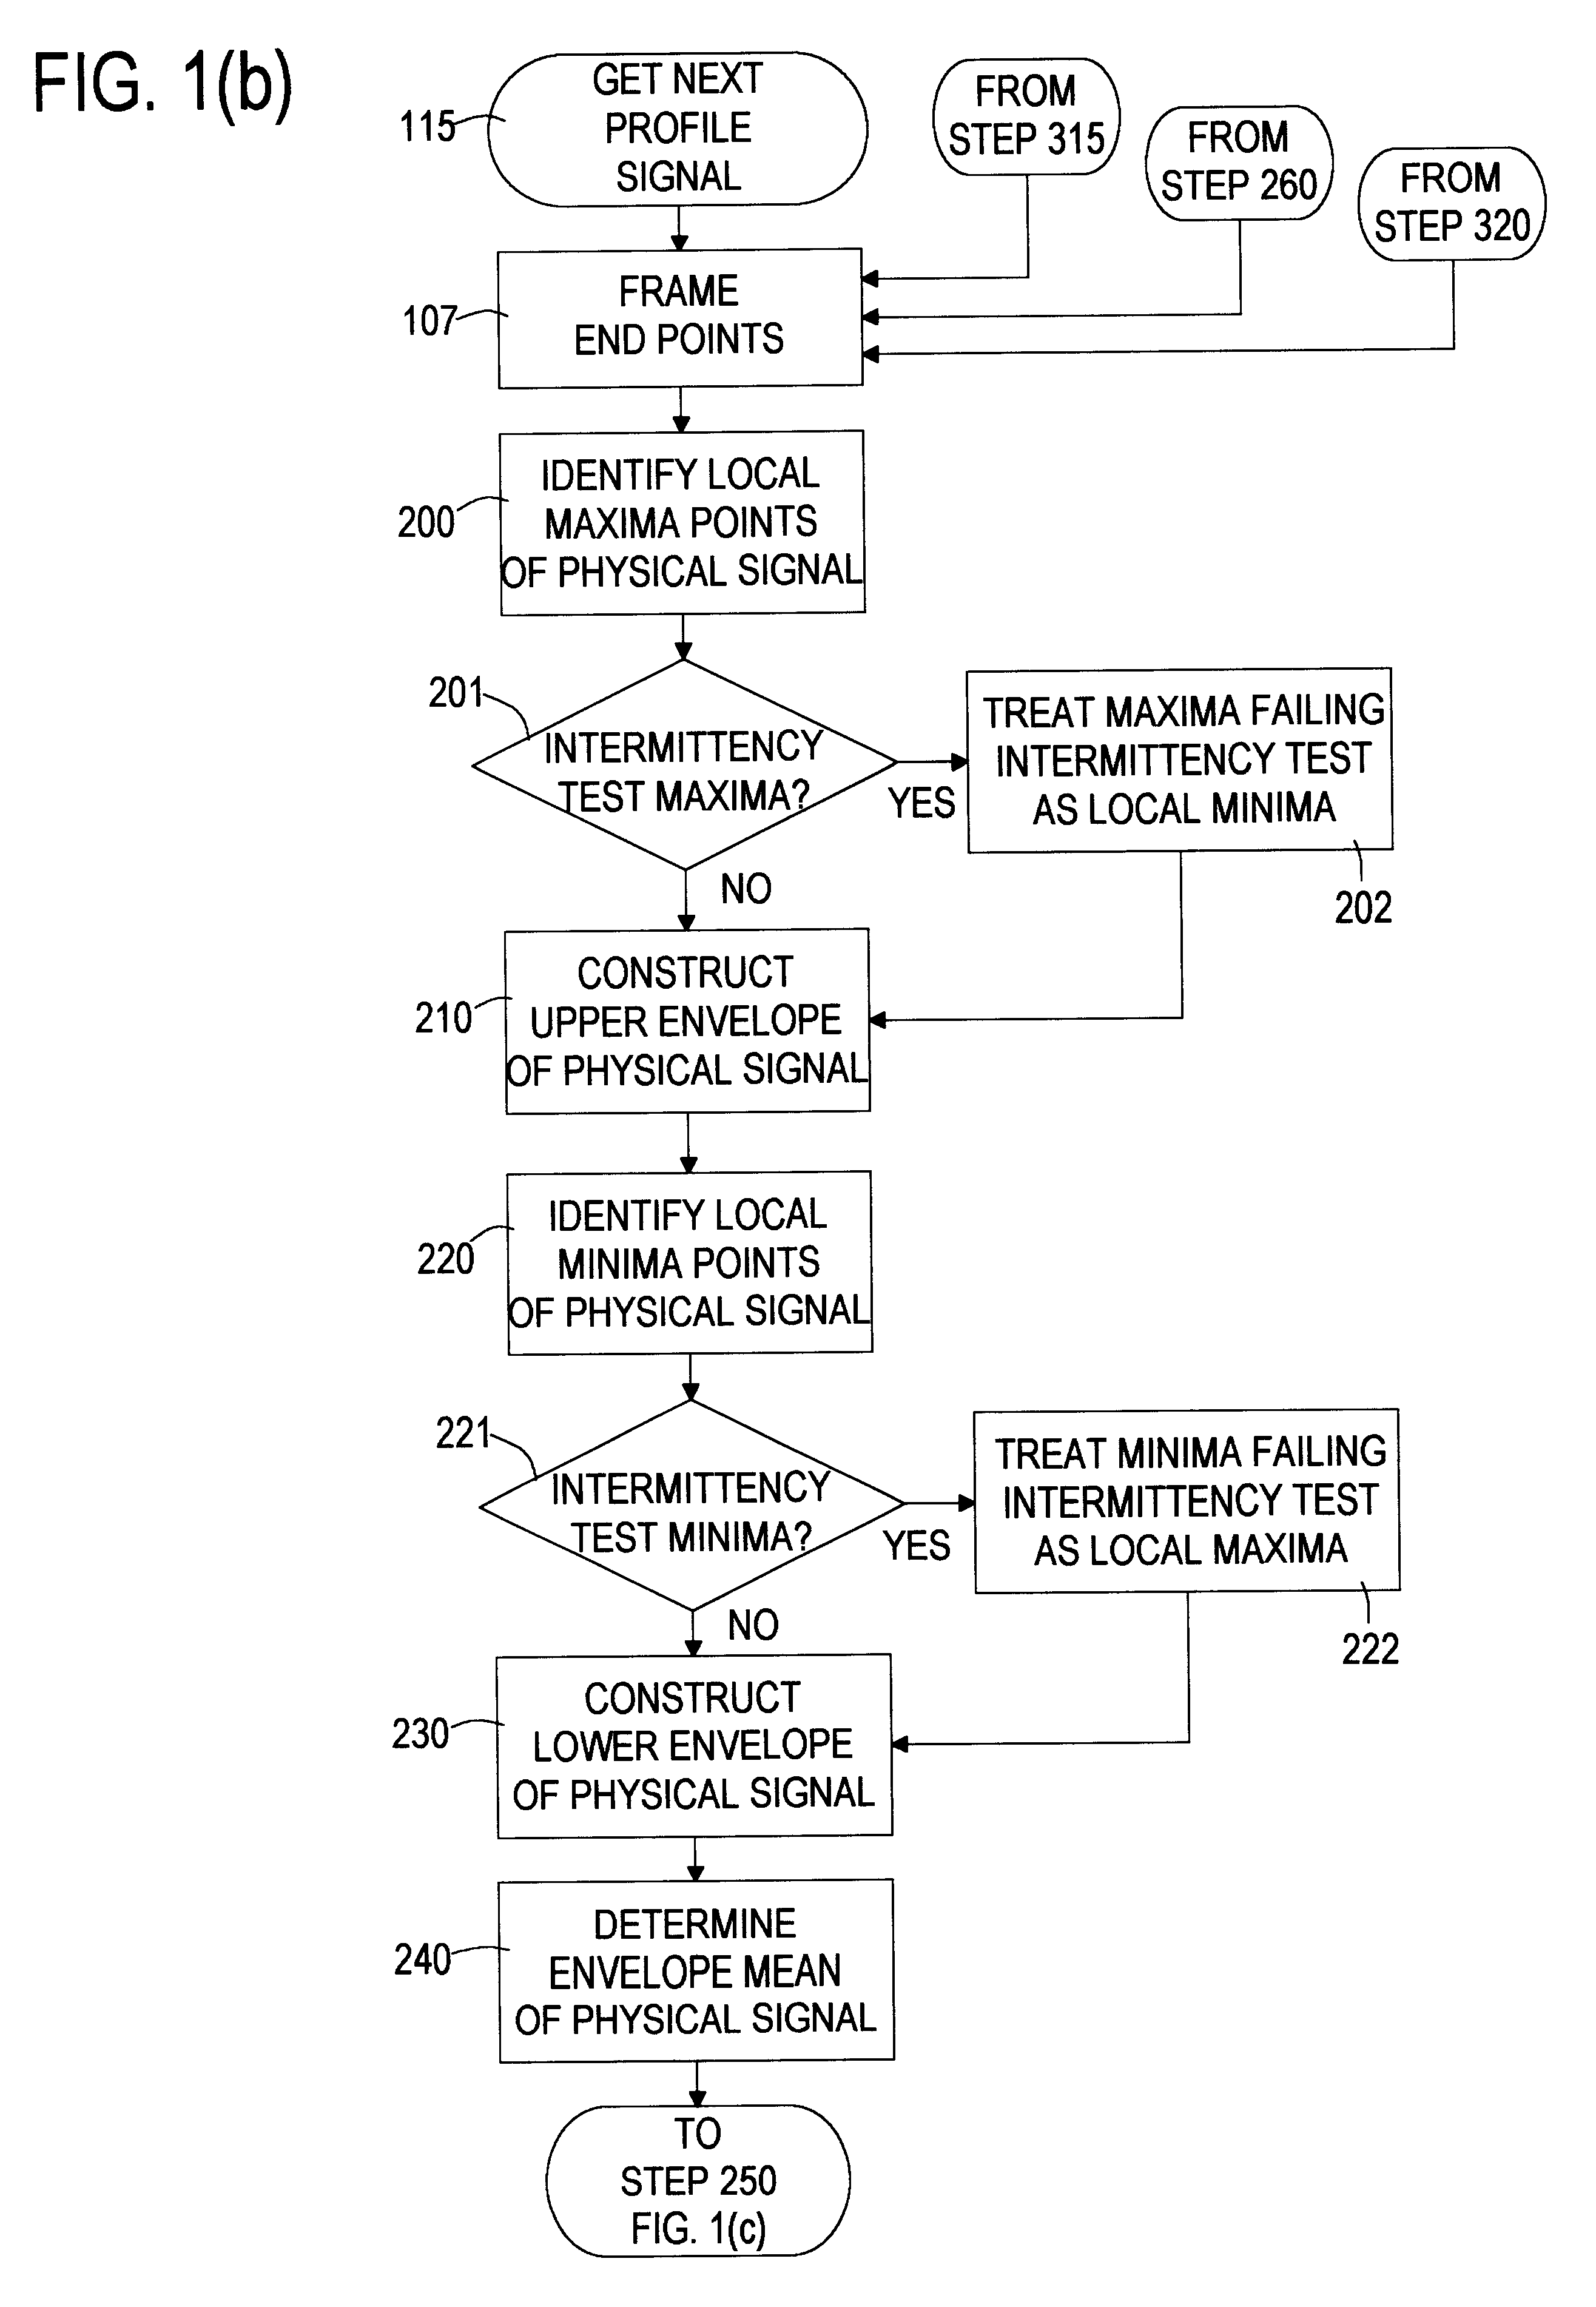
A computer implemented method of processing two-dimensional physical signals includes five basic components and the associated presentation techniques of the results. The first component decomposes the two-dimensional signal into one-dimensional profiles. The second component is a computer implemented Empirical Mode Decomposition that extracts a collection of Intrinsic Mode Functions (IMF's) from each profile based on local extrema and / or curvature extrema. The decomposition is based on the direct extraction of the energy associated with various intrinsic time scales in the profiles. In the third component, the IMF's of each profile are then subjected to a Hilbert Transform. The fourth component collates the Hilbert transformed IMF's of the profiles to form a two-dimensional Hilbert Spectrum. A fifth component manipulates the IMF's by, for example, filtering the two-dimensional signal by reconstructing the two-dimensional signal from selected IMF(s).

Description

ORIGIN OF INVENTIONThe invention disclosed herein was made by an employee of the United States Government, and may be manufactured and used by or for the Government for governmental purposes without the payment of any royalties thereon or therefor.COLOR DRAWING NOTIFICATIONThe file of this patent contains at least one drawing executed in color. Copies of this patent with color drawing(s) will be provided by the Patent and Trademark Office upon request and payment of the necessary fee.COPYRIGHT NOTIFICATIONPortions of this patent application contain materials that are subject to copyright protection. The copyright owner has no objection to the facsimile reproduction by anyone of the patent document or the patent disclosure, as it appears in the Patent and Trademark Office patent file or records, but otherwise reserves all copyright rights whatsoever.1. Technical Field of the InventionThis invention generally relates to a computer implemented physical signal processing method, apparat...

Claims


Application Information

Patent Timeline
Patent Type & Authority Patents(United States)
IPC IPC(8): G06F17/14
CPCG06F17/14G01V1/364G06F17/18
Inventor HUANG, NORDEN E.
Owner NAT AERONAUTICS & SPACE ADMINISTATION U S GOVERNMENT AS REPRESENTED BY THE ADMISTRATOR OF THE
Learn More