Empirical mode decomposition for analyzing acoustical signals

a signal and empirical mode technology, applied in the field ofsignal analysis methods, can solve the problems of not yielding physical meaningful results, previous methods have not yielded results which are physically meaningful, and represent physical processes with physical signals may present one or mor

Inactive Publication Date: 2005-03-01
NAT AERONAUTICS & SPACE ADMINISTATION UNITED STATES GOVERNMENT AS REPRESENTED BY THE ADMINISTATOR OF THE
View PDF4 Cites 57 Cited by
  • Summary
  • Abstract
  • Description
  • Claims
  • Application Information

AI Technical Summary

Benefits of technology

Once the IMF's are generated, the invention can then produce a distilled or otherwise filtered version of the original physical signal. This distillation process eliminates undesired IMF's and thereby generates a filtered signal from which it is possible to perform a curve fitting process. In this way, it is possible to arrive at an analytic function which accurately represents the physically important components of the original signal.

Problems solved by technology

Previously, analyzing signals, particularly those having nonlinear and / or nonstationary properties, was a difficult problem confronting many industries.
Unfortunately, previous methods have not yielded results which are physically meaningful.
Among the difficulties found in conventional systems is that representing physical processes with physical signals may present one or more of the following problems:(a) The total data span is too short;(b) The data are nonstationary; and(c) The data represent nonlinear processes.
Although problems (a)-(c) are separate issues, the first two problems are related because a data section shorter than the longest time scale of a stationary process can appear to be nonstationary.
This assumption may lead to inaccurate results and incorrect interpretation of the underlying physics as explained below.
Although the Fourier transform that is applied by these computer implemented methods is valid under extremely general conditions, there are some crucial restrictions: the system must be linear, and the data must be strictly periodic or stationary.
If these conditions are not met, then the resulting spectrum will not make sense physically.
Although linear approximation is an adequate solution for some applications, many physical phenomena are highly nonlinear and do not admit a reasonably accurate linear approximation.
Furthermore, imperfect probes / sensors and numerical schemes may contaminate data representative of the phenomenon.
Under these conditions, computer implemented methods which apply Fourier spectral analysis are of limited use.
For lack of alternatives, however, such methods still apply Fourier spectral analysis to process such data.
In summary, the indiscriminate use of Fourier spectral analysis in these methods and the adoption of the stationarity and linearity assumptions may give inaccurate results some of which are described below.
Constrained by the conservation of energy principle, these spurious harmonics and the wide frequency spectrum cannot faithfully represent the true energy density of the lighting in the frequency and time space.
Thus, the Fourier components might make mathematical sense, but they often do not make physical sense when applied.
Although no physical process can be represented exactly by a delta function, some physical data such as the near field strong earthquake energy signals are of extremely short duration.
Furthermore, both nonstationarity and nonlinearity can induce spurious harmonic components that cause unwanted energy spreading and artificial frequency smearing in the Fourier spectrum.
In other words, the nonstationary, stochastic nature of biological data suffers from conventional signal processing techniques and makes the interpretation of the processed data quite difficult.
Many of the aforementioned signal processing problems exist when biological signals are processed.
In other words, conventional Fourier analysis of biological data throws away or otherwise obscures valuable information.
Thus, the complex biological phenomena producing such data cannot be readily understood and is, in any event, represented imprecisely.
The interpretation of the results of such conventionally processed data may, therefore, be quite difficult.
The conventional techniques also make accurate modelling of the biological phenomena very difficult and, sometimes, impossible.
Unfortunately, the tools we have to deal with nonstationary processes are quite limited; therefore, we are forced to make all kinds of approximations: As a result, there is a conflict between the human perception and automatic sound processes.
Clearly, using the traditional method based on the stationary assumption cannot explain the HSR processes.
So far, we have only touched on the problem of nonstationary properties of the acoustical signal.
Unfortunately, in our speech, vowels are not the information carrying sounds, the consonant's are.
No one would be able to decipher what is its meaning at all.
This creates obvious difficulties for the present approach in speech signal analysis using methods based on linear and stationary assumptions such as filter bank or spectrogram etc.

Method used


Image

  • Empirical mode decomposition for analyzing acoustical signals
  • Empirical mode decomposition for analyzing acoustical signals
  • Empirical mode decomposition for analyzing acoustical signals

Examples


Embodiment Construction

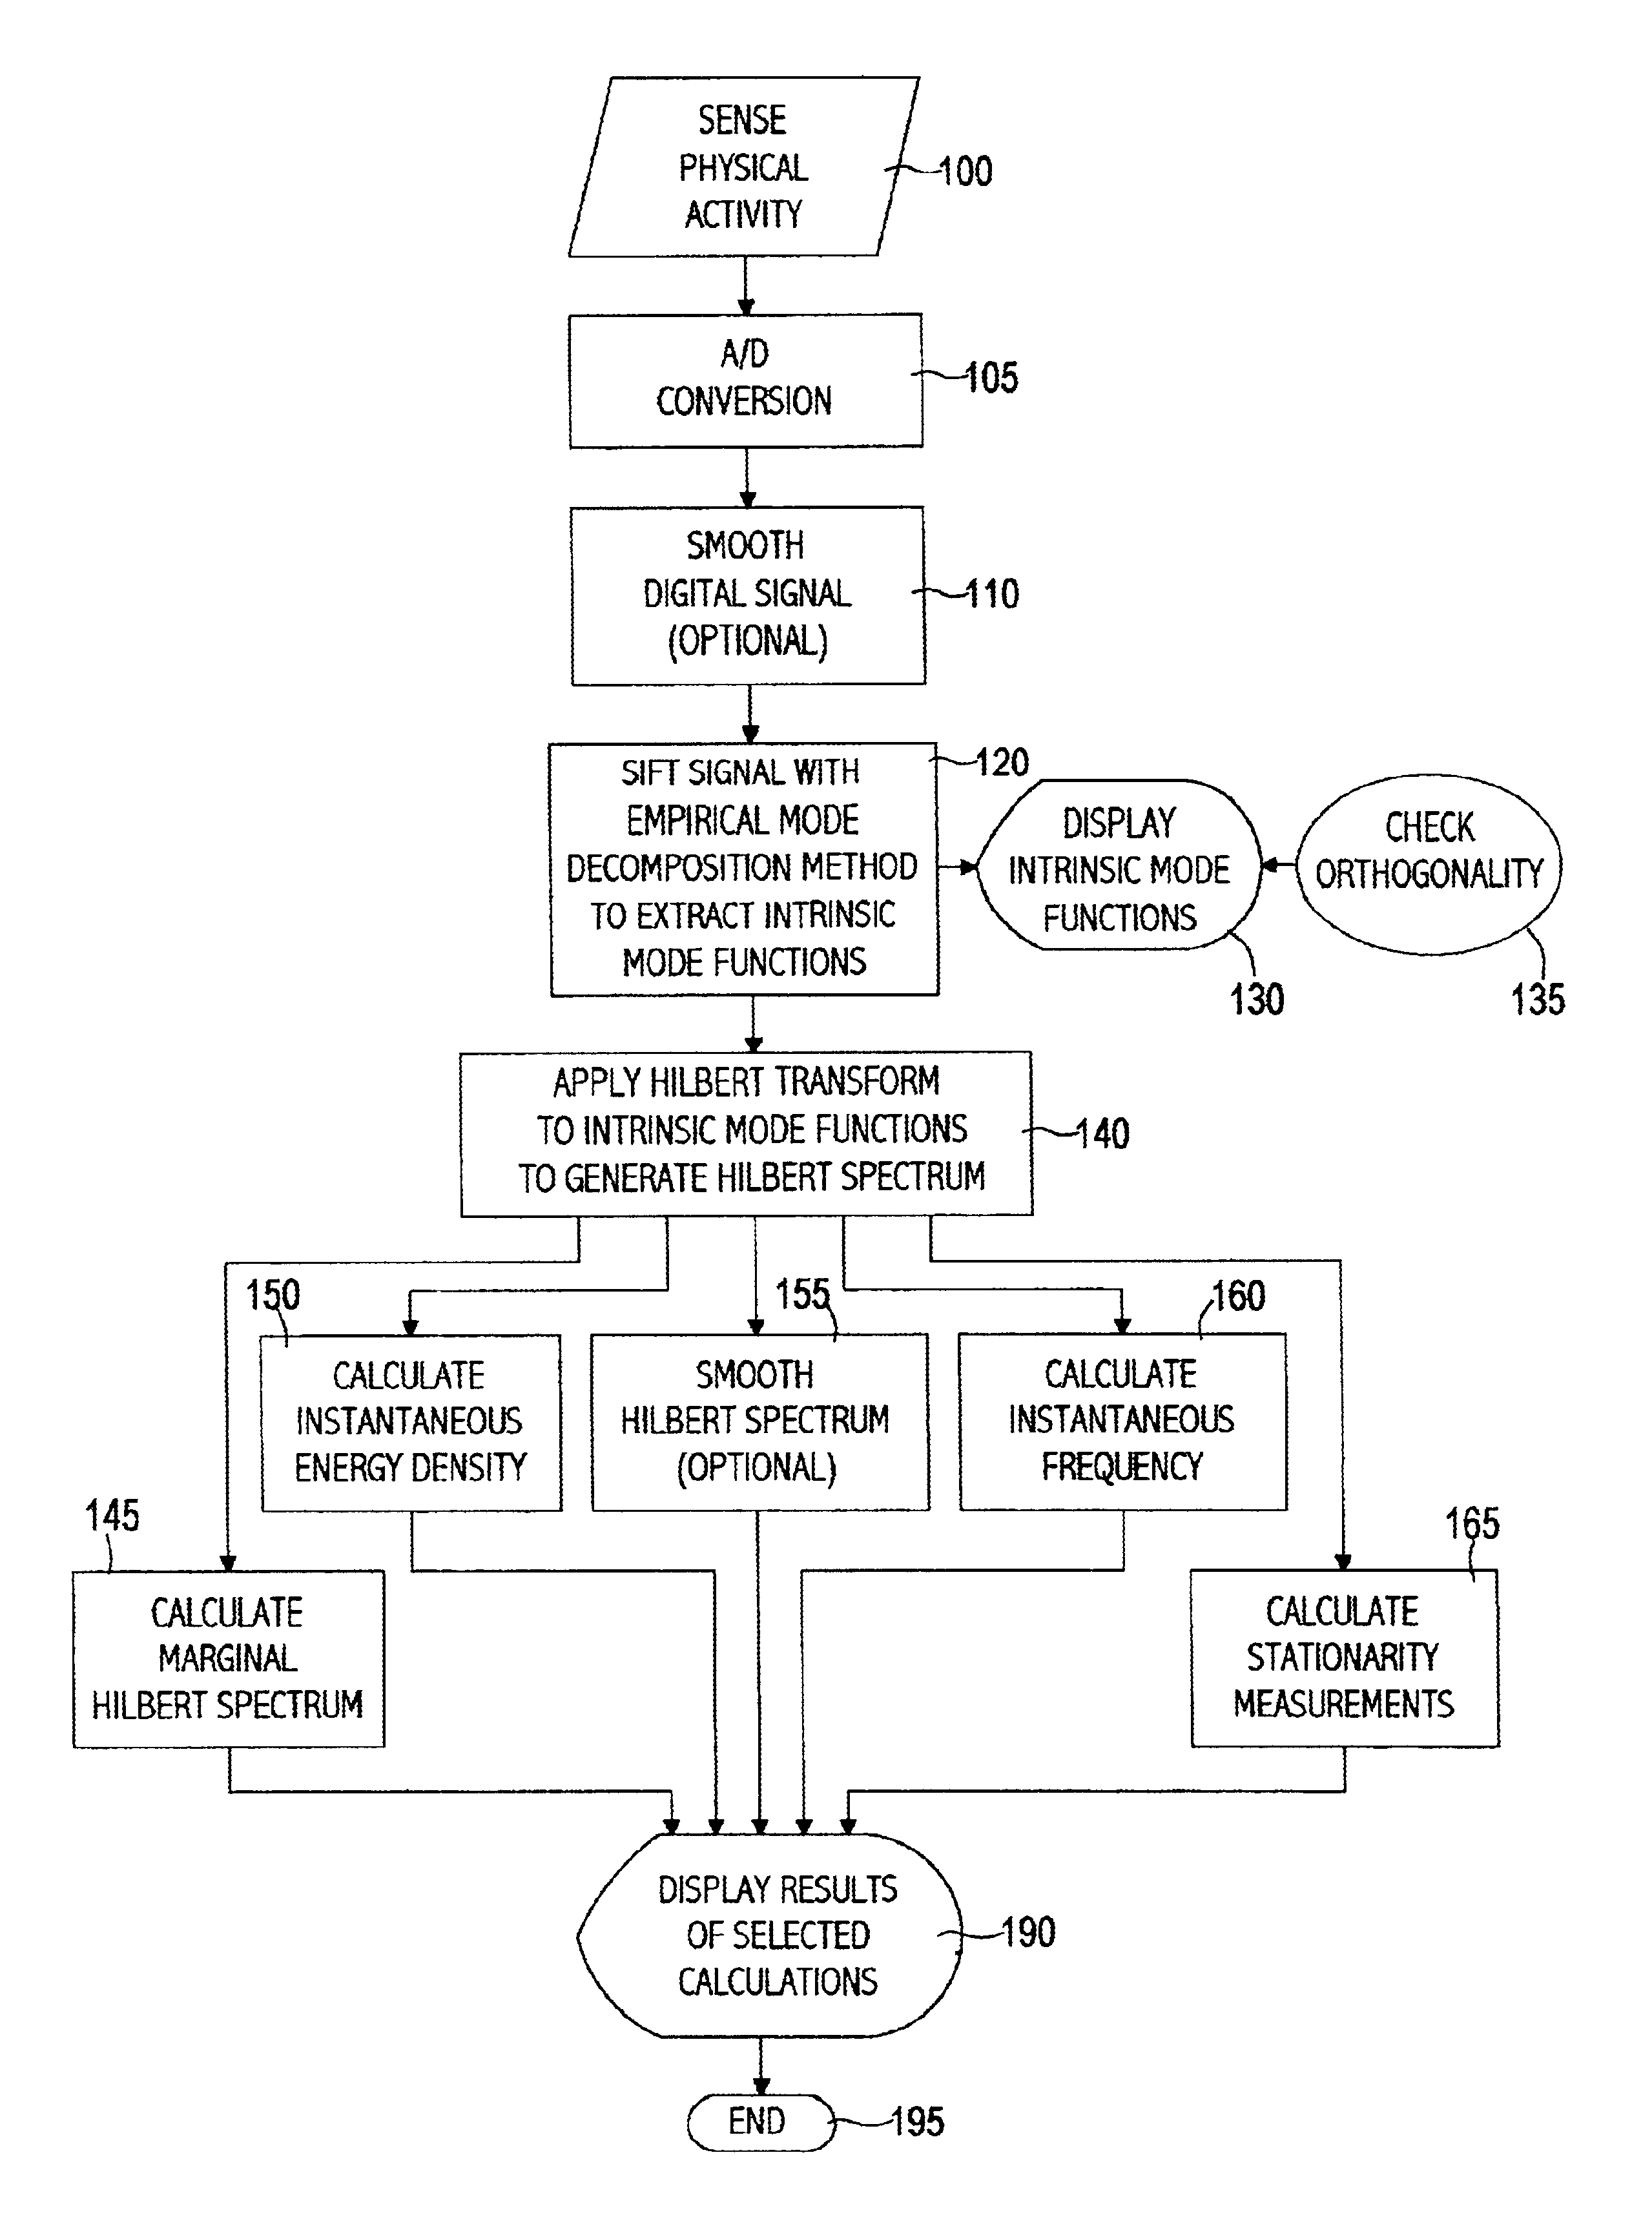
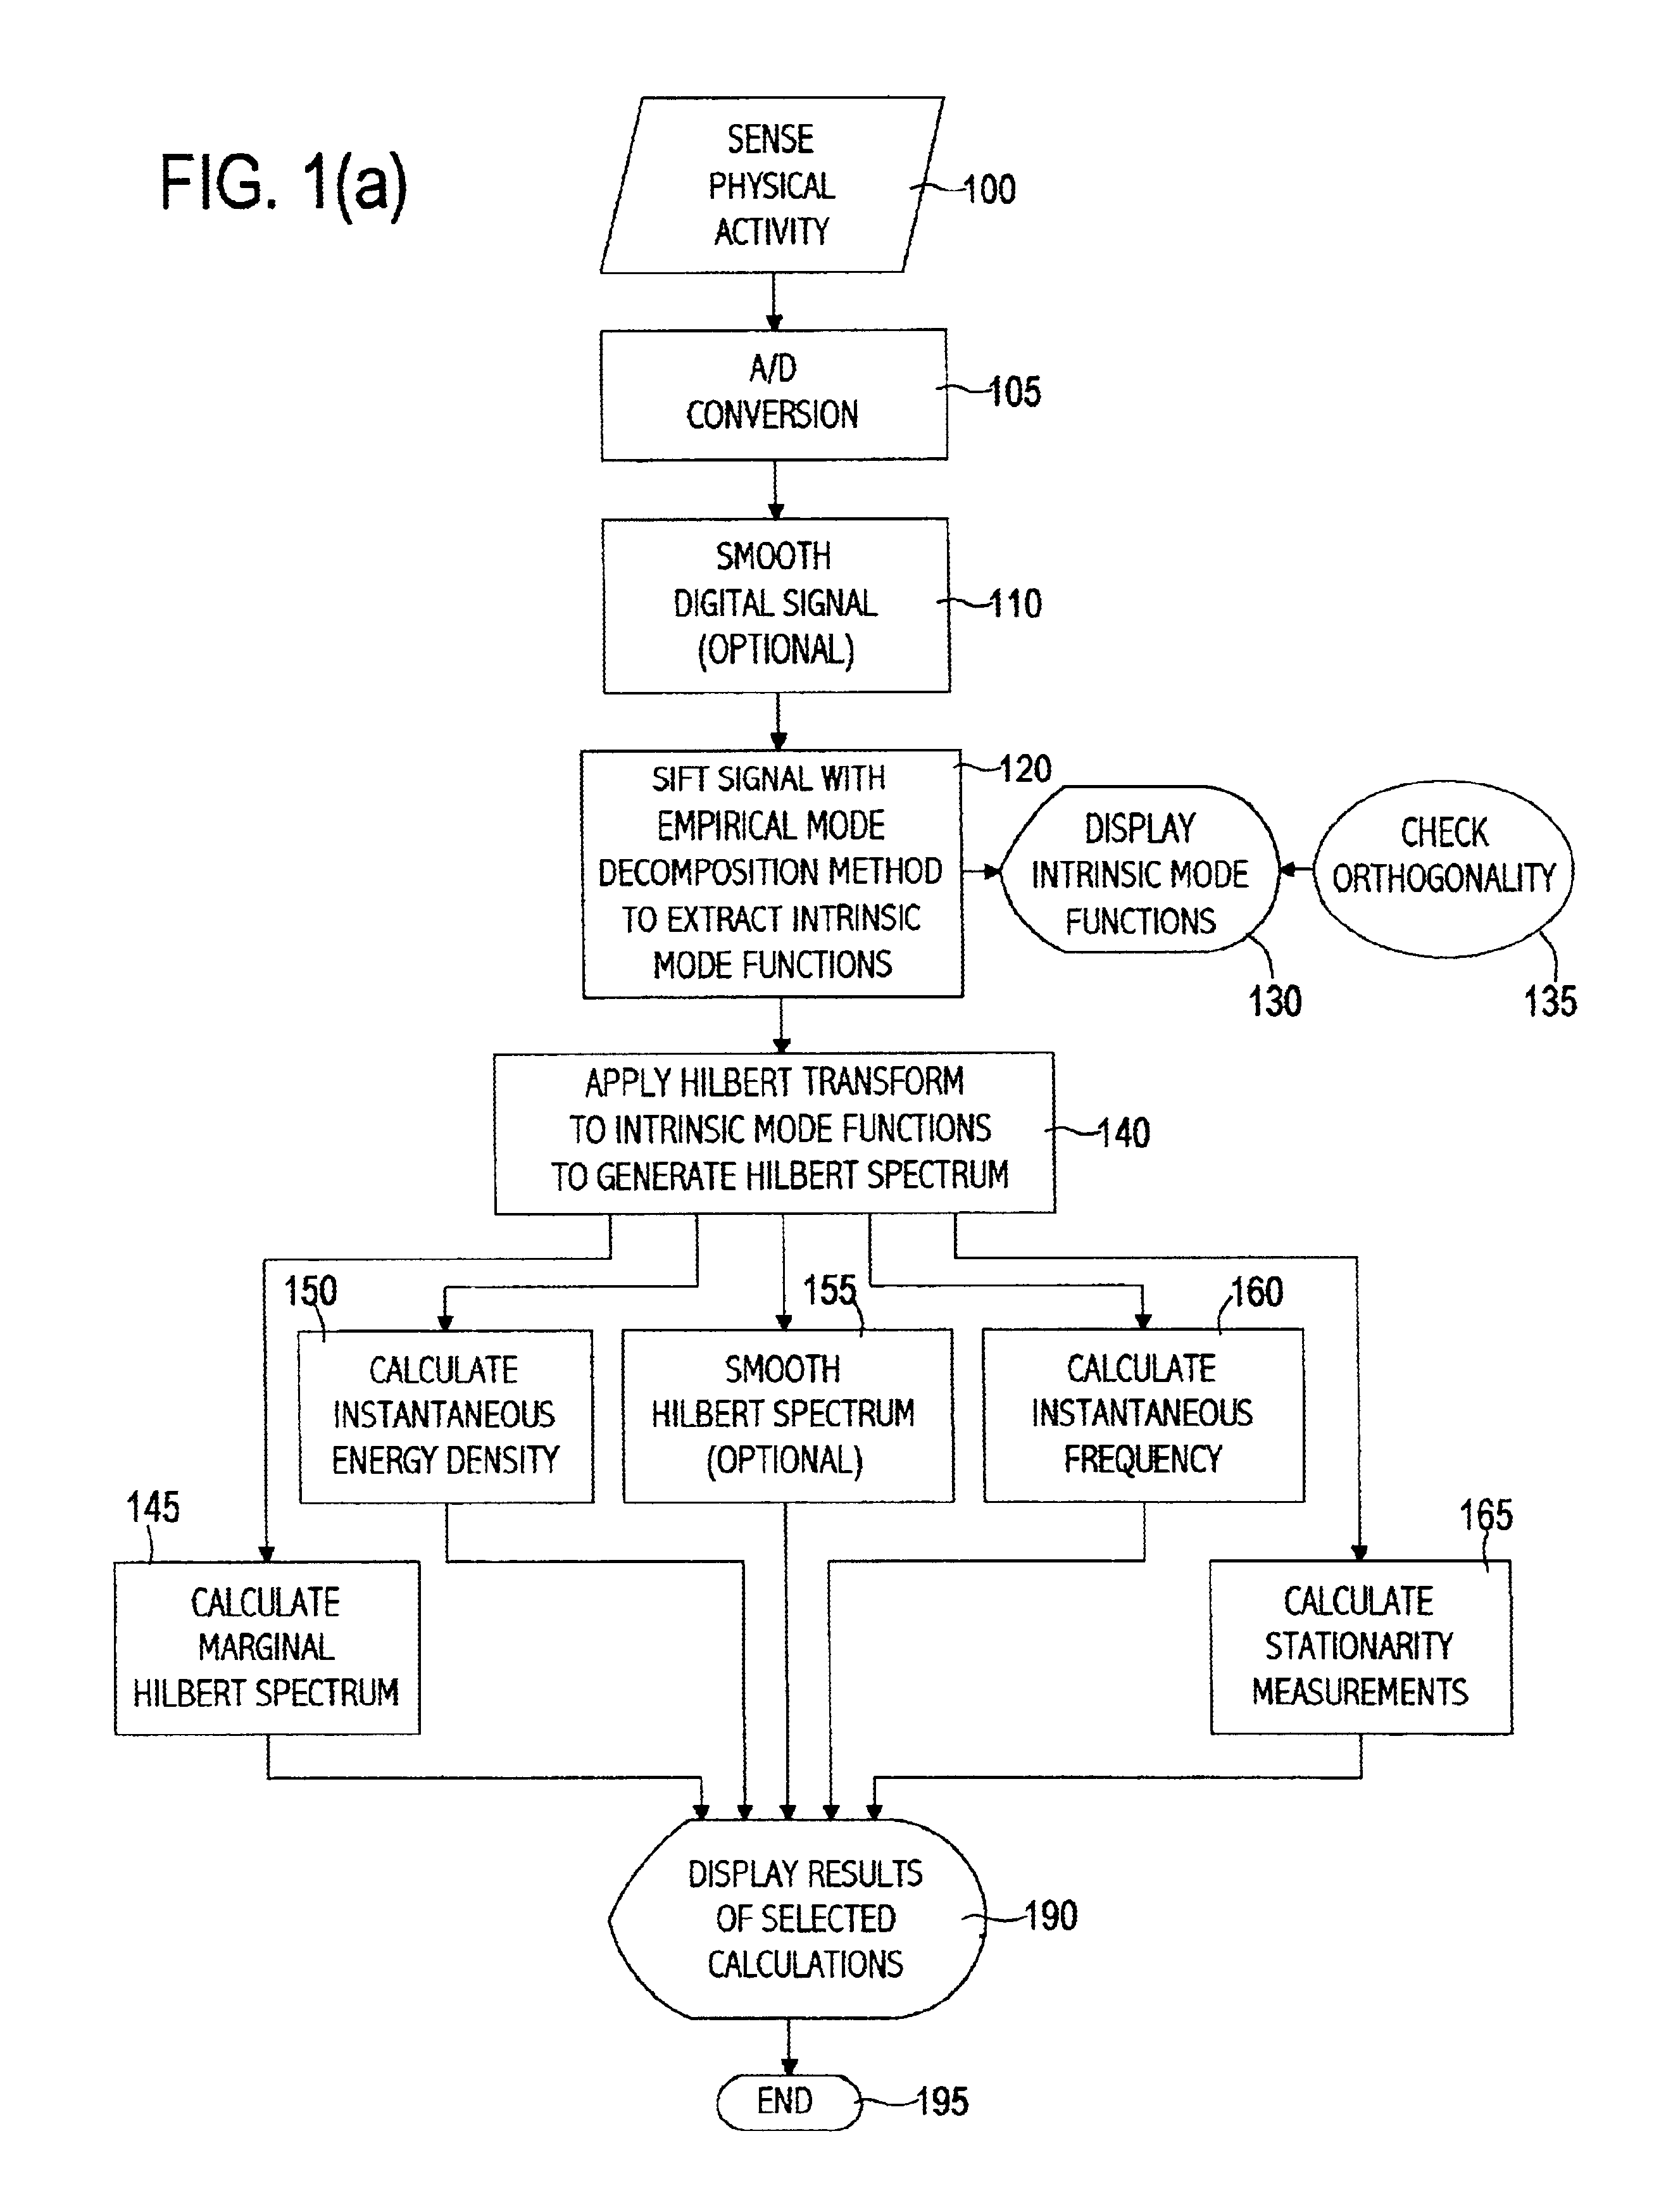
Before describing the computer implemented Empirical Mode Decomposition method in detail and its application to biological data and acoustical data, the definition and physical meaning of intrinsic mode functions in general will be discussed.

Intrinsic Mode Function

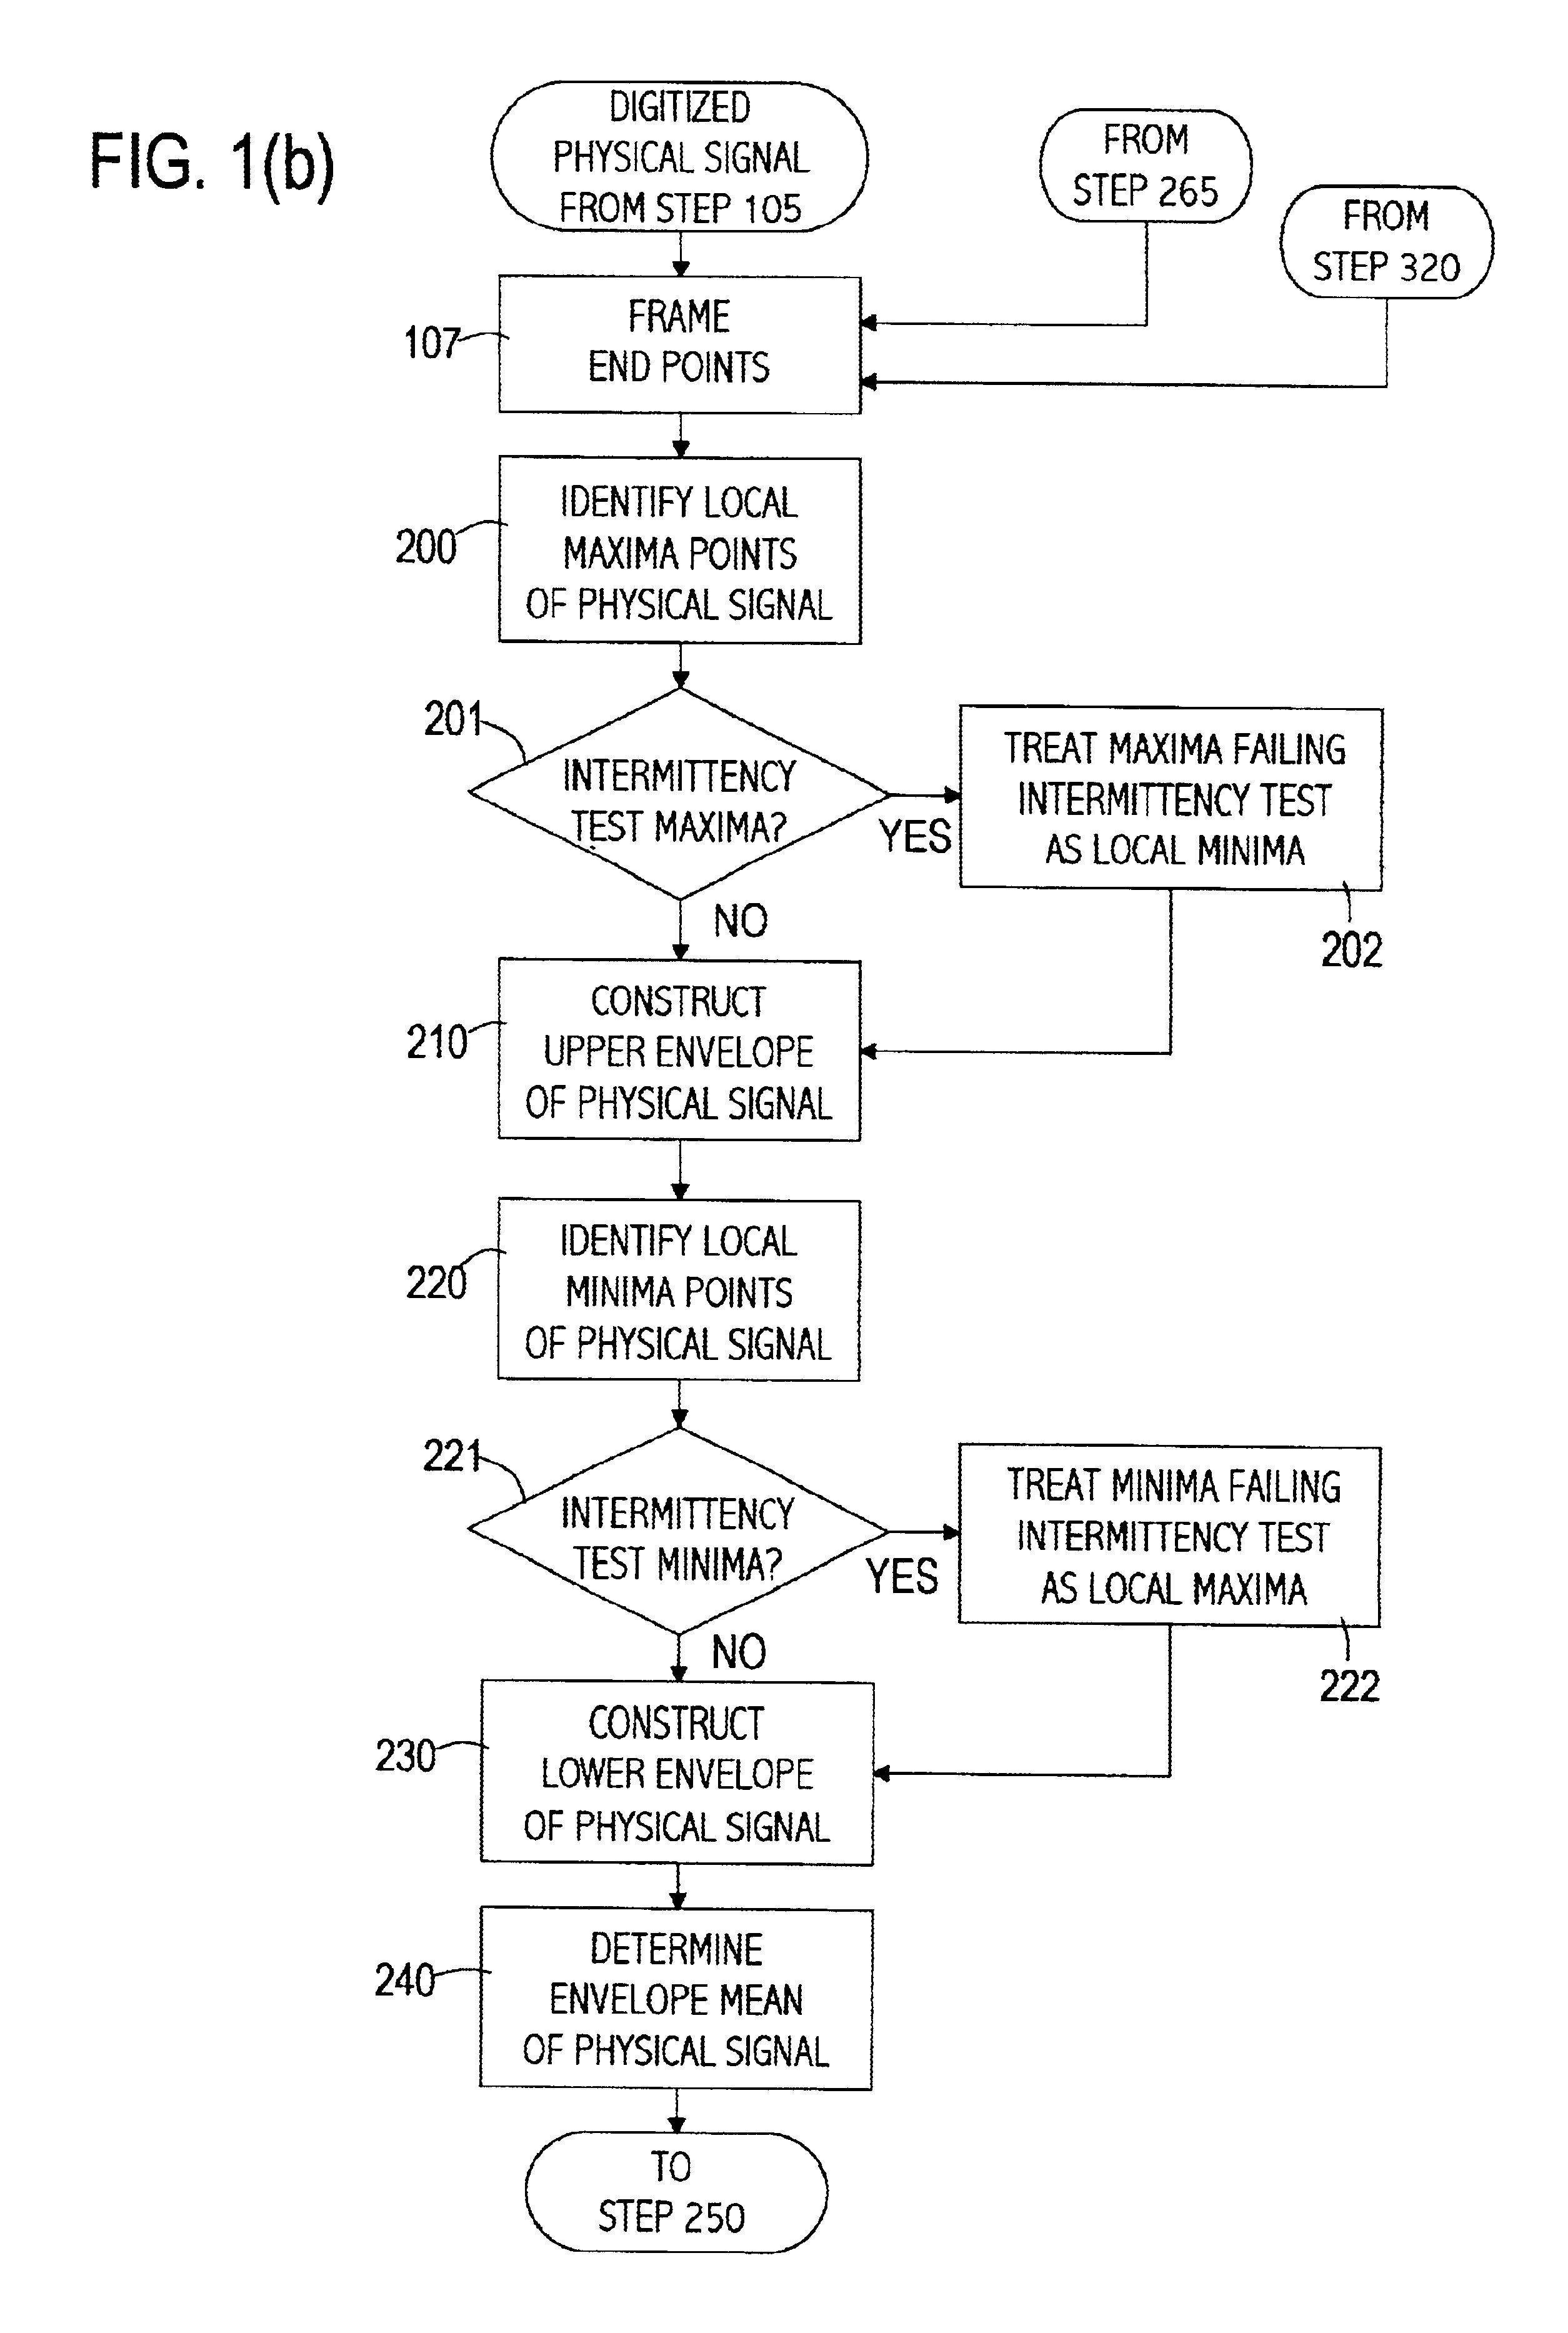
An Intrinsic Mode Function (IMF) is a function that satisfies the following two conditions:(a) in the whole data set, the number of extrema and the number of zero-crossings must either be equal or differ at most by one, and(b) at any point, the mean value of upper envelope defined by the maxima and the lower envelope defined by the minima is zero.

The first condition shares some similarity to the traditional narrow band requirements for a stationary Gaussian process. The second condition is a totally new idea. Conceptually, the second condition modifies the classical global requirement to a local one. Furthermore, the second condition has the desirable result that the instantaneous frequency will not have unwanted fluctuati...


PUM


Abstract

The present invention discloses a computer implemented signal analysis method through the Hilbert-Huang Transformation (HHT) for analyzing acoustical signals, which are assumed to be nonlinear and nonstationary. The Empirical Decomposition Method (EMD) and the Hilbert Spectral Analysis (HSA) are used to obtain the HHT. Essentially, the acoustical signal will be decomposed into the Intrinsic Mode Function Components (IMFs). Once the invention decomposes the acoustic signal into its constituting components, all operations such as analyzing, identifying, and removing unwanted signals can be performed on these components. Upon transforming the IMFs into Hilbert spectrum, the acoustical signal may be compared with other acoustical signals.

Description

COPYRIGHT NOTIFICATIONPortions of this patent application contain materials that are subject to copyright protection. The copyright owner has no objection to the facsimile reproduction by anyone of the patent document or the patent disclosure, as it appears in the Patent and Trademark Office patent file or records, but otherwise reserves all copyright rights whatsoever.BACKGROUND OF THE INVENTIONThis invention generally relates to a signal analysis method. The results of processing several examples of biological and acoustical signals are discussed herein to show the particular utility of the invention in that field and to further demonstrate the broad applicability of the invention.Although the present invention finds utility in processing acoustical signals, it is to be understood that any signal representative of a real world phenomenon such as a signal representative of a physical process including electrical, mechanical, biological, acoustical, chemical, optical, geophysical or...

Claims


Application Information

Patent Timeline
Patent Type & Authority Patents(United States)
IPC IPC(8): G06F17/14G10L21/00G10L19/00G10L21/02G10L19/02G10L15/00G10L15/20
CPCG06F17/14G06F17/141G10L21/0208G10L19/0212G10L15/20
Inventor HUANG, NORDEN E.
Owner NAT AERONAUTICS & SPACE ADMINISTATION UNITED STATES GOVERNMENT AS REPRESENTED BY THE ADMINISTATOR OF THE
Why Eureka
Try Eureka