
Procedure for processing measuring data and device to perform the process

Inactive Publication Date: 2006-10-03
AGILENT TECH INC
View PDF8 Cites 2 Cited by
  • Summary
  • Abstract
  • Description
  • Claims
  • Application Information

AI Technical Summary

Benefits of technology

[0022]It is thus a task of the invention to create a procedure with which it is possible to achieve more accurate and more precise measuring results in a simple manner and / or to monitor the quality of the measurement system when using a measurement system to determine measuring values that depend on at least two variables.
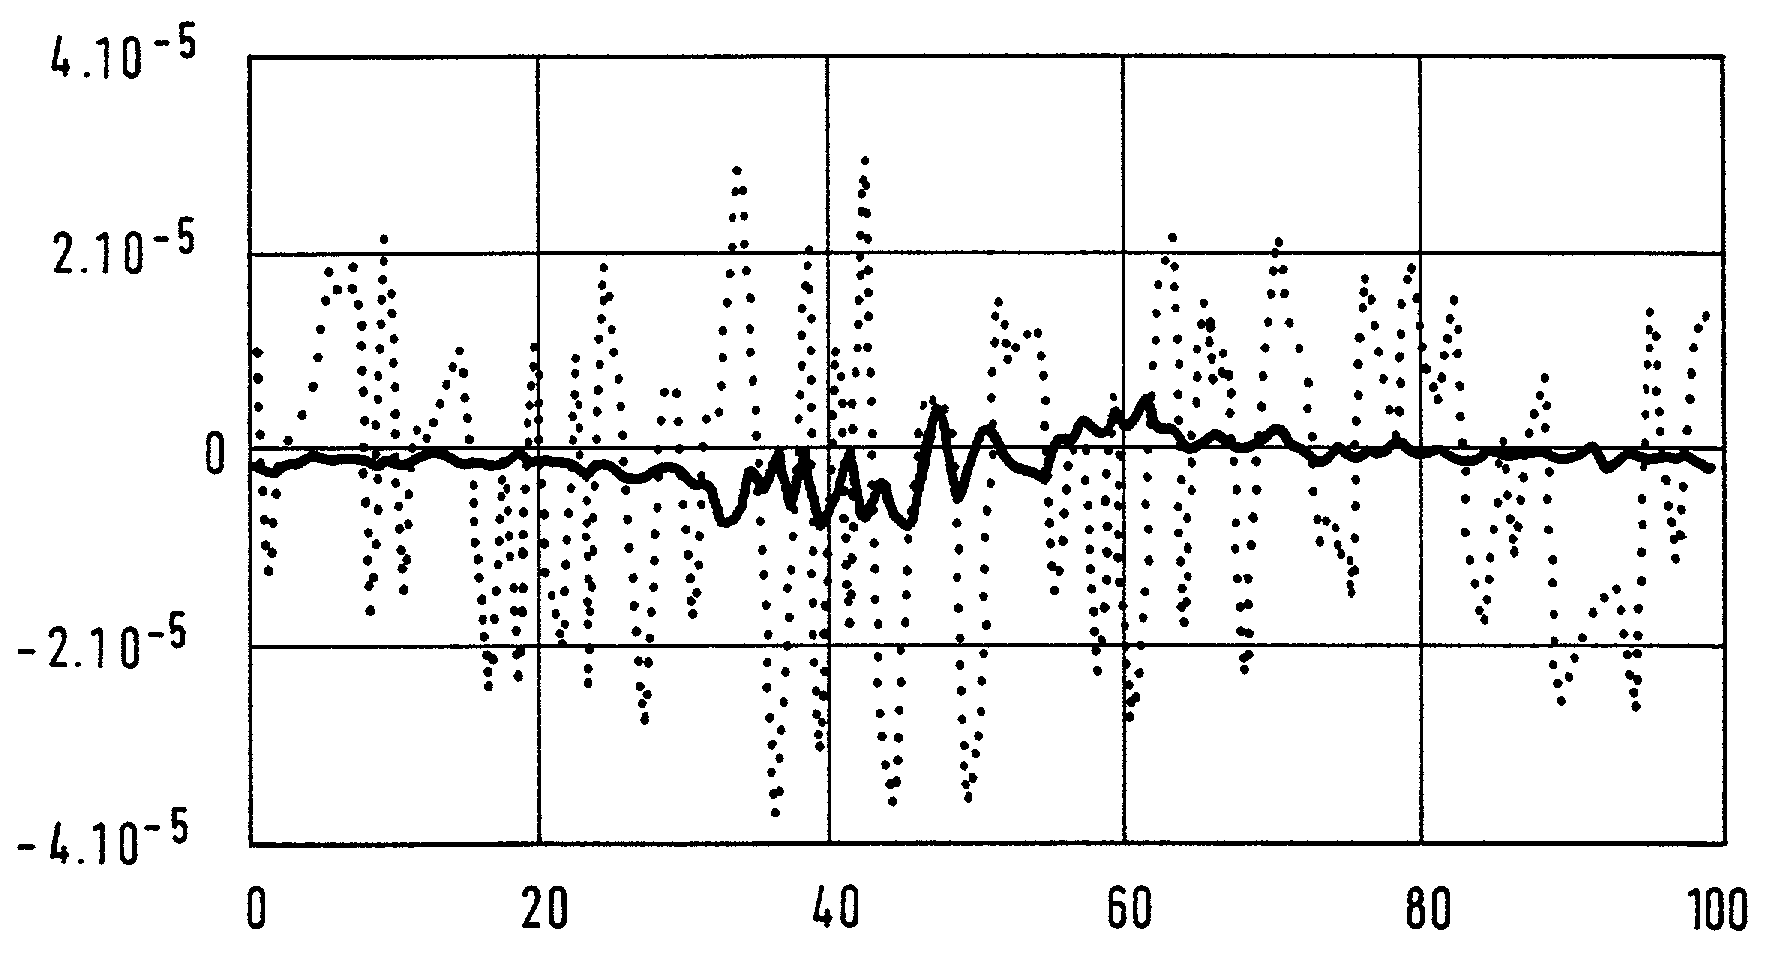
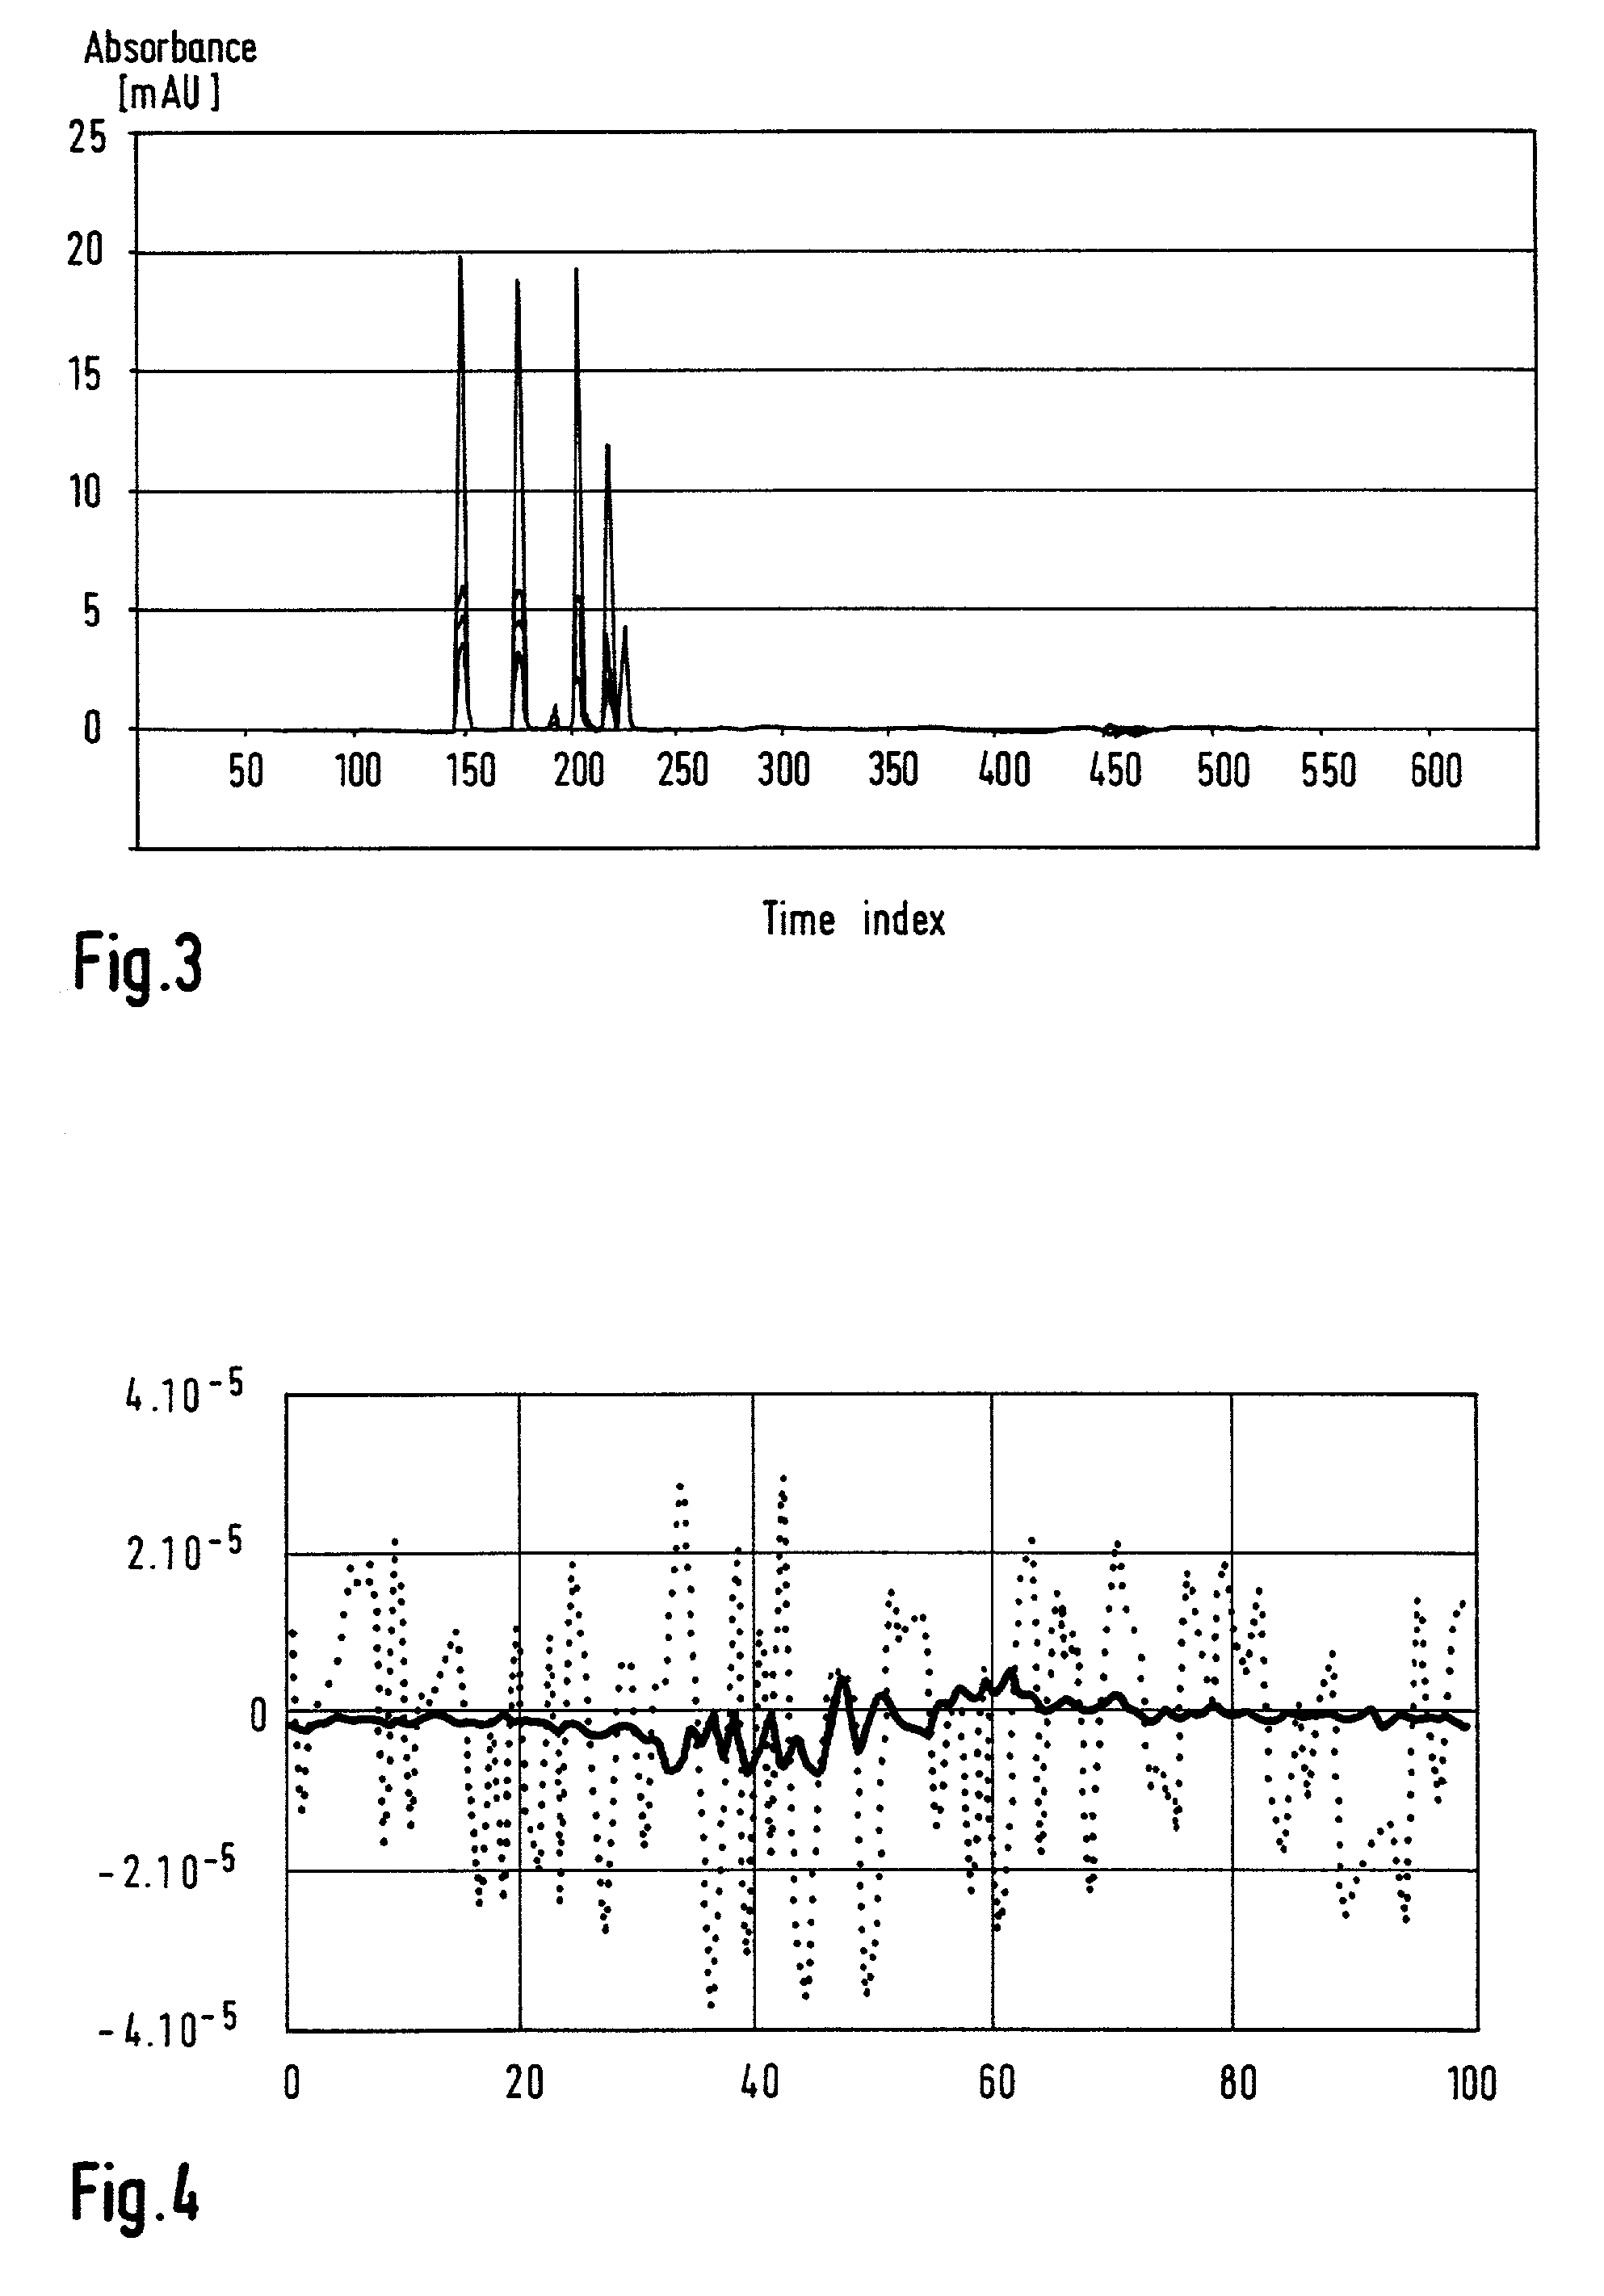
[0029]In a following measuring step, for example in analytic measurements, the individual carriers of useful information, in particular the substances or substance mixtures to be analyzed, which were separated by chromatographic separation methods, are analyzed individually. At any point in time, the measuring data are separated into linear components using mathematical methods based on the effect vectors used. When doing so, the error contributions, i.e. the intensities of the respective error effects, are preferably determined with multi-linear regression or vector multiplication. Using these error contributions or error coefficients, the useful information corrected for the systematic measuring errors can be easily determined.
[0030]The procedure according to the invention is thus a particularly easy way of achieving measuring results that are much more accurate and precise than in the past. By separating the measured signal into all contributing effects in a suitable manner, this procedure can be used effectively for a signal analysis. This procedure can also be used effectively in the diagnosis of all kinds of disturbance effects, i.e. as a diagnostic aid for monitoring the measurement system.
[0056]This procedure yields the most precise results and has the further advantage that even for not separated substances, the time course of concentrations for not completely separated peaks can be calculated by including additional spectra into the multi-linear regression model. In this case, it is effective to determine the spectra at least at the begin of the peak, at the peak maximum, and at the end of the peak. The spectra to be included in the multi-linear regression model are determined with known procedures, such as a multi-component analysis.

Problems solved by technology

For measurement systems using DAD's, the measured data is subject to a number of undesired influence quantities that can affect the accuracy and reliability of the measuring results.
Such variations in time cause errors in the measuring data.
Due to fluctuations of the environmental conditions and because of the thermal expansion of the materials used, the imaging properties of the optical equipment are affected.
This also causes errors in the measuring results.
This means that during the analysis, the optical properties of the mobile phase are also changing due to the dynamic change in index of refraction and absorption characteristics, thus sometimes considerably affecting the measuring results.
An addition, pressure fluctuations, caused by the solvent pumps, adversely affect the optical properties.
Random noise superimposed over the measuring values is caused by stochastic processes occurring during the emission of light by gas discharge and during the detection of the photons by a photo sensor.
In addition, there are noise terms caused by the circuits of the electronic signal processing system or by influences of the surroundings.
The noise adversely affects the accuracy of the measuring results and reduces the limit of detectability of the measurement system.
However, this is done at the expense of the time or spectral resolution of the signals.
It has always been a challenge in the design of measurement devices to minimize the effects of influence quantities in order to avoid significantly distorting the measuring results.
In the past, some complex approaches have been realized to fulfill the requirements.
On closer examination, however, it becomes evident that two optical paths with identical properties can hardly be realized.
Difficulties occur because the analysis path contains the actual flux cell while a model of such a flux cell is contained in the reference path.
When using traditional approaches, the problems resulting from the dependence of the index of refraction on different factors can only be improved through complicated optical constructions and usually only at the expense of the light flux rate.
This adversely affects the limits of detectability.
Furthermore, it should be noted that because of the lower light flux rate due to the splitting of the optical ray trajectory on one hand and due to the additional noise source due to the reference path on the other hand, the noise contribution of the measurement system is made considerably worse.
Not only are the costs increased compared to simpler designed measurement systems, but a number of unfavorable compromises have to be accepted as well.
In the meantime, technology has reached a state wherein hardly any improvements can be achieved through constructional measures with acceptable cost and effort.
However, the disadvantage of filtering the data is the adverse effect on the time and / or spectral resolution of the signals.
Further efforts also become meaningless when the systematic error contributions are dominating and reducing the accuracy.

Method used


Image

  • Procedure for processing measuring data and device to perform the process
  • Procedure for processing measuring data and device to perform the process
  • Procedure for processing measuring data and device to perform the process

Examples


Embodiment Construction

[0073]The procedure according to the invention can be used advantageously to process measuring data that are determined by using a chromatographic analyzing system, wherein the measuring data corresponds to certain absorption values. These absorption values represent useful information about, or of, a technical process, wherein the process is a chromatographic substance analysis.

1. Measurement System

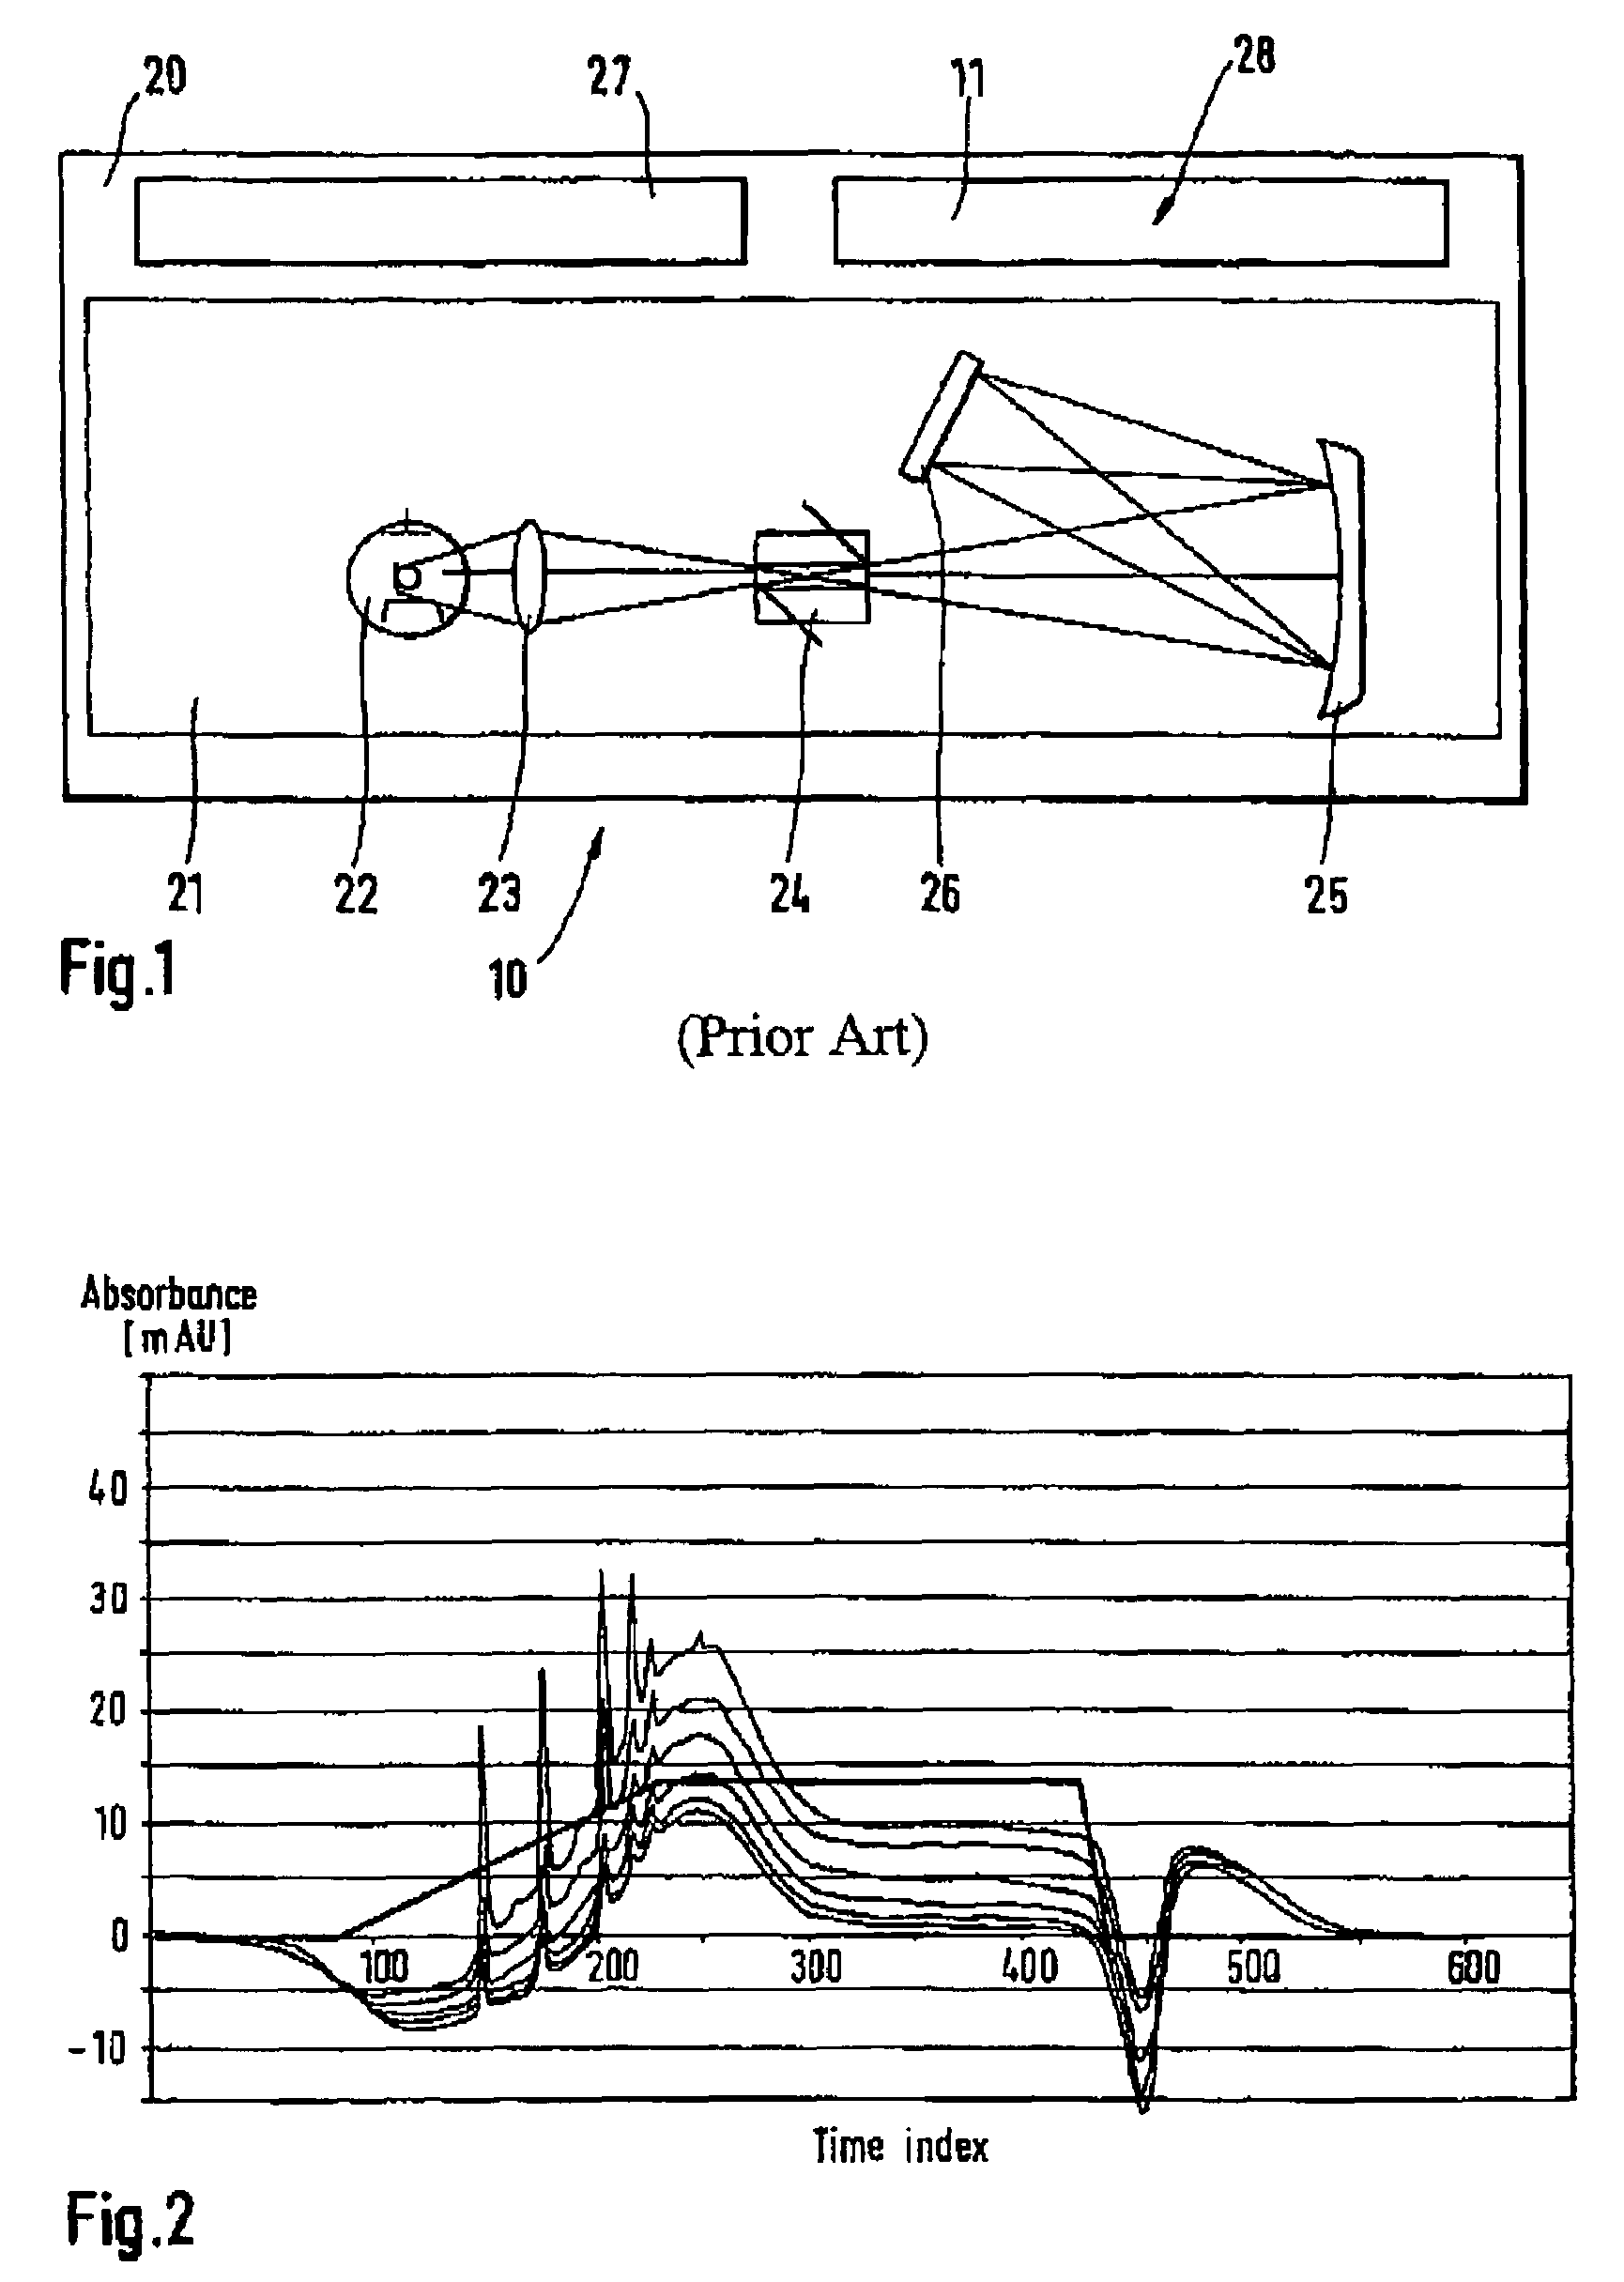
[0074]For the measurement system 10, an absorption measurement system 20 with a diode array sensor 26 is usually used for a chromatographic analysis. With the diode array sensor 26, the absorption values of the substances to be analyzed can be determined for certain measured wavelengths over time.

[0075]The construction of such an absorption measurement system 20 can be seen from the block diagram shown in FIG. 1. The optical unit 21 of the absorption measurement system 20 contains the following essential elements: a light source 22, a lens or a lens system 23, a flux cell 24, a lattice 2...


PUM


Abstract

A method for processing measuring data and a device to perform the method, wherein the measuring data can be determined by using a measurement system, more particularly a chromatographic analyzing system, for the measurement of measuring values that correspond to certain information about, or of, a technical process and that depend on at least two variables.

Description

FIELD OF THE INVENTION[0001]The invention concerns a procedure for processing measuring data that can be measured by using a measurement system for measuring data, which corresponds to certain useful information about, or of, a technical process, and which depend on at least two variables, and a device to carry out the procedure.DISCUSSION OF THE BACKGROUND ART[0002]Such a two-dimensional measuring data structure can be found, for example, in analytic measurement systems, in particular in the field of UV / VIS absorption measurement technology. In this case, diode array detectors (DAD's) are used. Diode array detectors are constantly gaining importance because, firstly, the UV / VIS absorption measurement procedure represents the most significant of the various analytic detection techniques and, secondly, DAD's generate online signals corresponding to the wavelength (spectra) and to time (chromatograms). UV / VIS absorption measurement technology is a good compromise between high sensitiv...

Claims


Application Information

Patent Timeline
IPC IPC(8): G01D18/00G06F19/00G06F17/00
CPCG01N30/8665G01N2030/625
Inventor KUDERER, HUBERT
Owner AGILENT TECH INC
Learn More