
System and method for indicating the presence or physical location of persons or devices in a site specific representation of a physical environment

a technology of site specific representation and management system, which is applied in memory systems, special data processing applications, program control, etc., can solve the problems of insufficient coverage, interference, and the cost of in-building and microcell devices providing wireless coverage, so as to achieve different levels of desired performance, improve the effect of interferen

Active Publication Date: 2007-11-13
EXTREME NETWORKS INC
View PDF123 Cites 495 Cited by
  • Summary
  • Abstract
  • Description
  • Claims
  • Application Information

AI Technical Summary

Benefits of technology

[0037]Until the present invention, it has not been possible for a wireless network technician or manager to design a network ahead of time with a particular site-specific design application, and then use that same application for real-time or near real-time design, management and control of that same network. The current invention provides a significant value to the networking community, since original documentation and knowledge created during the design phase can now be reused time and again with no additional effort, in the same application for network control and smart network management. Thus, the invention provides a new kind of network application that enables complete management, measurement, design, and maintenance for any wireless network in an on-going, seamless, and adaptive manner.
[0038]As in-building wireless LANs and microcell wireless systems proliferate, all of the issues facing network installers, carriers, and network technicians may now be resolved quickly, easily, and inexpensively using the current invention. Just as CAD tools are used by engineers and IT professionals to design and deploy a wireless network by considering the performance of components while they also consider multiple, potentially unrelated, factors before the actual deployment of a network, we now disclose a novel method and system that uses powerful CAD capabilities with adaptive algorithms and real time communication links to provide a computational engine for network control and provisioning of wireless data networks, after the network is installed using the same application. The current invention displays network performance while providing adaptive control of network performance in a manner easily interpretable by network engineers or technicians. With the present invention, it becomes possible for a user to visualize and set network performance requirements, while the invention provides simulations that in turn provide feedback signals to the wireless hardware under control for proper network adjustments that are adjusted in real-time or in a delayed fashion to meet the newly described network conditions derived from simulation.
[0039]Two dimensional (2-D) and three dimensional (3-D) visualization of wireless system operating parameters, desired operating performance values and / or metrics, and actual measured operating metrics provided in a site-specific model of a network environment provides the user with rapid assimilation of large data sets and their relation to the physical environment, as well as with a control mechanism by which to alter network performance.

Problems solved by technology

As data communications use increases, radio frequency (RF) coverage within and around buildings and signal penetration into buildings from outside transmitting sources has quickly become an important design issue for network engineers who must design and deploy cellular telephone systems, paging systems, wireless or wired computer networks, or new wireless system is and technologies such as personal communication networks or wireless local area networks (WLANs).
A common problem for wireless networks is inadequate coverage, or a “dead zone” in a specific location, such as a conference room.
Such dead zones may actually be due to interference, rather than lack of desired signal.
It is understood that an indoor wireless PBX (private branch exchange) system or wireless local area network (WLAN) can be rendered useless by interference from nearby, similar systems.
The costs of in-building and microcell devices which provide wireless coverage are diminishing, and the workload for RF engineers and technicians to install and manage these on-premises systems is increasing sharply.
While most of the above papers describe a comparison of measured versus predicted RF signal coverage, or describe methods for representing and displaying predicted performance data, they do not report a comprehensive method for optimizing or adjusting the parameters of equipment settings such as power levels, channelization, or data rates, etc. within an environment to affect a desired behavior in an actual operating network or a planned network.
Furthermore, the above mentioned propagation papers do not teach a way to autonomously allow a network to be properly provisioned for the allocation of multiple classes of data users in a wireless network, nor do they teach any type of display of such performance or the comparisons of predicted versus measured performance that would be due to proper feedback of predicted performance results to the operational wireless infrastructure.
While other prior art listed below considers network adaptive control and feedback based on simulation or preset specifications, no work has considered using a site-specific wireless environmental model, that allows a user to simultaneously view the physical environment, control network performance parameters, and see the performance of the network in an adaptive manner.
Additionally, no one has considered the importance of properly configuring, regulating, or controlling the wireless infrastructure in order to properly provision various classes of simultaneous wireless data users in an in-building network, where accurate site-specific propagation modeling is at the heart of driving and setting operating points of an in-building network, so that proper ongoing performance can be carried out in real-time or near real-time as the network changes over time and space.
The “Radio Propagation” and “Site-Specific” papers make reference to 3-D modeling, but do not offer novel methods for utilizing the 3-D modeling to carry out automatic equipment configurations or parameter adjustments, nor do they contemplate any type of autonomous control or feedback that uses the predictions to drive, in real time, the actual network performance.
In many cases, the wireless network interferes with itself, forcing the designer to carefully analyze many different equipment configurations in order to achieve proper performance.
There are many computer aided design (CAD) products on the market that can be used to aid in some manner for wireless design or optimization, but none consider the in-building data scenario with site-specific control and autonomous feedback for network provisioning and scheduling in and around buildings and campuses.
PLAnet also provides facilities for optimizing the channel settings of wireless transceivers within the environment, but does not provide for further adaptive transceiver configurations beyond channel settings.
None of the aforementioned design tools have an automated facility for determining the ideal configurations or establishing pre-set operating points for wireless LAN transceivers or other data-centric modems modeled in a site-specific environment in order to achieve some optimal or desired overall or individual network performance.
Furthermore, none of the aforementioned design tools contemplate an automated facility for determining the ideal configurations for wireless data transceivers modeled in a 3-D environment in order to achieve some optimal network performance, while simultaneously displaying the physical location of network assets on a site-specific model of the physical environment.
Optimizer™, however, does not consider the physical environment or the detailed specifications or site-specific placements or interconnections of equipment involved in the network, thereby failing to offer the added benefit of visualization of network configuration (valuable for design, deployment, and on-going maintenance, since indoor wireless antennas are often hidden), and further suffering from less accurate modeling since site-specific data is not used by the application.
In addition, because Optimizer™ requires measurement data from an existing network, it is not applicable to networks being planned and not yet deployed.
ScoreBoard™, however, does not consider the physical environment or the detailed specifications or site-specific placements or interconnections of equipment involved in the network, thereby failing to offer the added benefit of visualization of network configuration (valuable for design, deployment, and on-going maintenance since indoor network components such as antennas are often hidden), and further suffering from less accurate modeling since site-specific propagation or environmental data is not used by the application.
In addition, because ScoreBoard™ requires measurement data from an existing network, it is not as applicable to networks being planned and not yet deployed.
OPAS32, however, does not consider the physical environment or the detailed specifications or site-specific placements or interconnections of equipment involved in the network, thereby failing to offer the added benefit of visualization of network configuration (valuable for design and on-going maintenance), and further suffering from less accurate modeling since site-specific data is not used by the application.
In addition, because OPAS32 requires measurement data from an existing network, it is not applicable to networks being planned and not yet deployed.
E-NOS™, however, does not consider the physical environment or the detailed specifications or site-specific placements or interconnections of equipment involved in the network, thereby failing to offer the added benefit of visualization of network configuration (valuable for design and on-going maintenance), and further suffering from less accurate modeling since site-specific data is not used by the application.
In addition, because E-NOS™ requires measurement data from an existing network, it is not applicable to networks being, planned and not yet deployed.
Visional does not use site-specific environmental information or wireless prediction methods for predicting or measuring network performance, nor do they provide support for predicting, measuring, optimizing or controlling parameters that are fundamental to wireless networks.
Furthermore, they do not provide means for controlling a wide range of wireless network users for desired performance throughout a network.

Method used


Image

  • System and method for indicating the presence or physical location of persons or devices in a site specific representation of a physical environment
  • System and method for indicating the presence or physical location of persons or devices in a site specific representation of a physical environment
  • System and method for indicating the presence or physical location of persons or devices in a site specific representation of a physical environment

Examples


Embodiment Construction

[0106]Using the present method, it is now possible to improve the performance and ongoing management of a communication network to a much higher level of precision than previously possible, at substantially reduced cost and complexity. The present method is a significant advance over the prior art in the automated use of predicted or measured performance metrics to determine and drive a preset, desired, or optimal or preferred configuration of communication system infrastructure. The invention provides significant cost savings through the use of software that may used in many different phases of the life cycle of a network, while providing simultaneous capabilities in design, performance prediction, remote monitoring, and adaptive simulation and control of wireless infrastructure. The design of communication systems is often a very complex and arduous task, with a considerable amount of effort required to simply analyze the results of system performance.

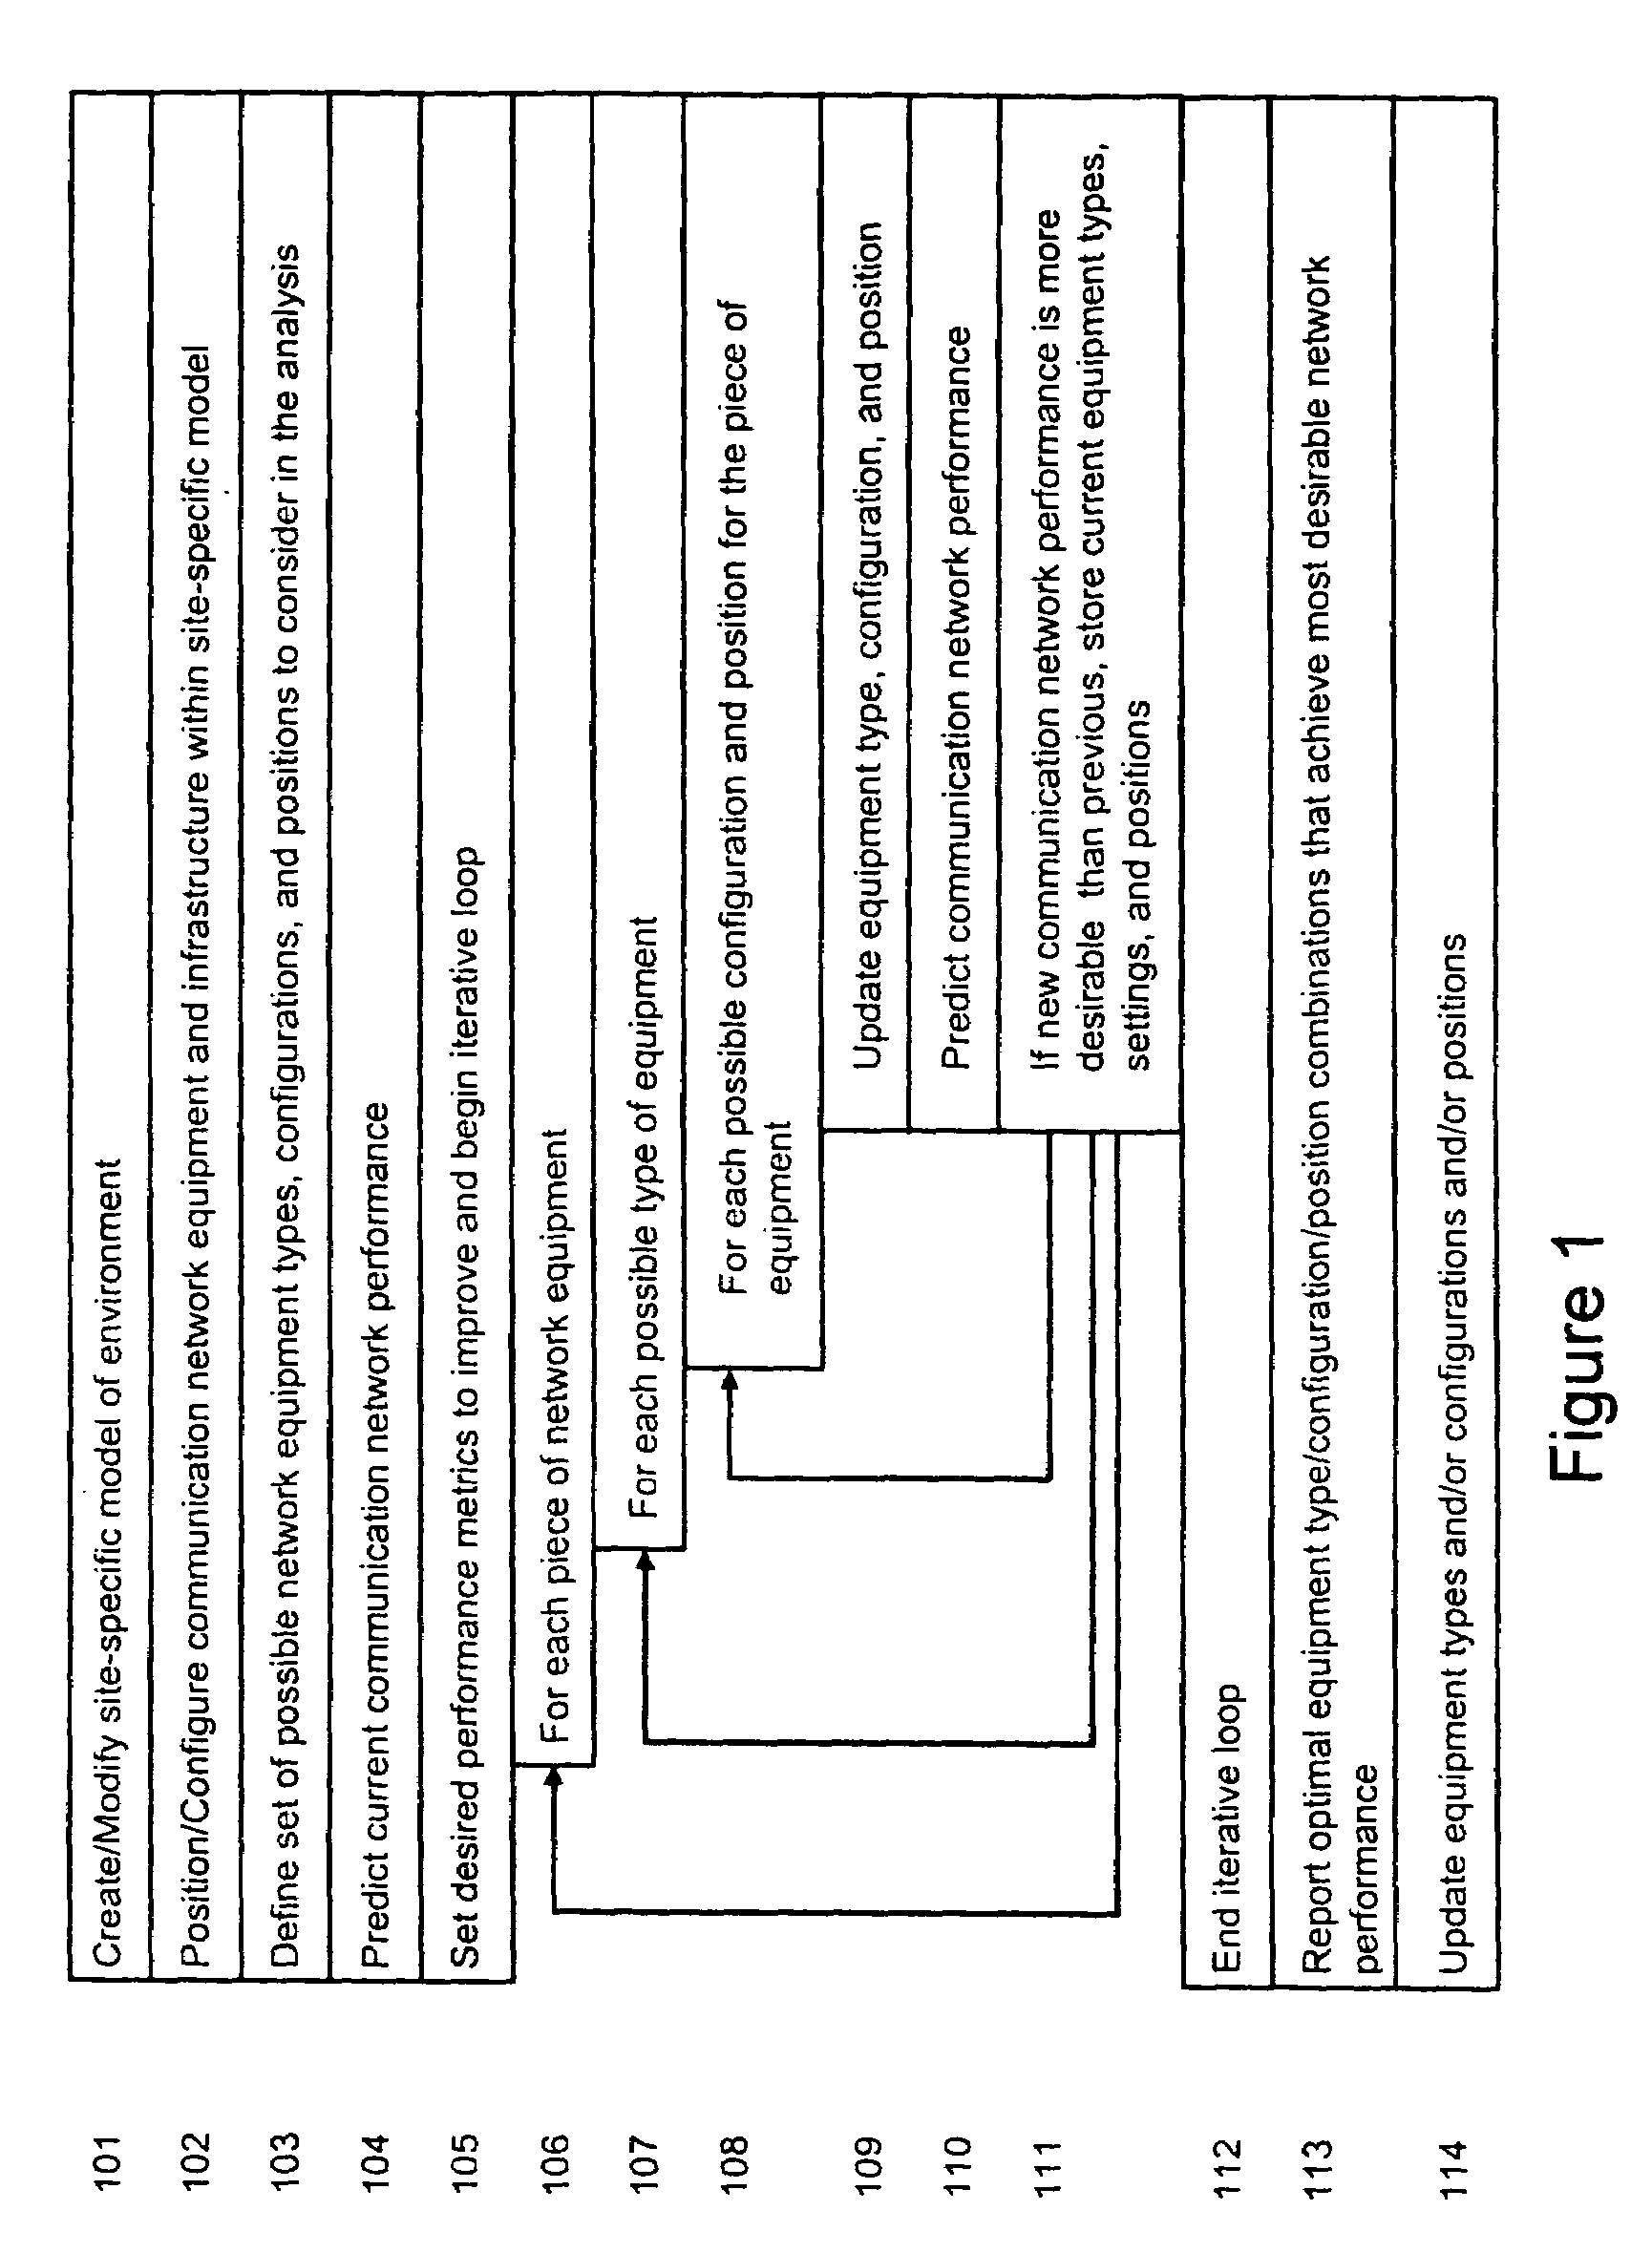
[0107]Referring now to FIG. 1...


PUM


Abstract

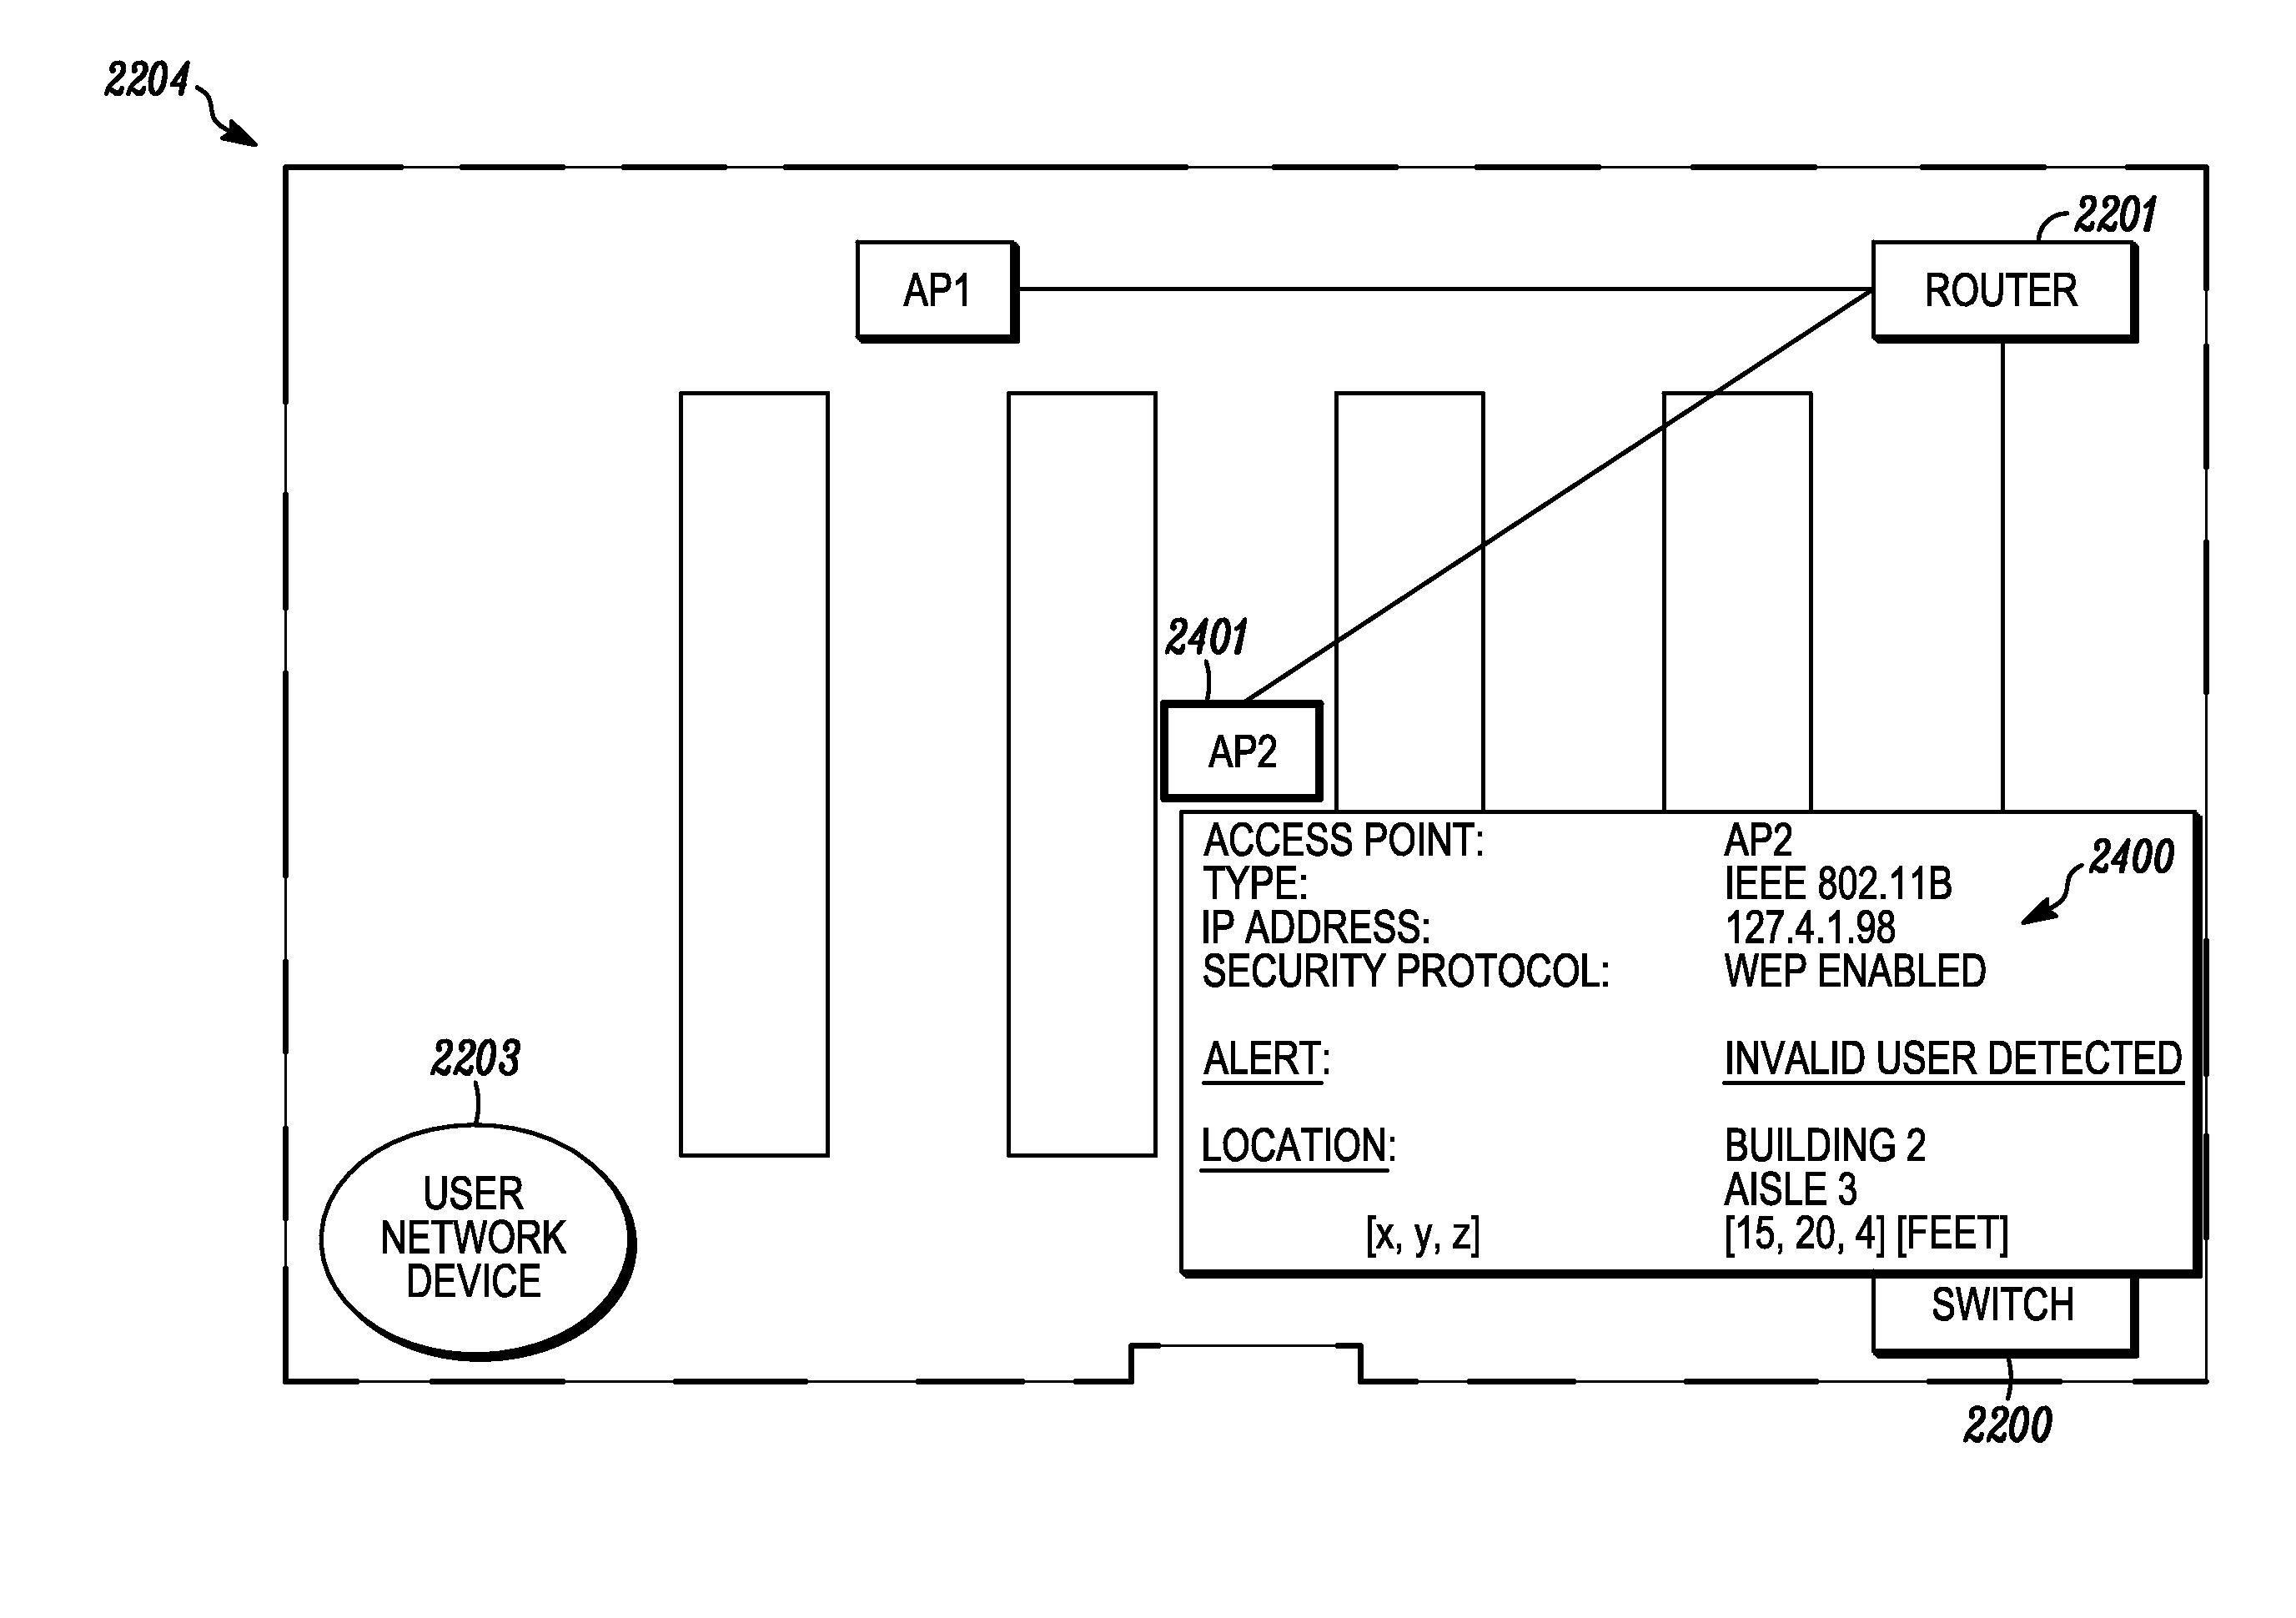
A system and method for providing security to a wireless communication system having wireless communication components positioned at different locations within a physical environment are provided. The wireless communication components include an access point and a network device. A site-specific computerized representation of the physical environment displays the location of the wireless communication components including the access point and network device. The access point and network device identify the presence or a physical location of a possible intruder or intruder devices. An indicator is presented in the site-specific representation on the display when an erroneous authentication request or other undesired transmission is received by the network device or the access point.

Description

CROSS-REFERENCE TO RELATED APPLICATIONS[0001]This application is a continuation-in-part (CIP) application of U.S. Ser. No. 10 / 386,943 filed Mar. 13, 2003 and claims priority to 60 / 441,315 filed Jan. 22, 2003. The application is related to U.S. Pat. No. 7,055,107 and U.S. Pat. No. 7,164,883, and the complete contents of these patents are herein incorporated by reference. The invention described is also related to U.S. Pat. No. 6,317,599, U.S. Pat. No. 6,442,507, U.S. Pat. No. 6,493,679, and U.S. Pat. No. 6,499,006 and the complete contents of these patents are herein incorporated by reference.BACKGROUND OF THE INVENTION[0002]1. Field of the Invention[0003]The present invention generally relates to engineering and management systems for the design and on-going operation of wireless and wired communication networks or systems and, more particularly, to a method for determining and maintaining the proper configuration of wireless or wired network hardware in terms of power output, gain,...

Claims


Application Information

Patent Timeline
Patent Type & Authority Patents(United States)
IPC IPC(8): G08B13/14G01V15/00G06FG06F1/00G06F9/45G06F17/10G06F17/50G08B13/22H04L9/32H04L12/22H04L12/24H04L12/26H04L12/28H04L29/02H04W12/12H04W16/20H04W24/00
CPCG06F17/509G06Q10/087H04L12/2602H04L41/12H04L41/22H04L43/00H04W12/12H04W16/20H04W24/00G06F2217/06H04L41/06H04L41/5003H04L43/0823H04L43/0847H04L43/0852H04L43/0864H04L43/087G06F2217/04G06F2111/02G06F30/18G06F2111/04G06F30/13Y04S40/20H04W12/122H04W12/64H04L12/28
Inventor RAPPAPORT, THEODORE S.SKIDMORE, ROGER R.
Owner EXTREME NETWORKS INC
Learn More