

Spectroscopic methods for component particle analysis
a component particle and spectroscopic method technology, applied in the field of hyperspectral analysis of particle size, morphology, spatial distribution, can solve the problems of inability to distinguish two particles that only differ in chemical composition, significant differences in the pharmacological properties of the two compositions, and limitations of each of these techniques
- Summary
- Abstract
- Description
- Claims
- Application Information
AI Technical Summary
Benefits of technology
Problems solved by technology
Method used
Image

Examples
example 1
[0157]RCI Assessment of Nasal Spray Preparation
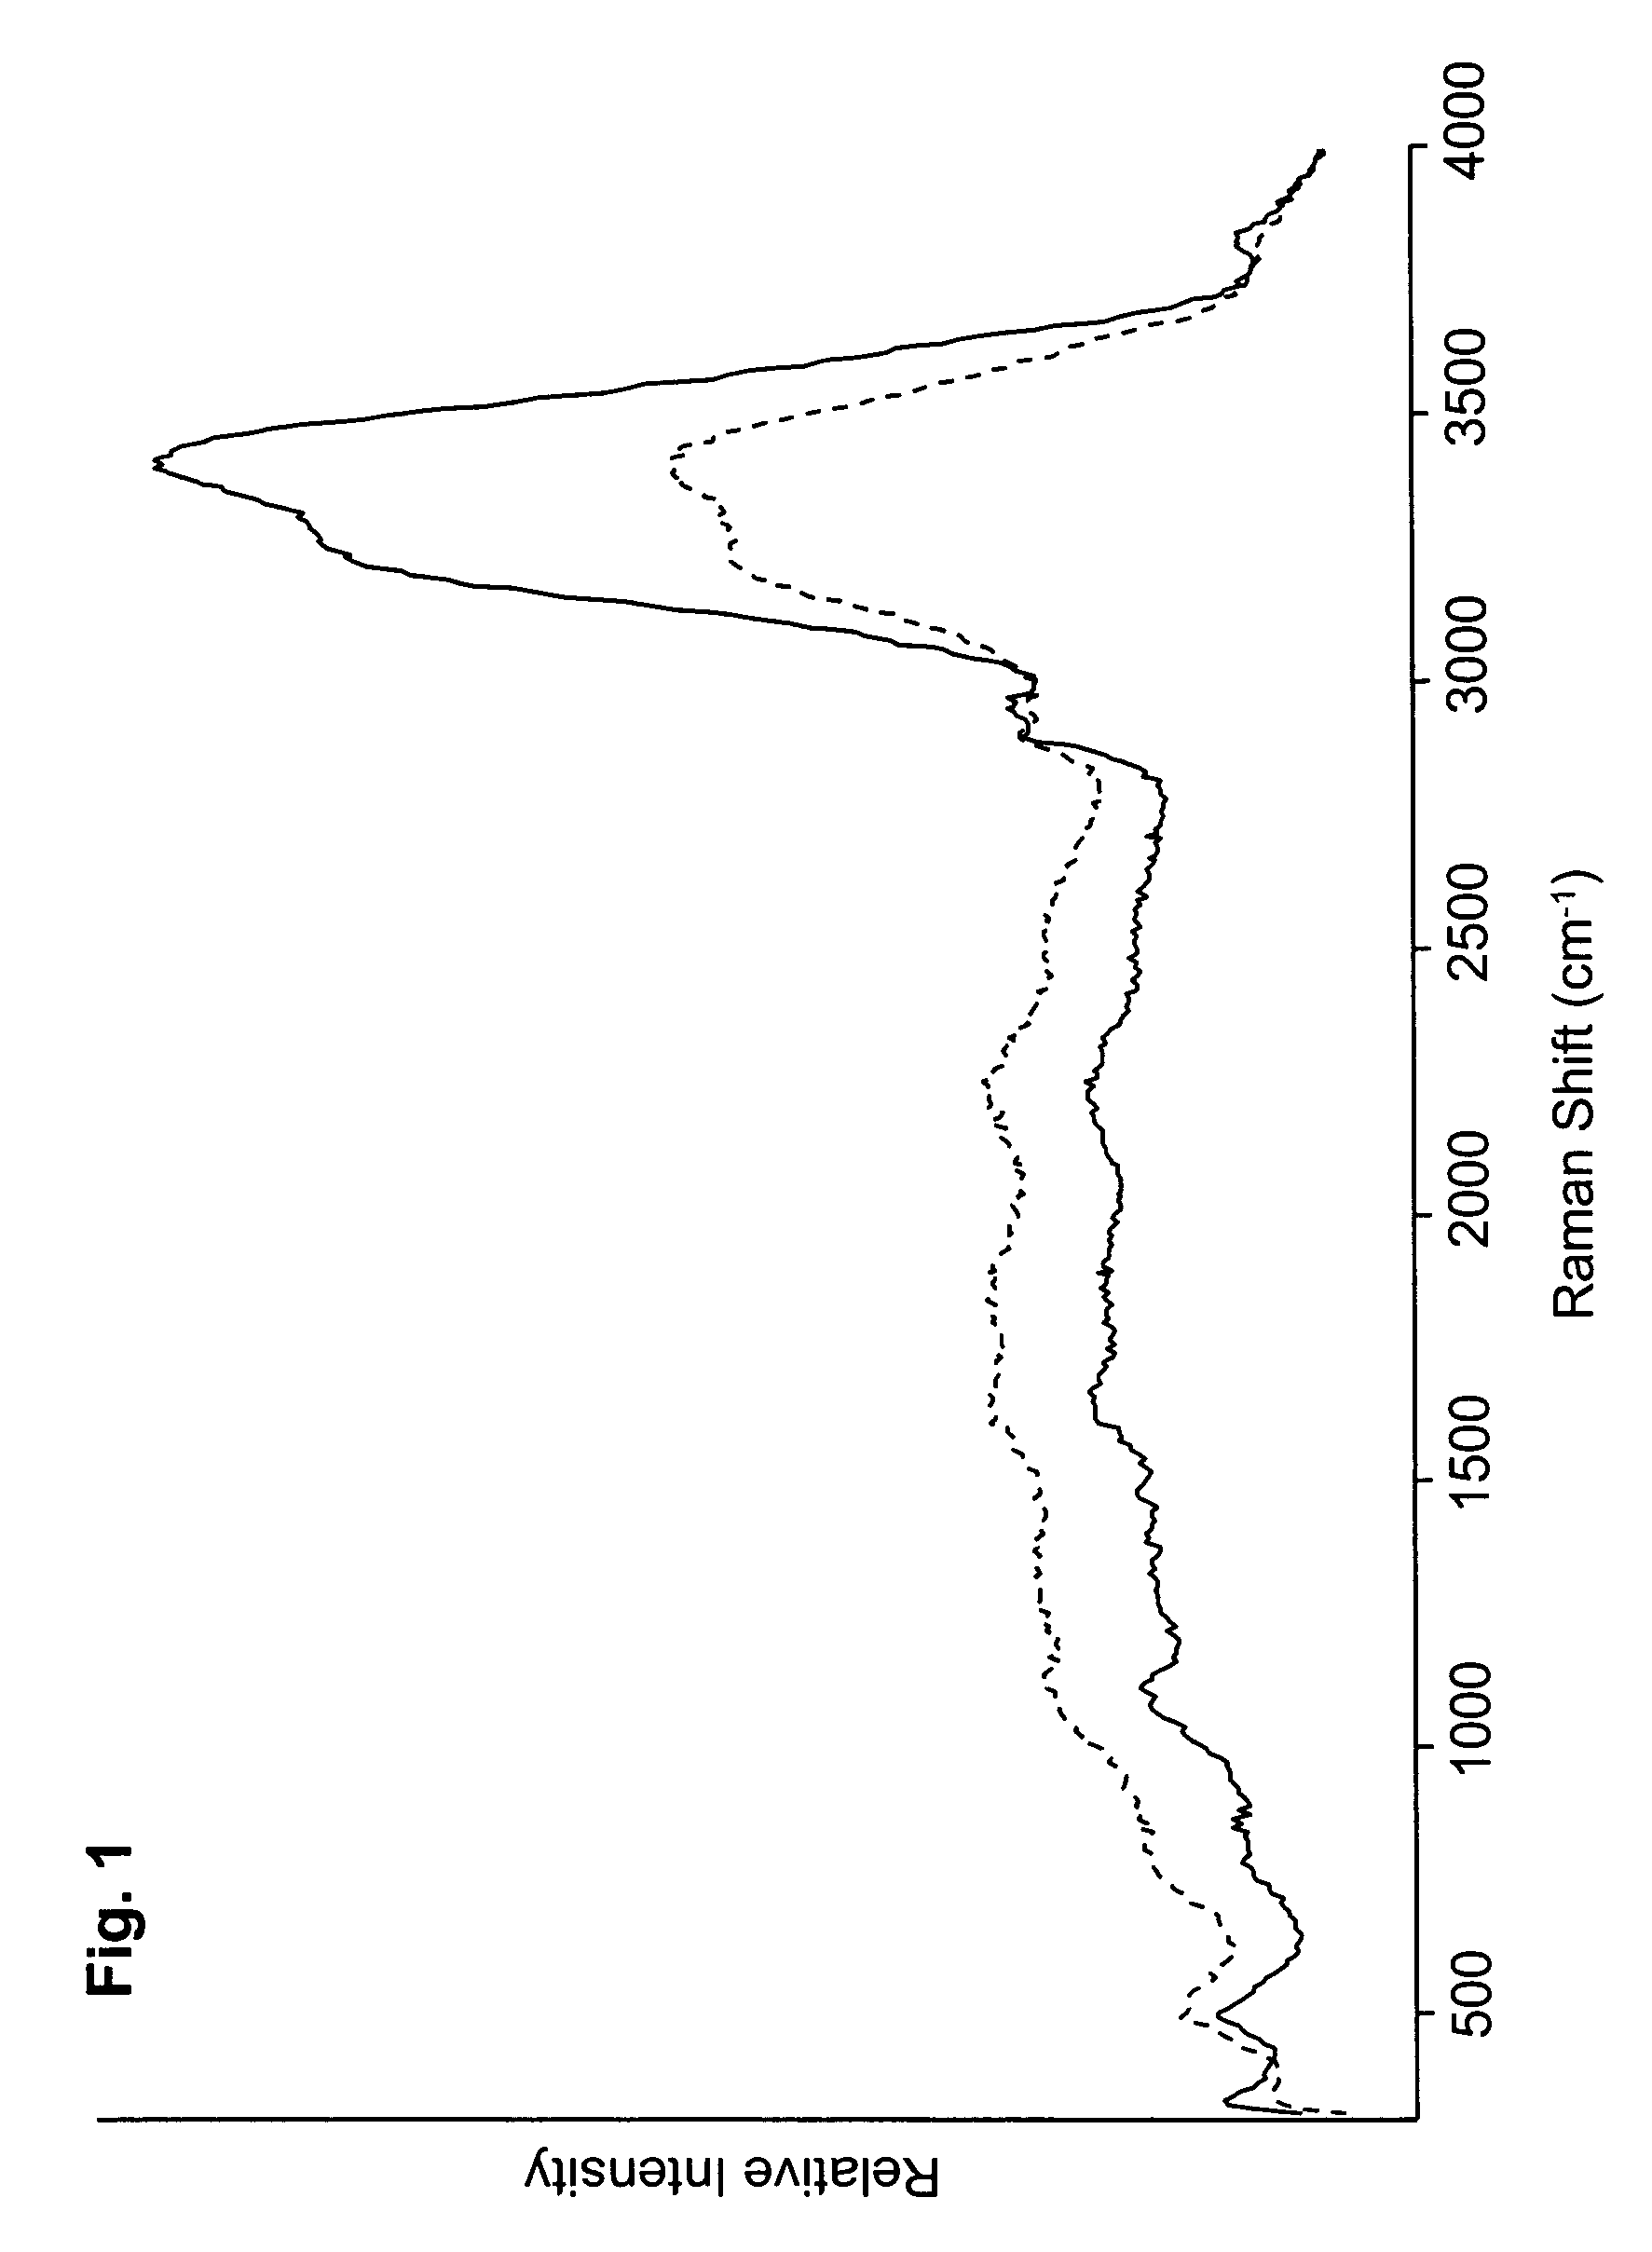
[0158]In this example, a nasal spray preparation was used which contained beclomethasone dipropionate (BDP) as an active pharmaceutical agent and the following components as inactive agents: microcrystalline cellulose (MCC); carboxymethylcellulose sodium (CMC); dextrose; benzalkonium chloride; POLYSORBATE 80™; and phenylethyl alcohol.
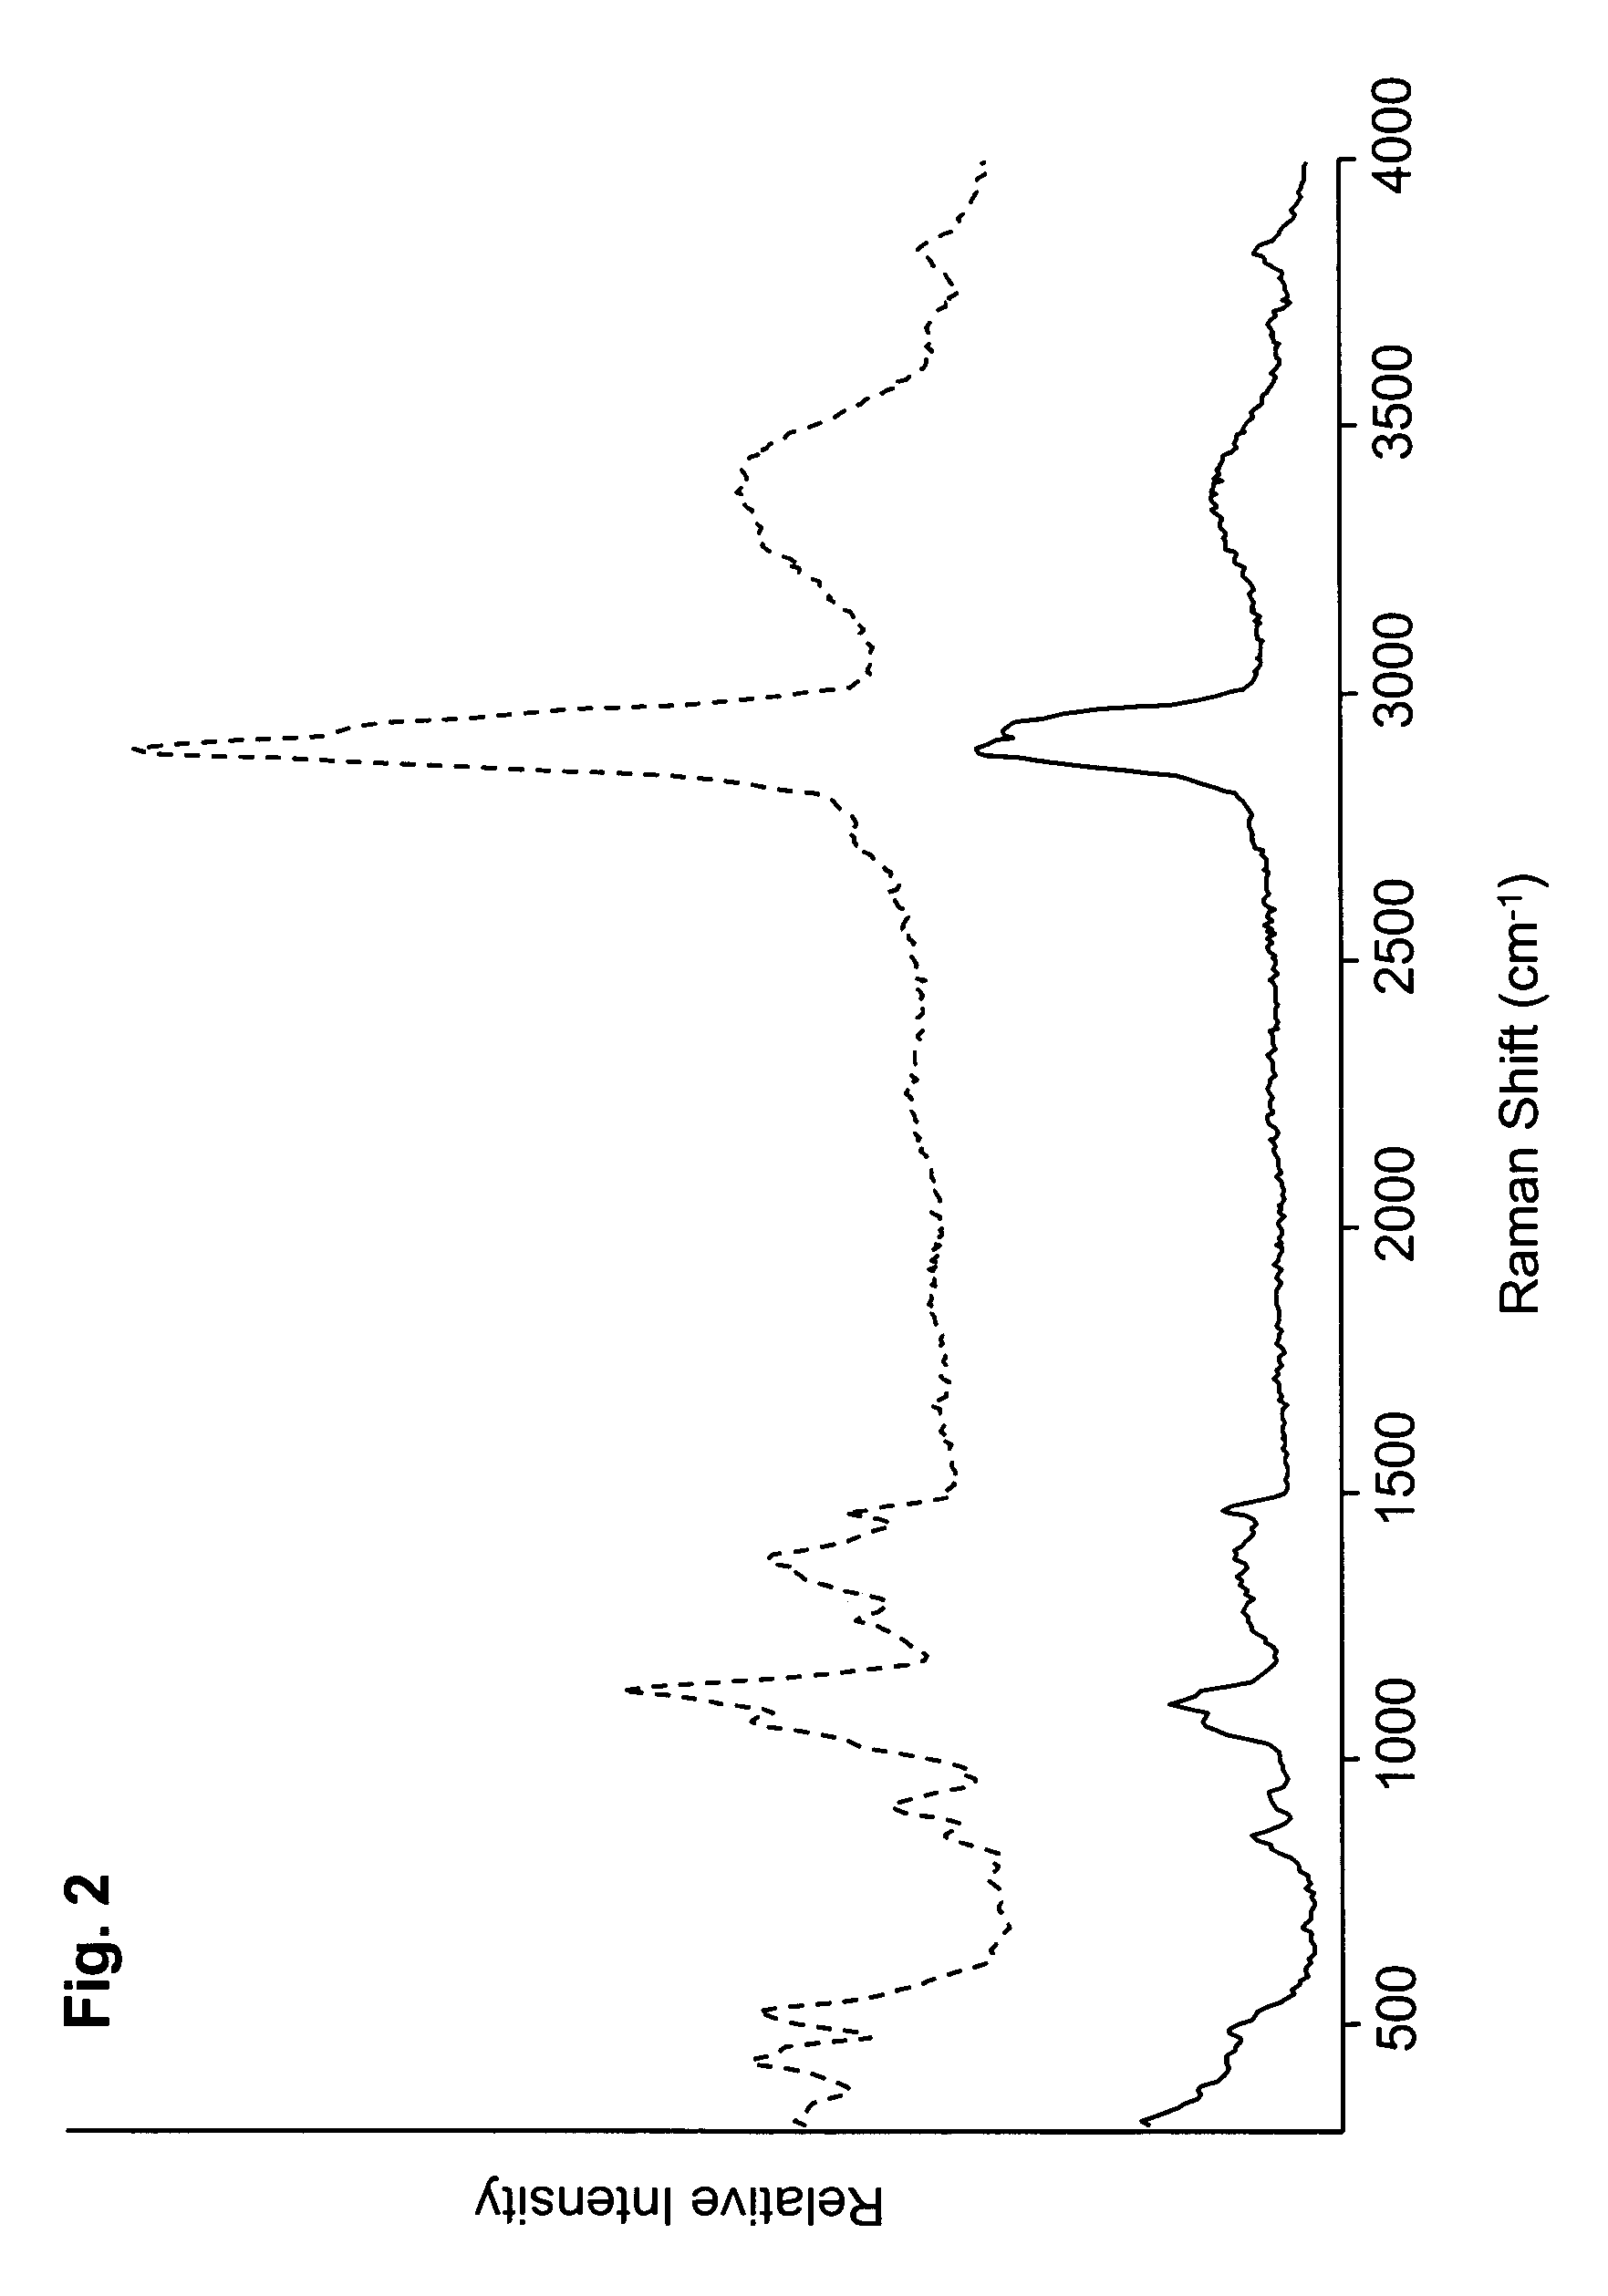
[0159]FIGS. 1 and 2 depict Raman spectra obtained using two batches (designated 1E1 and 3E1) of the nasal spray preparation. The Raman spectra shown in FIG. 1 were obtained after applying the batches to individual slides and assessing the spectra while the preparation remained wet. The spectra in FIG. 2 were obtained after applying the same batches to individual slides and assessing the spectra after the preparation had dried. The improved peak sharpness discernable in the spectra of FIG. 2 is believed to be attributable, at least in part, to the greater immobilization of the components of the dried prepara...
example 2
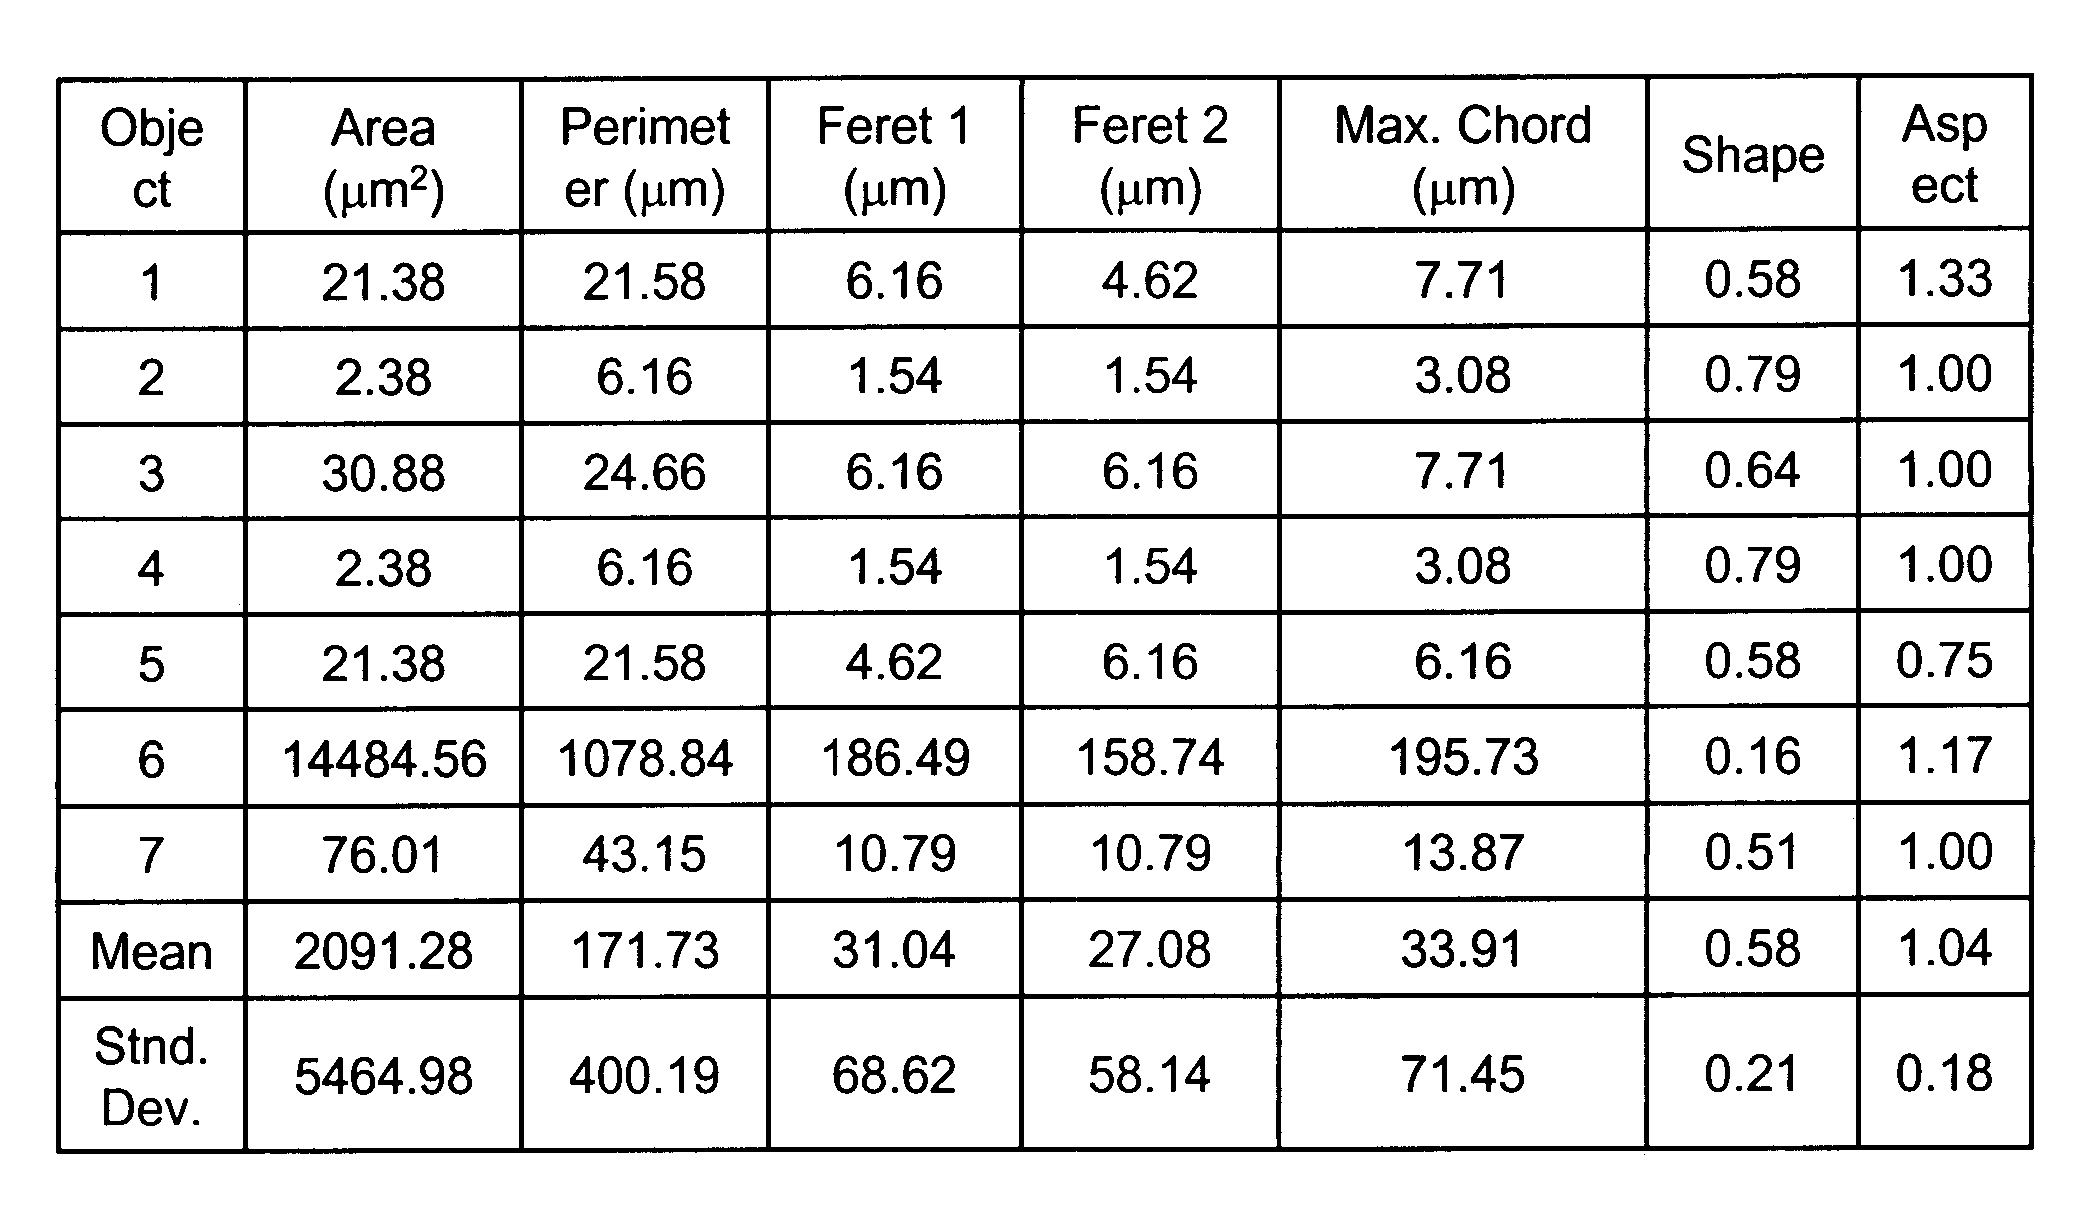
[0177]Particle Size Standard Testing Blind Study
[0178]The experiments in this example were performed to demonstrate the validity of RCI for small particle sizing in a blinded study.
[0179]Six different polystyrene microsphere particle size standards were combined in a sample. Using optical microscopy and RCI, the mean particle size and associated standard deviations were determined for each size standard following a method consistent with the Duke Scientific (DS) method for size determination.
[0180]The DS method was performed as follows. Highly uniform microspheres, when placed on a flat surface such as a glass microscope slide, tended to form systematic hexagonal arrays. Using optical microscopy, the sizes were determined by measuring many polystyrene microspheres in a row and dividing by the number of spheres. The results were then verified by NIST. This method was developed due to the difficulty in determining the edge of the spherical particle especially when approaching the diff...
example 3
[0217]NIR and Raman Chemical Imaging of a Pharmaceutical Tablet
[0218]In the experiments described in this example, chemical image data was collected for a pressed tablet containing aspirin and lactose. The chemical image data could be used to describe the distribution of these two components in the tablet.
[0219]Acetylsalicylic acid (aspirin) and lactose were independently assessed by dispersive Raman spectroscopy and NIR spectroscopy to determine their spectral characteristics. The relevant NIR and Raman spectra are shown in FIGS. 36E and 36F, respectively.
[0220]A CONDOR(™, ChemImage Corporation, Pittsburgh, Pa.) NIR chemical imaging macroscope was used to gather NIR chemical imaging data from the tablet. Based on the NIR spectral information gathered using pure aspirin and lactose, regions of the tablet containing aspirin were selected based on their exhibition of NIR absorption at about 1660 nanometers, and regions of the tablet containing lactose were selected based on their exhi...
PUM
| Property | Measurement | Unit |
|---|---|---|
| wavenumbers | aaaaa | aaaaa |
| wavelengths | aaaaa | aaaaa |
| size | aaaaa | aaaaa |
Abstract
Description
Claims
Application Information