Non-invasive tissue glucose level monitoring

a glucose level and tissue technology, applied in the field of non-invasive tissue glucose level monitoring, can solve the problems of severe damage to vital organs, insufficient insulin production or response of the body, and inability to properly monitor the glucose level of the tissue,

Inactive Publication Date: 2011-03-01
MASIMO LAB INC
View PDF90 Cites 633 Cited by
  • Summary
  • Abstract
  • Description
  • Claims
  • Application Information

AI Technical Summary

Problems solved by technology

Diabetes is a chronic life threatening disease for which there is presently no cure.
Diabetes is a disease in which the body does not properly produce or respond to insulin.
The high glucose concentrations that can result from this affliction can cause severe damage to vital organs, such as the heart, eyes and kidneys.
This method can be painful, inconvenient, costly, and pose the risk of infection.
An additional inconvenience of these traditional methods is that they require testing supplies such as collection receptacles, syringes, glucose measuring devices and test kits.
Although disposable supplies have been developed, they are costly and can require special methods for disposal.
Despite extensive efforts, however, none of these methods has, so far, yielded a non-invasive device or method for the in vivo measurement of glucose that is sufficiently accurate, reliable, convenient and cost-effective for routine use.

Method used


Image

  • Non-invasive tissue glucose level monitoring
  • Non-invasive tissue glucose level monitoring
  • Non-invasive tissue glucose level monitoring

Examples


example 1

Glucose Levels of Diabetic Versus Non-Diabetic Mice

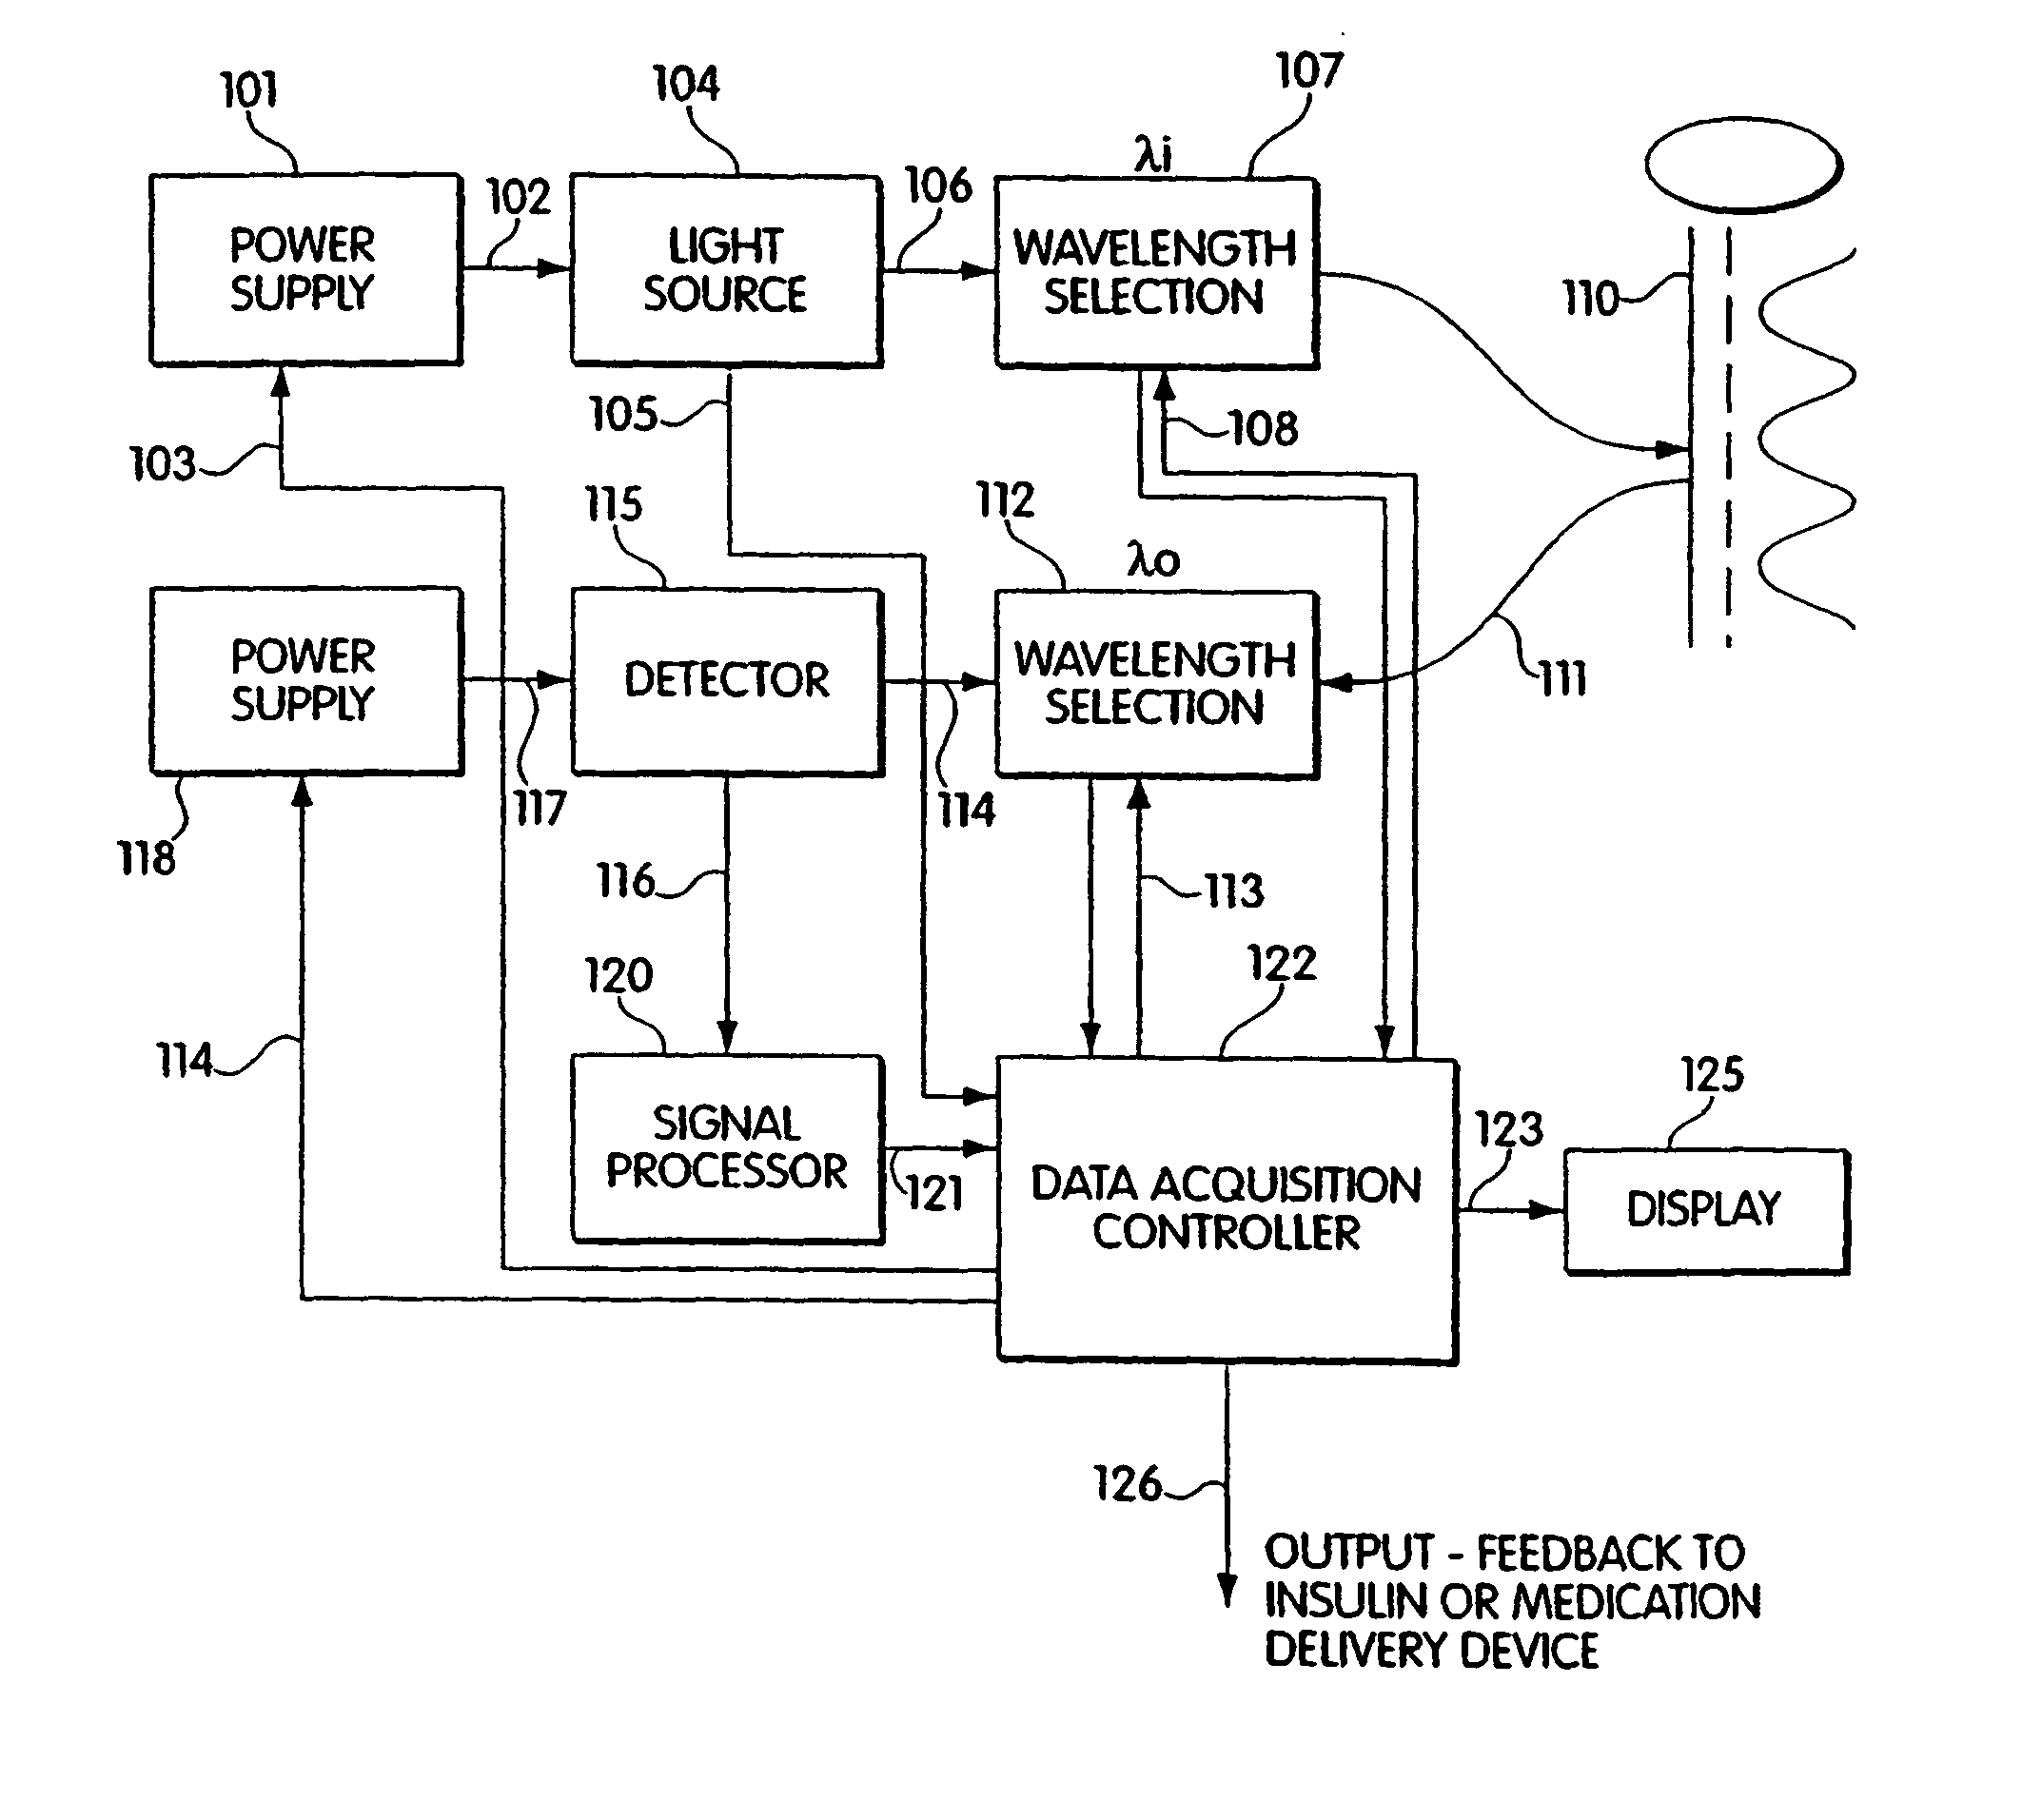
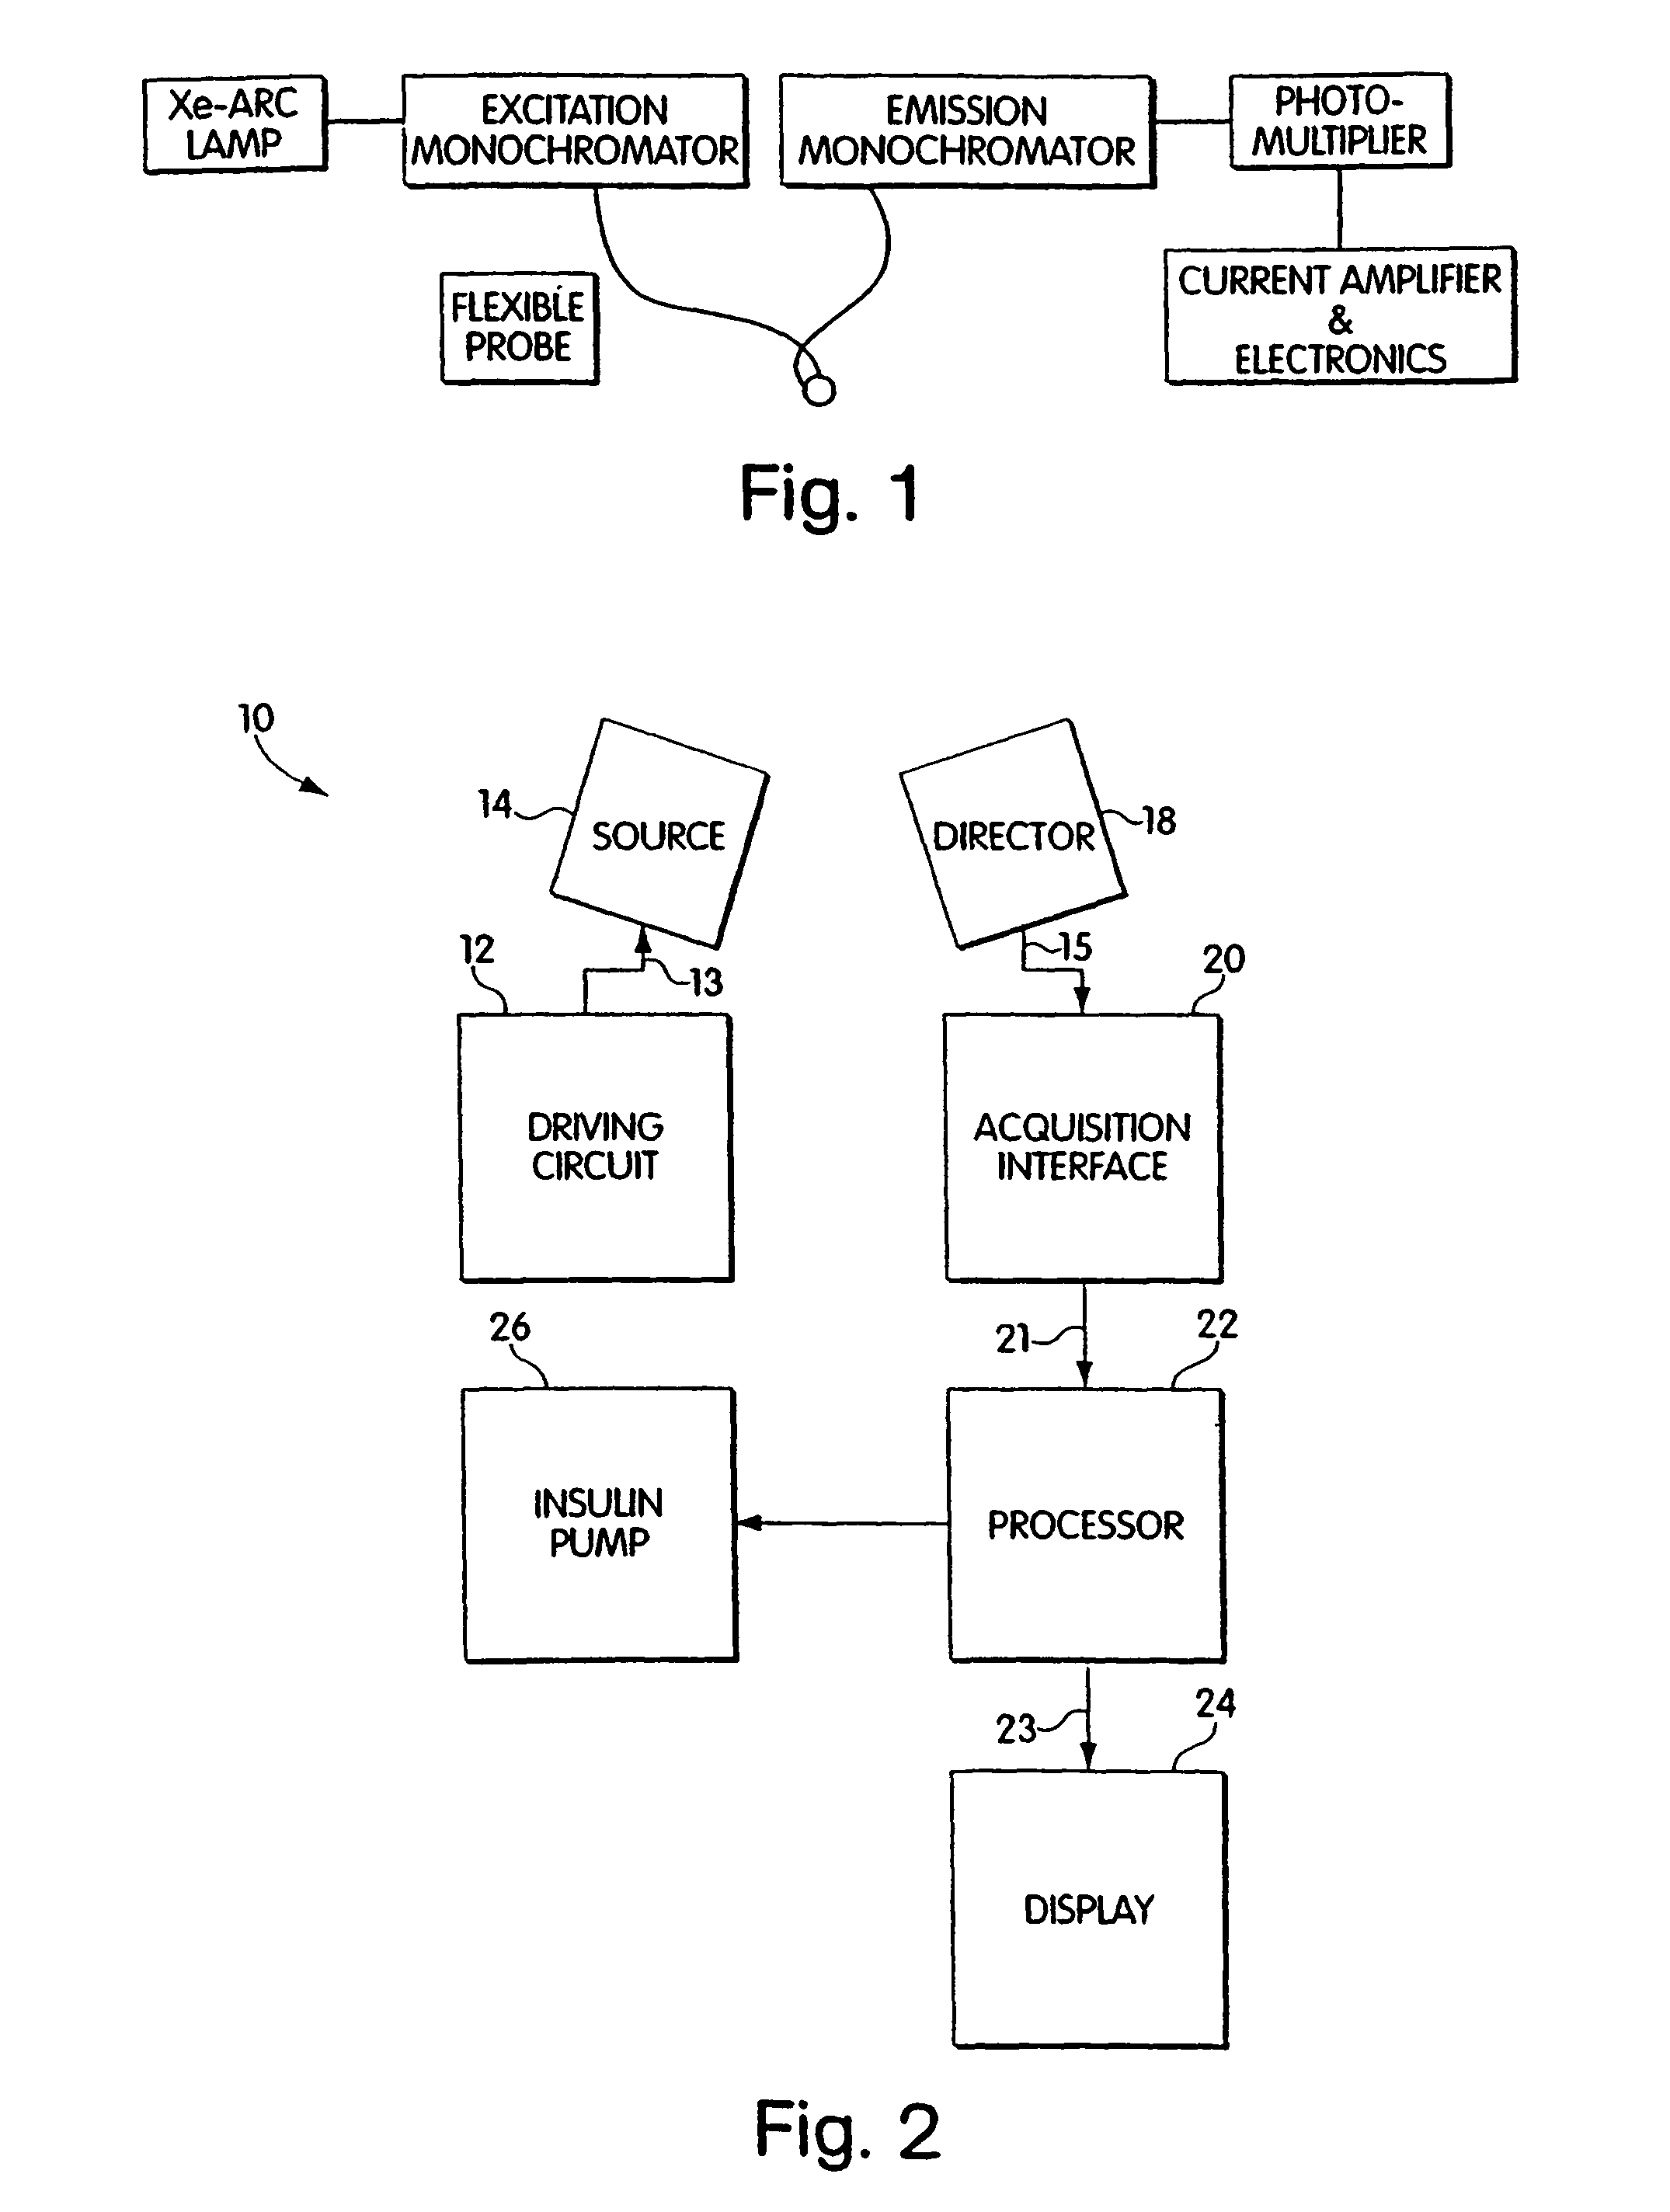
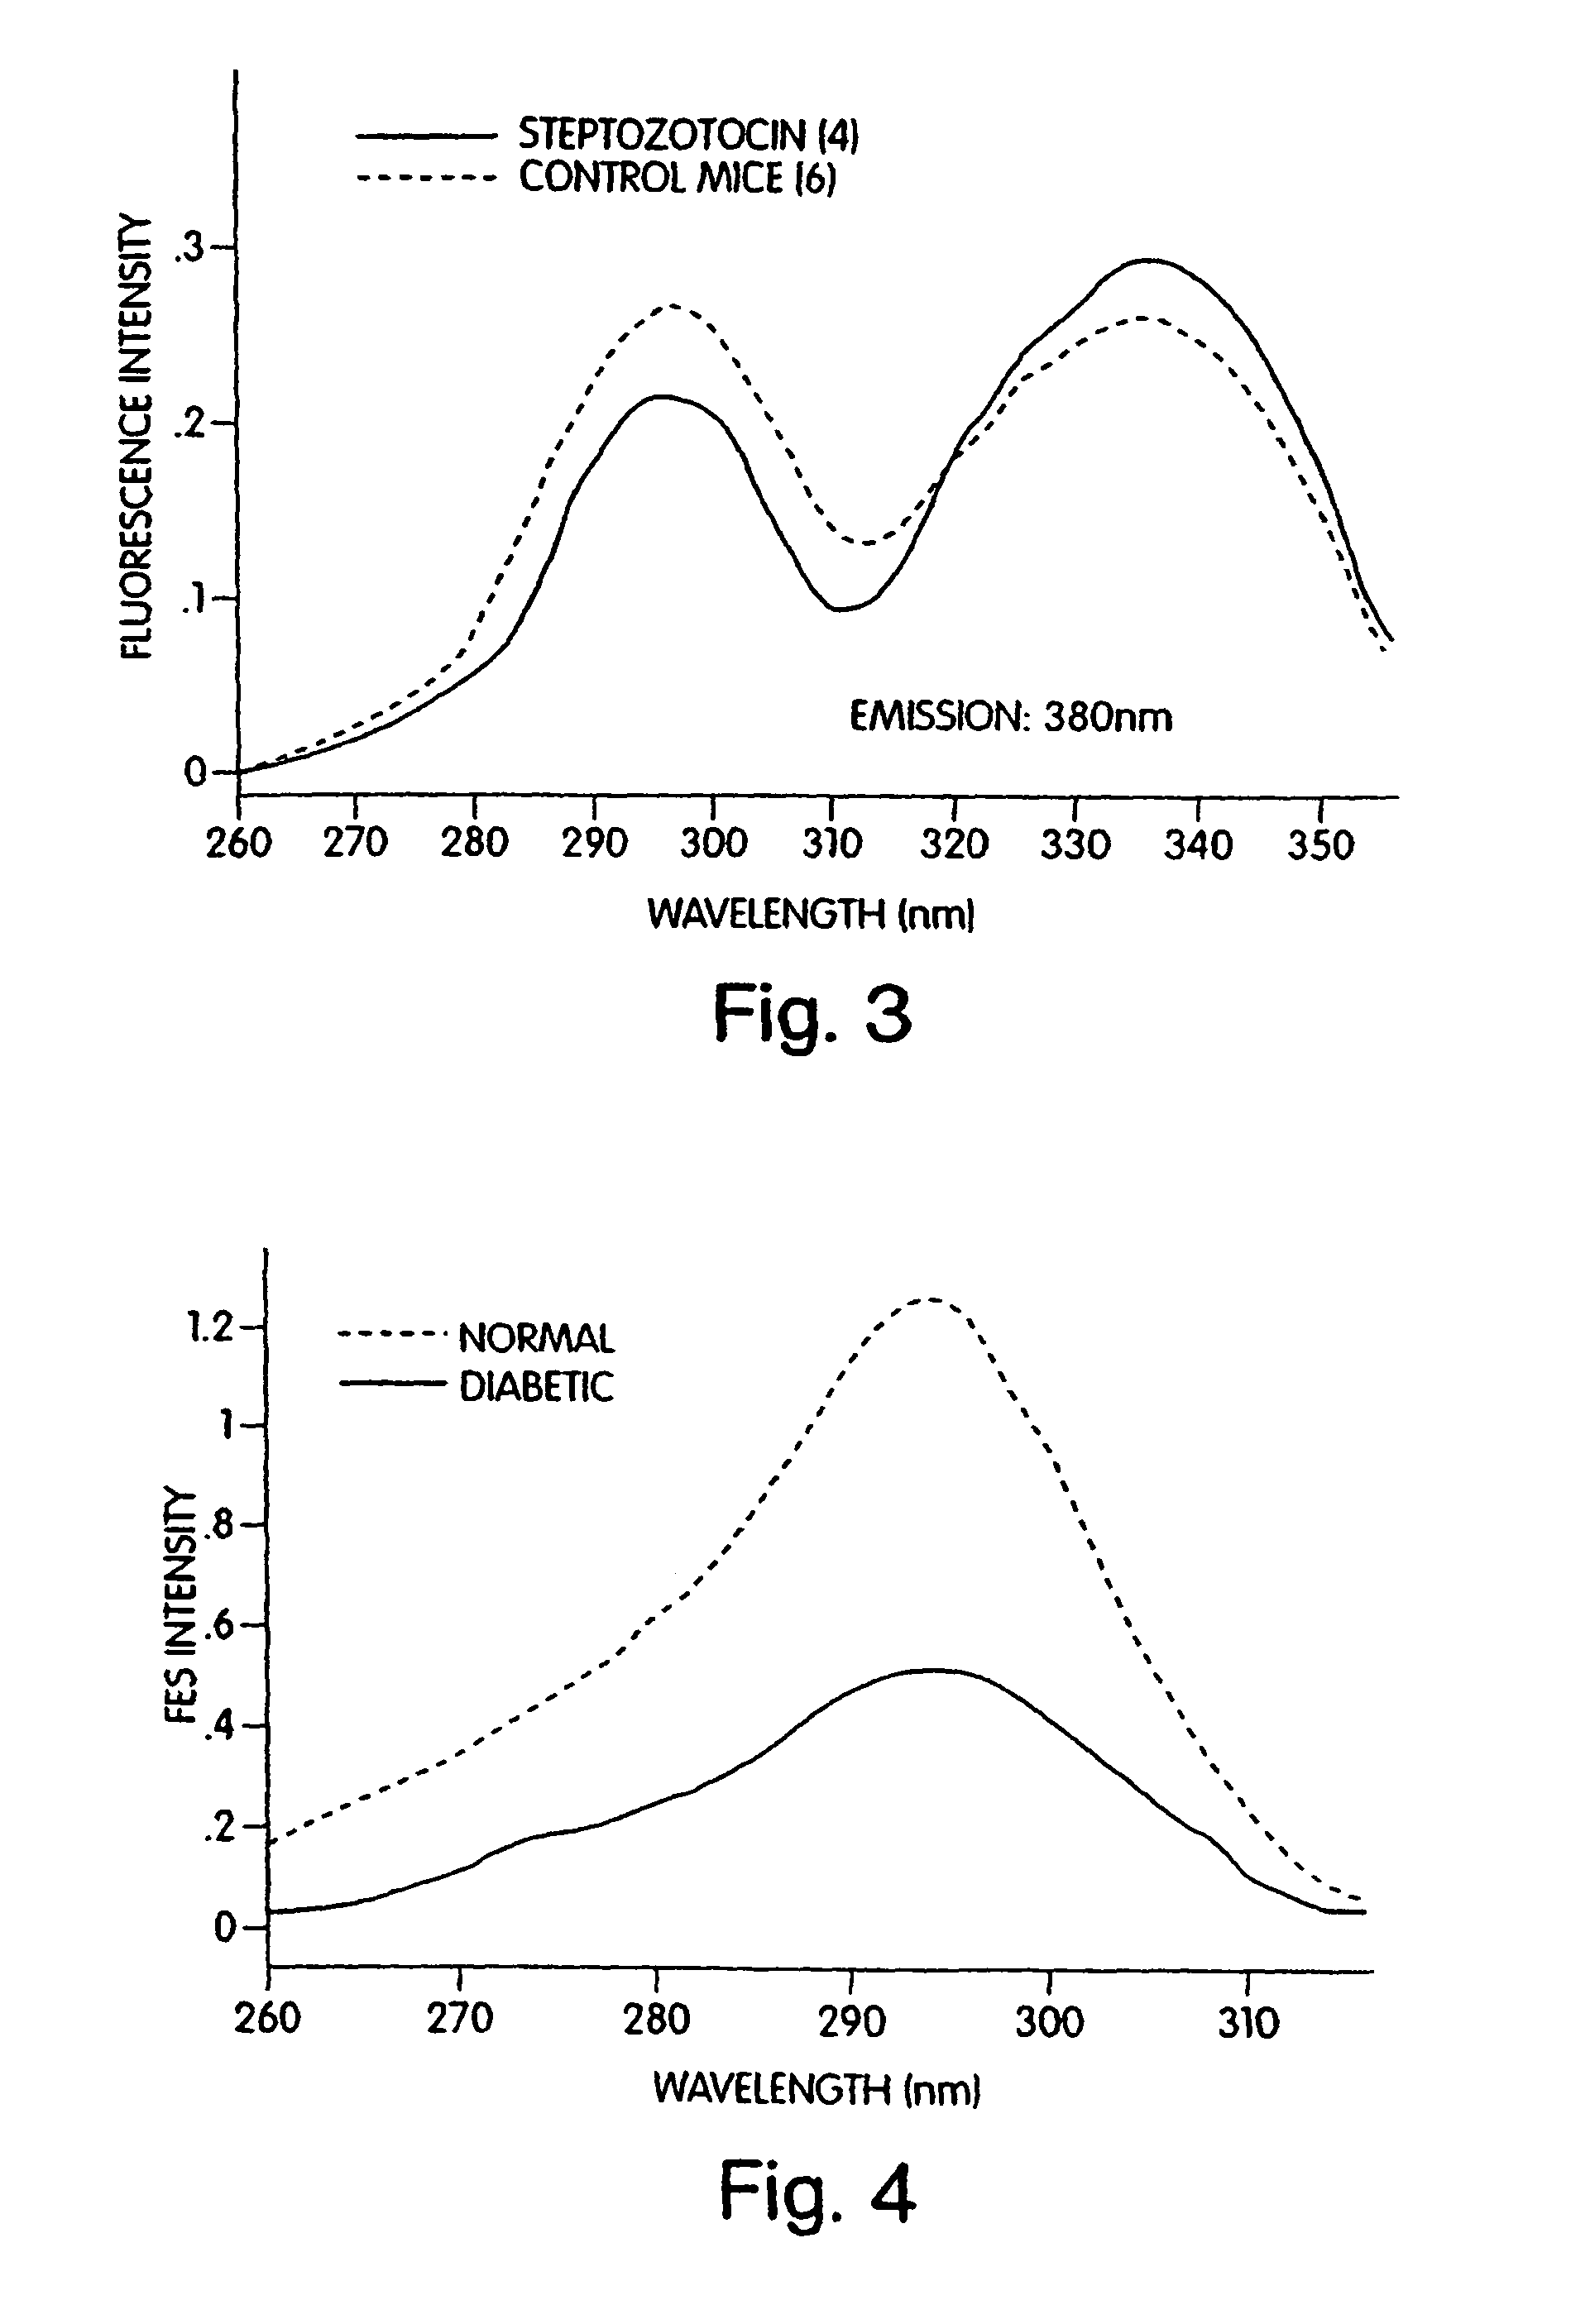
[0133]Experiments were conducted for six hairless (SKH) diabetic mice made diabetic by the injection of streptozotocin, and six hairless (SKH) non-diabetic (normal) mice. Excitation spectra at emission wavelengths of 380 nm and 340 nm were collected for each of the twelve mice. A Xenon arc source coupled to a monochromator were fed into a fiber optic probe, which was then used to illuminate the backs of all of the mice at an intensity level of approximately 0.1-1.0 mW / cm2. A spectrometer was used to collect the resulting spectra, which are shown in FIGS. 3 and 4 for emission at 380 nm and 340 nm, respectively. The plots indicate a significantly lower excitation intensity at 295 nm and a significantly higher excitation intensity at 340 nm for the diabetic mice. Urine collected from the animals confirmed that the glucose levels of the diabetic mice were higher at 340 nm for the diabetic mice.

example 2

Glucose Levels of a Non-Diabetic Rat Following Ketamine and Insulin Treatments

[0134]Referring to FIG. 5, experiments were also conducted using a normal rat. The experimental apparatus used was the same as that used in Example 1. Fluorescence excitation spectra were obtained for the rat in the following situations, (A) at rest (diamonds), (B) after the administration of Ketamine (squares), (C) after the administration of insulin (triangles) and (D) after the administration of additional insulin (crosses). The glucose levels in situations A-D were determined to be 120, 240, 100, and 40 gm / ml, respectively. The results are believed to be superimposed on a light leakage signal that increases steadily with wavelength, although the use of double monochromators should eliminate this source of background noise. Spectra collected for this rat indicate that blood glucose level has a positive effect on fluorescence excitation in the 340 nm range. This is more clearly depicted in FIG. 6 in whic...

example 3

Glucose Levels of Human Subjects Before and after Glucose Ingestion

[0135]Preliminary experiments were also conducted on humans. FIGS. 7, 8 and 9 depict fluorescence excitation spectra for three human subjects, two males and one female, respectively, before (dashes), 30 minutes after (dotted / dashed line), and 60 minutes after (solid line) the ingestion of 100 grams of glucose. In each situation, the emission monochromator was set to a wavelength of 380 nm. Collagen and tryptophan spectra were found to change in ways similar to those for the animal models, although there appear to be individual differences. Dashed lines represent measurements before glucose intake. Dashed and dotted lines represent changes induced after glucose intake. Solid lines represent maximal changes induced by the intake of glucose.


PUM


Abstract

Instruments and methods are described for performing non-invasive measurements of analyte levels and for monitoring, analyzing and regulating tissue status, such as tissue glucose levels.

Description

RELATED APPLICATIONS[0001]The present application is a continuation application of U.S. Ser. No. 10 / 788,023, filed Feb. 26, 2004 now abandoned, which is a continuation application of U.S. Ser. No. 09 / 785,547, filed Feb. 20, 2001 now U.S. Pat. No. 6,721,582, which claims priority to U.S. Provisional Patent Application No. 60 / 183,358 filed Feb. 18, 2000, and is a continuation-in-part of Ser. No. 09 / 287,486, which is the United States national phase application under 35 USC §371 of the international application PCT / US99 / 07565, filed Apr. 6, 1999 now U.S. Pat. No. 6,505,059, and titled “Non-Invasive Tissue Glucose Level Monitoring,” which claims priority to U.S. Ser. No. 60 / 080,794, filed Apr. 6, 1998; the contents of which are incorporated herein by reference in their entireties.BACKGROUND OF THE INVENTION[0002]1. Field of the Invention[0003]This invention relates to instruments and methods for performing non-invasive measurements of analyte concentrations and for monitoring, analyzing...

Claims


Application Information

Patent Timeline
Patent Type & Authority Patents(United States)
IPC IPC(8): A61B5/00
CPCA61B5/0071A61B5/14532A61B5/1455
Inventor TREPAGNIER, PIERREFREEMAN, JENNYMANSFIELD, JAMESBRAND, DEREKHOPMEIER, MICHAEL J.KOLLIAS, NIKIFOROS
Owner MASIMO LAB INC
Why Eureka
Try Eureka