Systems and methods for analyzing nanoreporters

a reporter and nanotechnology, applied in the field of coded and labeled reporter molecules, can solve the problems of insufficient supply of biological samples, method still requires significant amounts of biological samples, and the kinetics of hybridization on the surface of a microarray are less efficient than hybridization

Active Publication Date: 2011-05-10
NANOSTRING TECH INC
View PDF18 Cites 79 Cited by
  • Summary
  • Abstract
  • Description
  • Claims
  • Application Information

AI Technical Summary

Benefits of technology

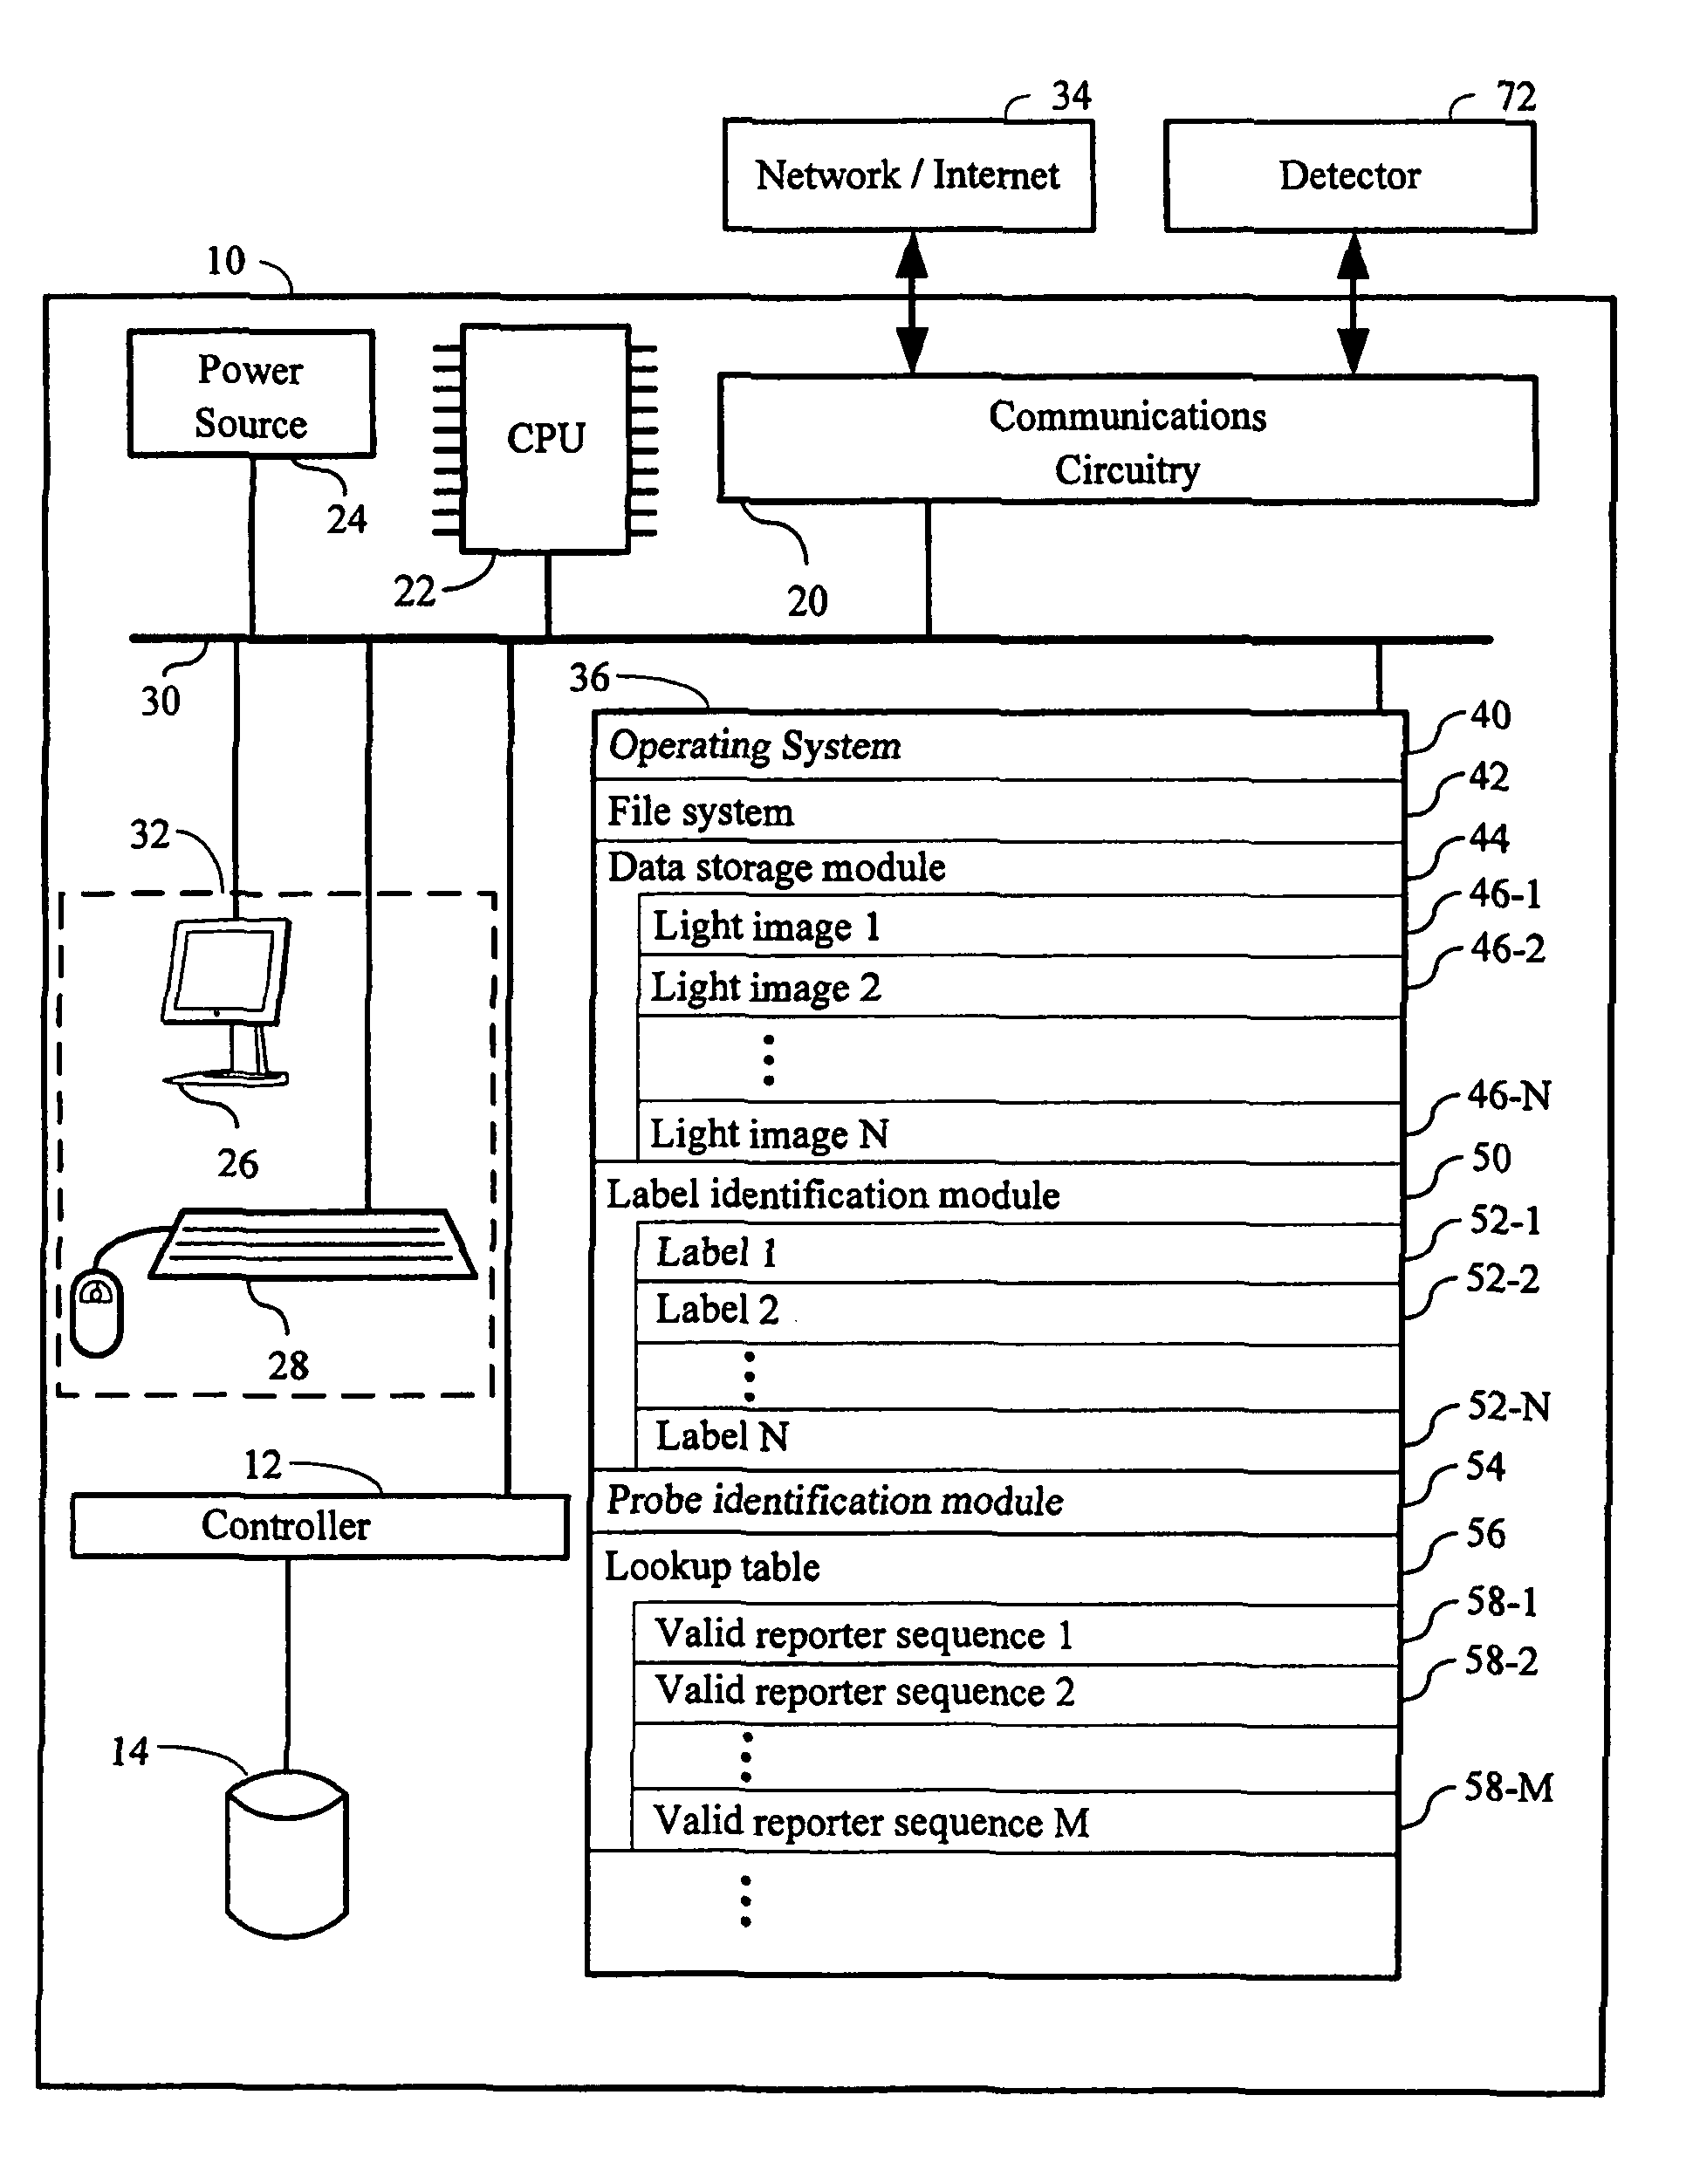
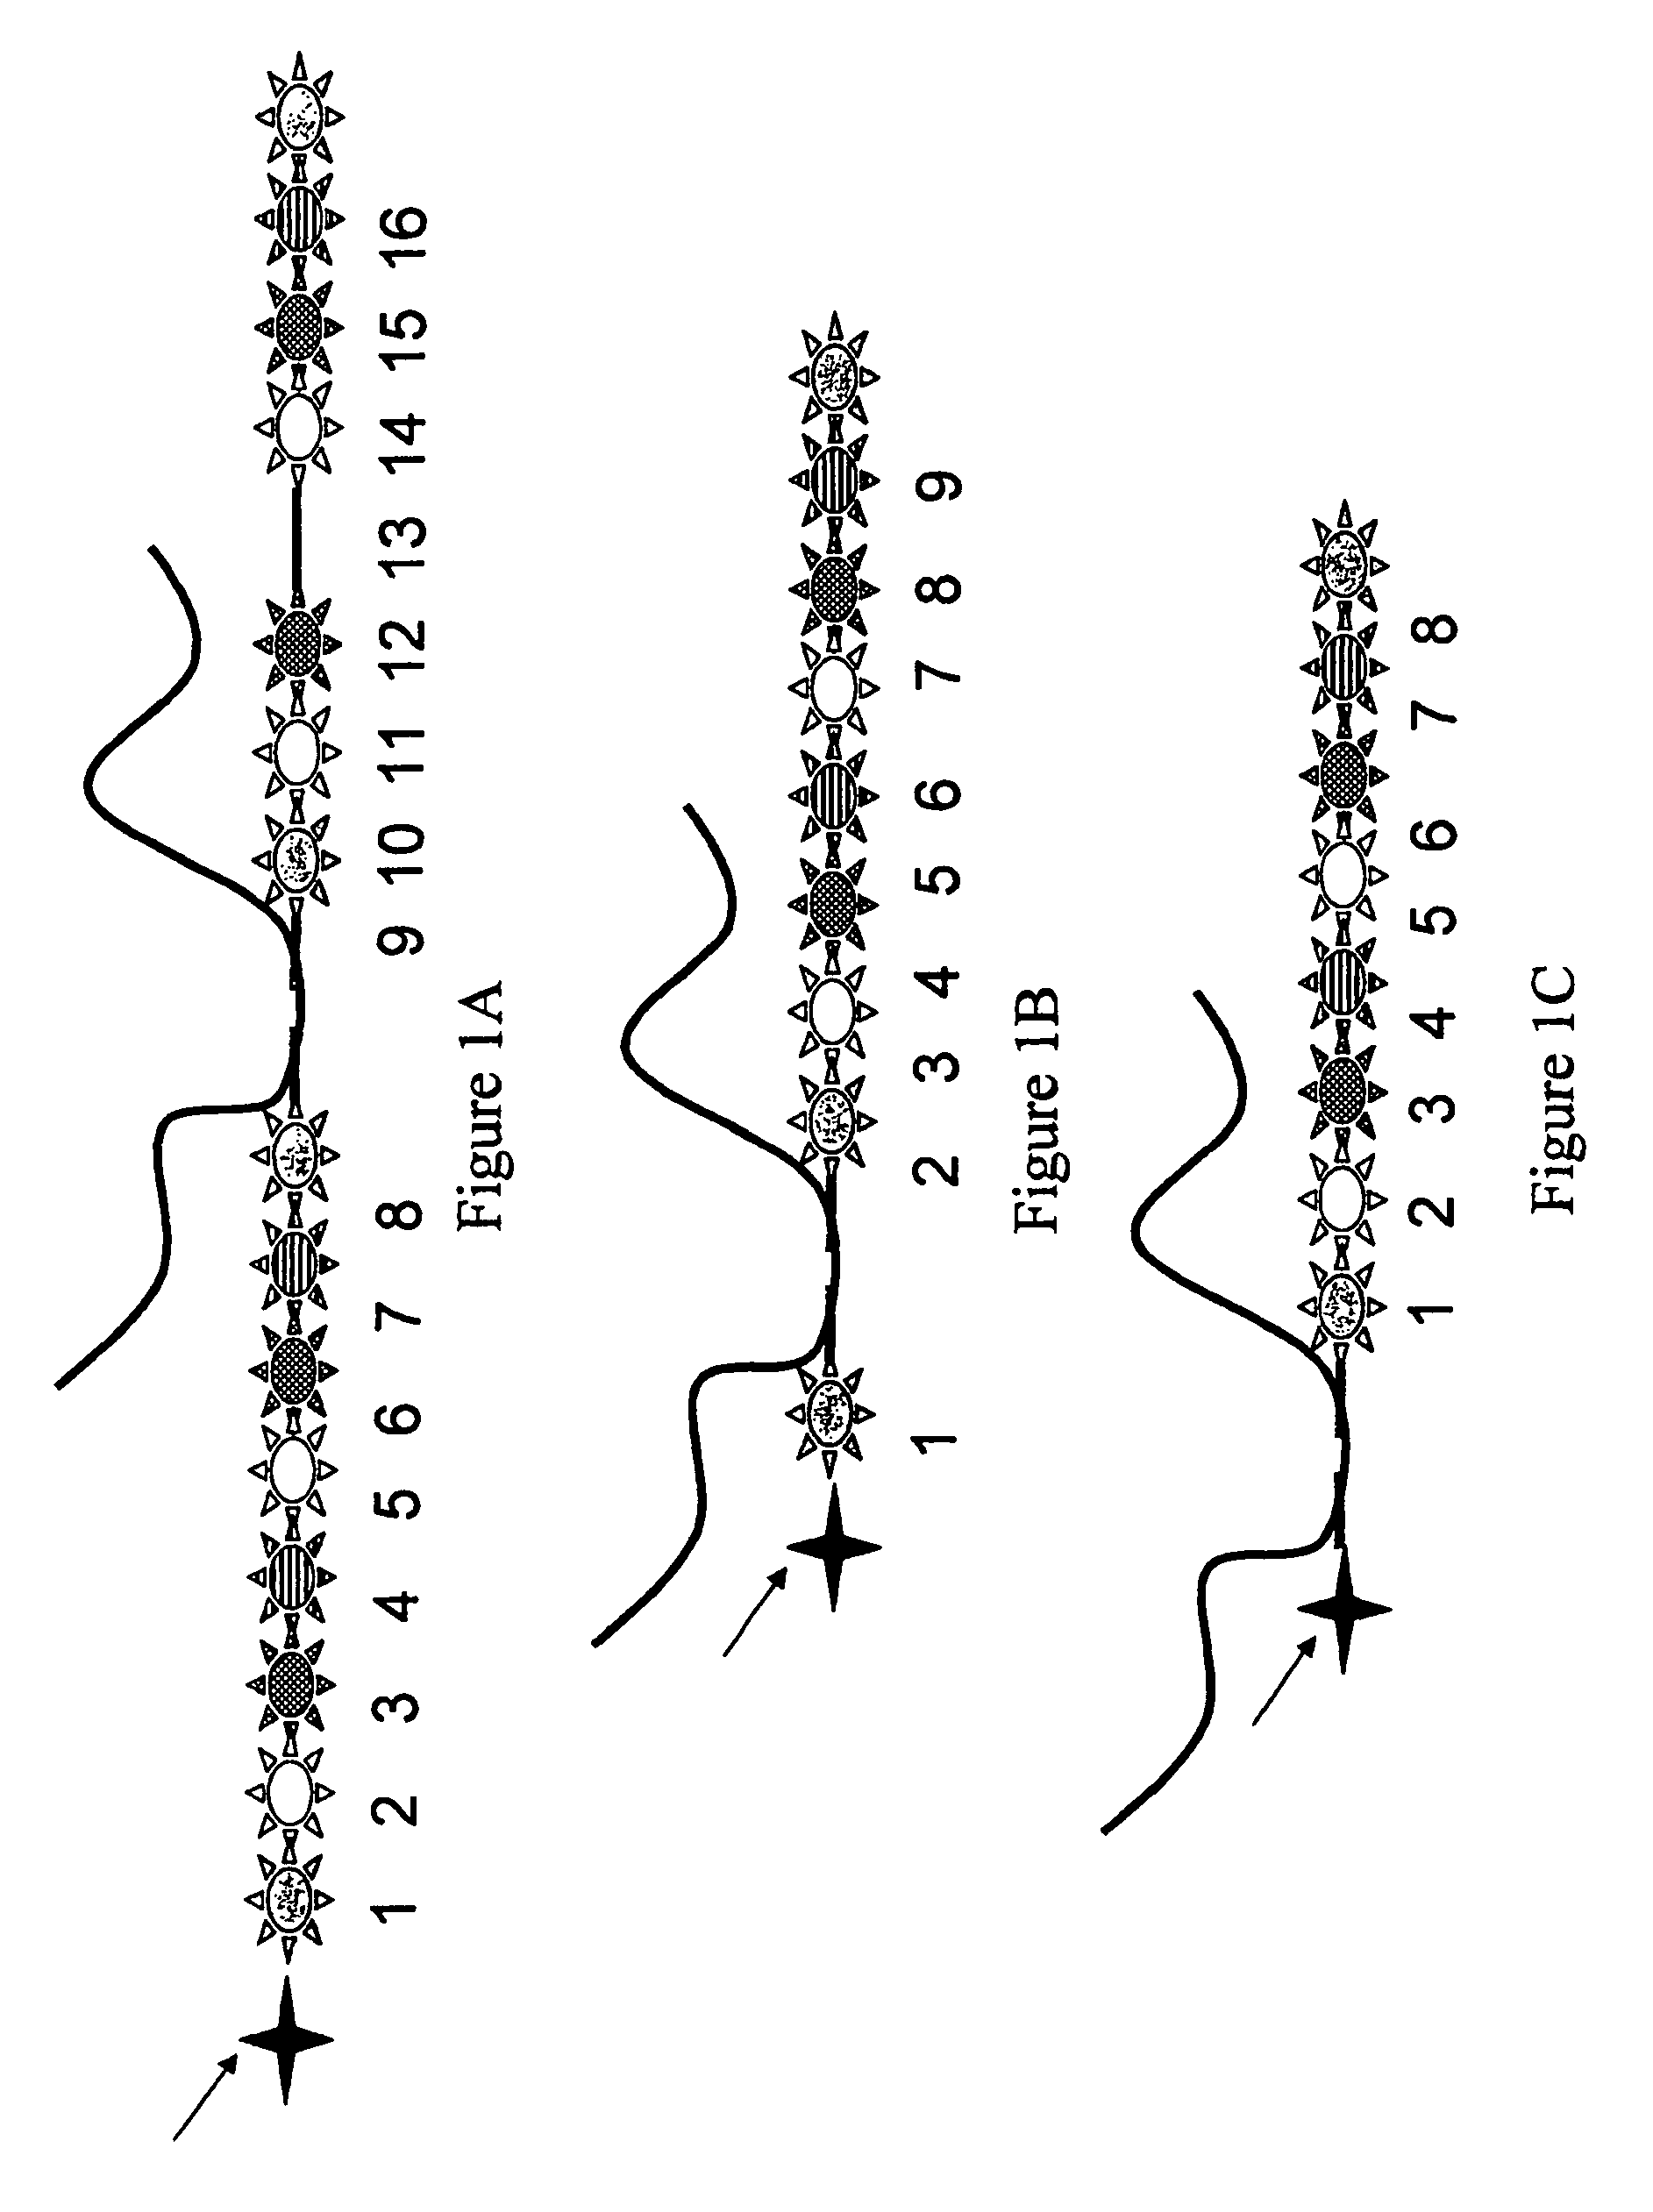
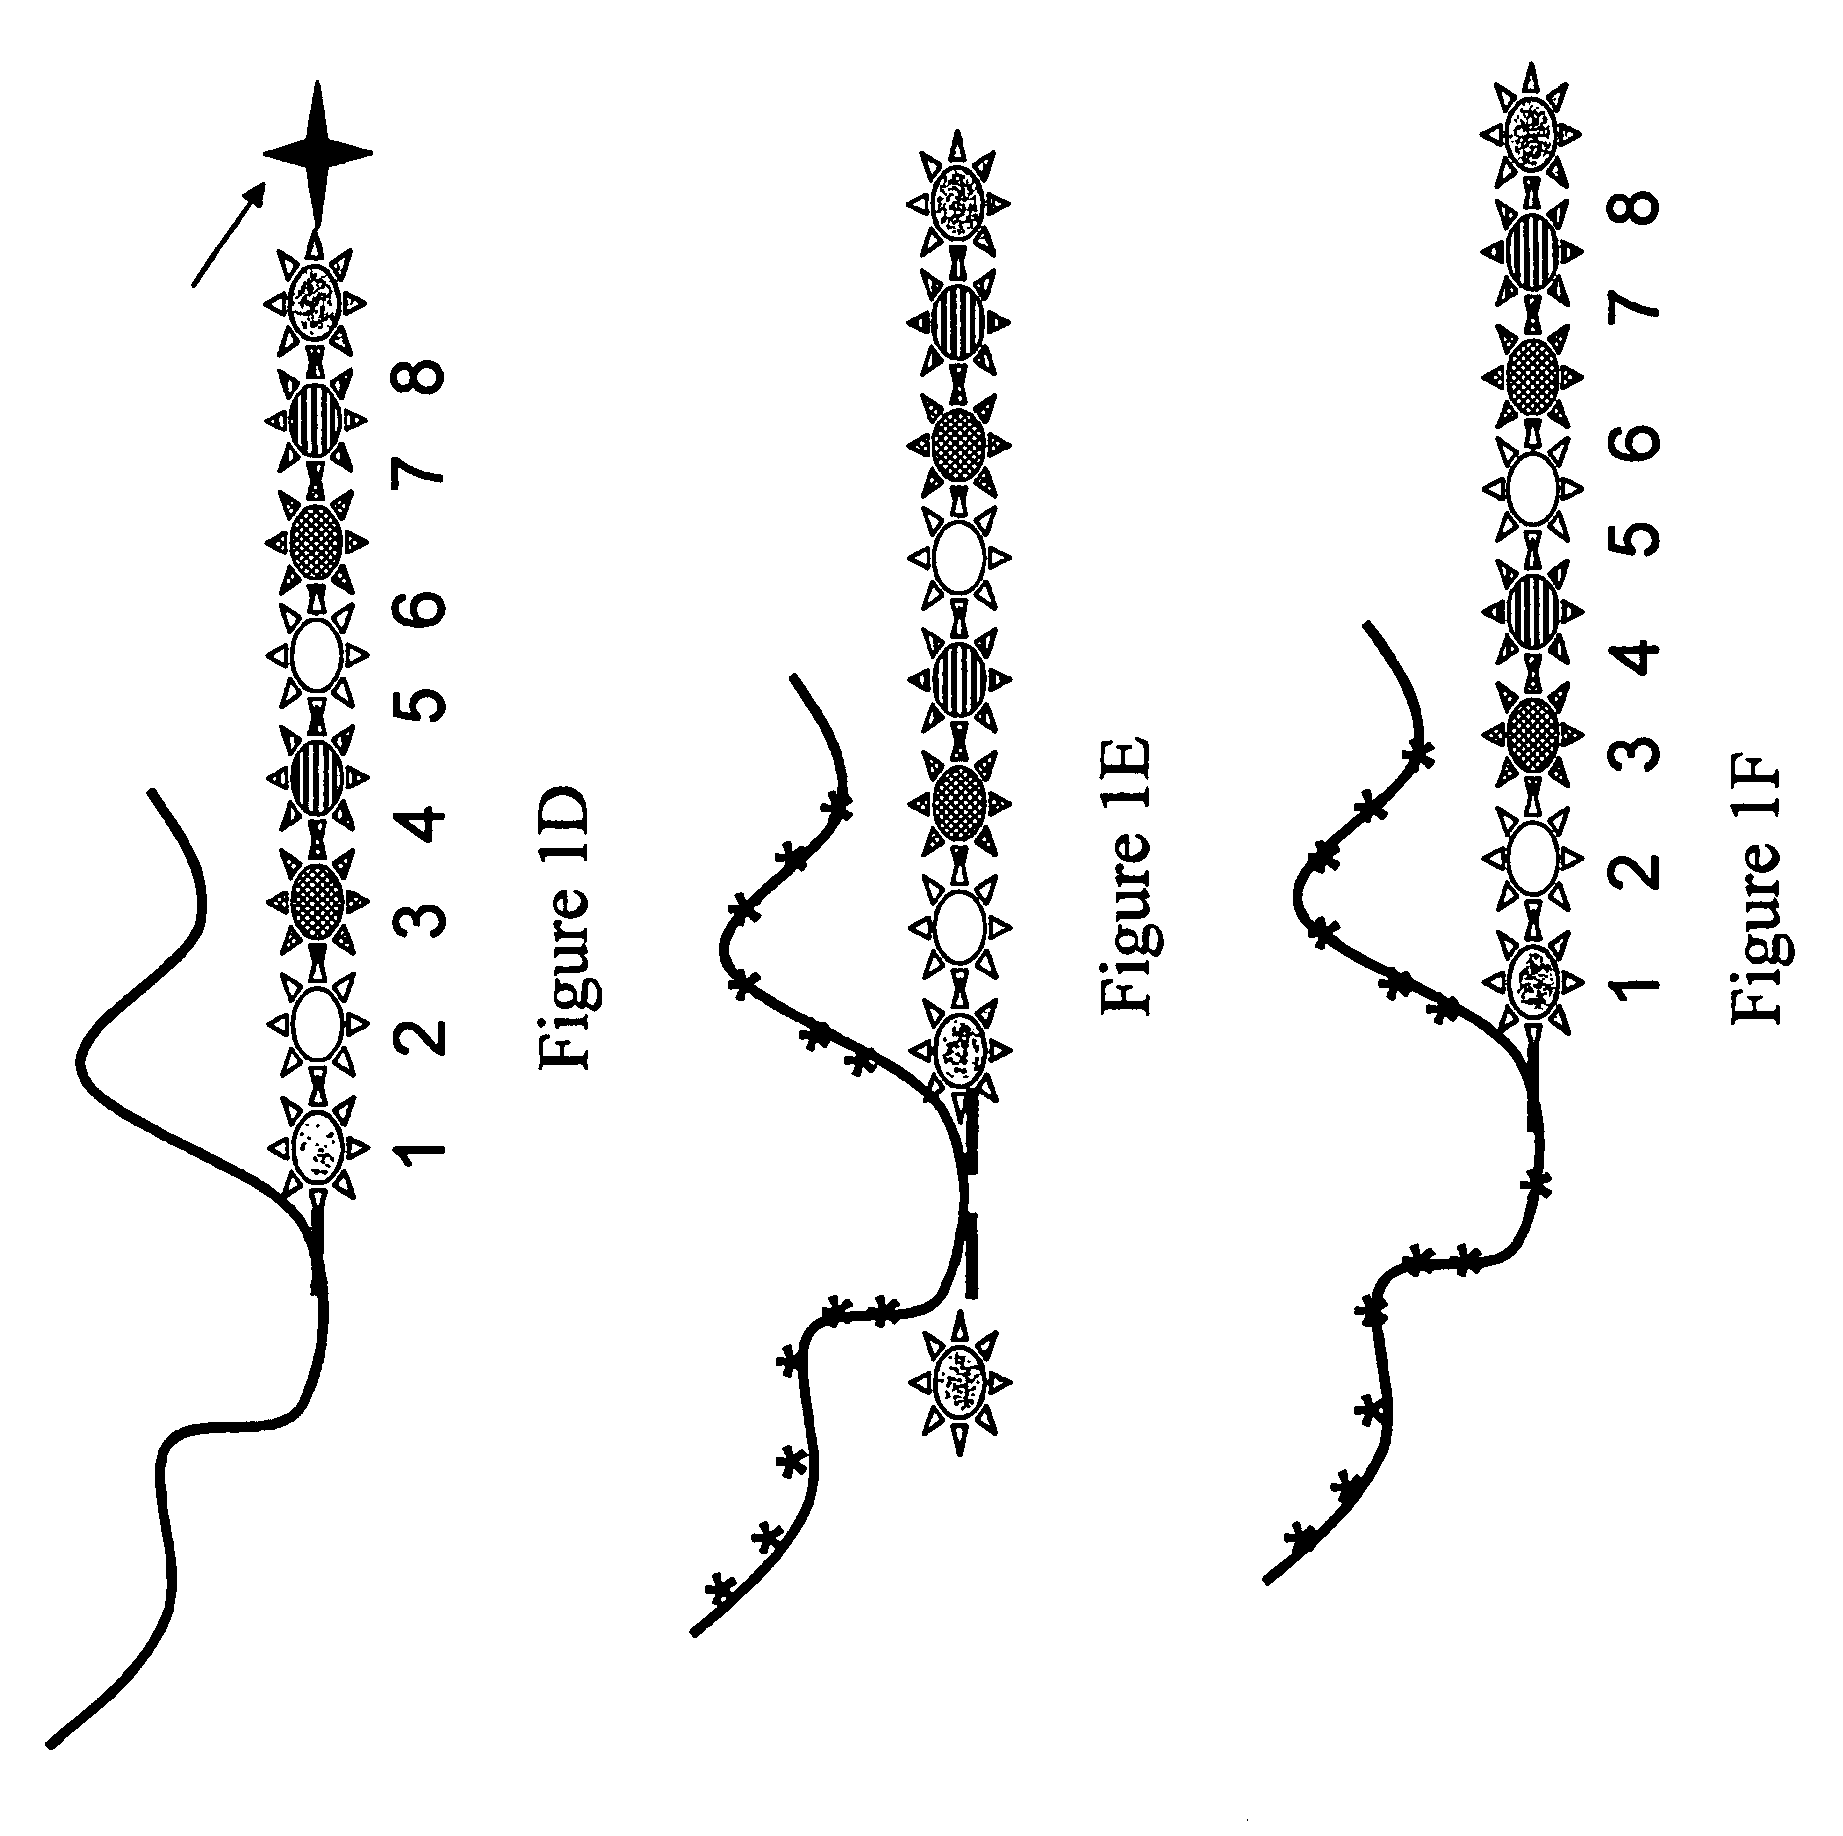
[0299]An advantage of the present invention is that there is no requirement that the nanoreporters of the present invention be overlayed at a predetermined position on the substrate as is the case in the microarray arts. While specialized substrates can be prepared such that the nanoreporters of the present invention will adhere to predetermined positions on a substrate, in preferred embodiments, the location where a nanostring adheres to a substrate is totally random. Furthermore, in preferred embodiments, all that needs to be determined is the identity of a nanoreporter on the substrate. Thus, signals are measured from the substrate for the purpose of nanoreporter identification. As such, signals are processed in a binary fashion (e.g., absence or presence of at a given wavelength) in preferred embodiments using the software modules described below. In some embodiments, not only is the position of nanoreporters on the substrate random, so is the orientation. Even in instances where the orientation of the nanoreporter on the substrate is random, the software modules described below can identify the nanoreporters. Another advantage of the present invention is that there is no requirement that multiple regions of the substrate be stitched together into a composite light image. Multiple light images of the substrate are taken, but each of these light images is from the same region of the substrate, just at different wavelengths.
[0300]In some embodiments, a label will fluoresce at multiple wavelengths (e.g., red and blue). In such embodiments the label identification module described below detects such a label by measuring a spot in the same position on the substrate in multiple light images. Intensity criteria can be used in such instances. For example, a requirement could be imposed that (i) a minimum blue intensity be observed in a light image that stores blue light emitted by the sample and (ii) that a minimum red intensity be observed in the same spot in the light image that stores red light emitted by the sample.
[0301]Label identification module 50. Label identification module 50 comprises instructions for identifying a plurality of labels (label monomers), in the plurality of light images 46, that are proximate to each other on the substrate. In typical embodiments, each label in a nanoreporter will emit light that causes a corresponding bright spot to appear in one or more light images 46. Each light image 46 may have dozens, hundreds, or even thousands of spots, where each spot potentially represents a label in a nanoreporter. Label identification module 50 deems these spots in the light images to be labels when specific criteria, described in detail below, are satisfied.
[0302]Label identification module 50 is capable of identifying labels that are proximate to each other on the substrate even when these labels appear in different light images. For example, consider the case in which label 1 (light monomer 1) and label 2 (light monomer 2) are in the same nanoreporter and are spatially proximate on the substrate. Further consider that label 1 and label 2 emit light within different wavelength ranges. Thus, in this example, light emitted by label 1 and by label 2 are recorded in different light images, say light image A and light image B, respectively. In some embodiments, the light emission of label 1 is recorded as a bright intensity spot in light image A whereas the light emission of label 2 is recorded as a bright intensity spot in light image B. In this example, label identification module 50 superimposes light image A and light image B. Light image A and light image B both cover the same region of the substrate. This region of the substrate may encompass several nanoreporters. In fact, this the region of the substrate covered by light image A and light image B may encompass hundreds or even thousands of nanoreporters. Therefore, light image A and light image B can each potentially record dozens, hundreds, or even thousands of labels, where each such label appears, for example, as a bright spot within light image A, light image B, or some other light image that is taken by detector 72. Light image A and light image B only differ by the wavelength range recorded. Because light image A and light image B are spatially superimposed on each other, label identification module 50 can identify the spatial proximity of label 1 and label 2 even though label 1 and label 2 originate in different light images, based on the spatial proximity of label 1 and label 2 in the superimposed light images.
[0303]Each wavelength range represented by a light image 46 is intended to measure a particular color emitted by one or more label monomers in a nanostring. In some embodiments, a wavelength range encompasses a contiguous set of wavelengths having a spectral width of up to 10 nm, up to 20 nm, up to 30 nm, up to 40 nm, up to 50 nm, up to 60 nm, up to 70 nm, up to 80 nm, up to 90 nm, or up to 100 nm.
[0304]In some embodiments, label identification module 50 aligns the light images using fiducials. A nonlimiting example of a fiducial is a latex bead that is impregnated with many different types of dye. One example of a fiducial is the MultiSpeck™ Multispectral Fluorescence Microscopy Kit (Molecular Probes, Inc., Eugene, Oreg.). The MultiSpeck™ Multispectral Fluorescence Microscopy Standards Kit is marketed as an external reference for comparing images collected with different optics, on different instruments and in different laboratories, as well as for monitoring routine day-to-day variations in instrumental performance. The kit includes two suspensions of submicron-diameter microspheres. The first suspension, the MultiSpeck suspension, is comprised of multispectral fluorescent microspheres that exhibit three relatively distinct excitation and emission bands, red, green and blue, all in the same particle. When excited with ultraviolet light, each sphere emits blue fluorescence, whereas when fluorescein or rhodamine / Texas Red® excitation filters are used, the spheres fluoresce at wavelengths similar to fluorescein or rhodamine / Texas Red emissions, respectively. Furthermore, because a single multispectral microsphere will appear different colors depending on the filters used for observation, these microspheres can be used for image registration across multiple wavelengths, thus allowing for the accurate determination of the spatial relationships of multiple labels in a multiparameter experiment. The second suspension, the RGB Mix suspension, is comprised of a mixture of “single-band” microspheres that exhibit the same three excitation / emission bands, red, green and blue, (RGB) as the multispectral microspheres, but in separate particles. Thus, a fiducial will emit light across several different wavelengths. Fiducials are randomly arranged on the substrate along with the sample. Because the fiducials emit light across a wide range of spectral frequencies, they are present in several if not all of the plurality of light images. Thus, label identification module 50 can align most if not all of the light images in a plurality of images to each other using the fiducial spots present in the light images provided that the light images are of the same region of the substrate (e.g., the same field of view).

Problems solved by technology

Unfortunately, despite the miniaturization of array formats, this method still requires significant amounts of the biological sample.
However, in several cases, such as biopsies of diseased tissues or samples of a discrete cell type, the biological sample is in limited supply.
In addition, the kinetics of hybridization on the surface of a microarray is less efficient than hybridization in small amounts of aqueous solution.
Moreover, while methods exists to estimate the amount of nucleic acid present in a sample based on microarray hybridization result, microarray technology thus far does not allow for detection of target molecules on an individual level, nor are there microarray-based methods for directly quantifying the amount of target molecule in a given sample.

Method used


Image

  • Systems and methods for analyzing nanoreporters
  • Systems and methods for analyzing nanoreporters
  • Systems and methods for analyzing nanoreporters

Examples


example 1

6.1 Example 1

Selective Immobilization or Extended DNA

[0333]A double stranded RNA-DNA hybrid 7.2 Kb in length is functionalized at one terminus with biotin. At the other terminus, the DNA comprises a single stranded sequence of 15 bases repeated 4 times (5′-GTC TAT CAT CAC AGC GTC TAT CAT CAC AGC GTC TAT CAT CAC AGC GTC TAT CAT CAC AGC-3′; SEQ ID NO:2). Thus, the DNA comprises four binding sites at one terminus for selective immobilization. The hybrid also has four regions with Cy3 fluorophores incorporated into the RNA.

[0334]A small sample of the DNA (3 μL, 0.01 fmol / μL in 1×TAE, or 40 mM Tris acetate, 1 mM EDTA, pH 8.0) is transferred into a microfluidic device comprising a channel molded into polydimethylsiloxane that is passively adhered to a streptavadin coated coverslip (Accelr8, TB0200). The channel dimensions are 50 μm×1 mm×10 mm. See FIG. 15A. The sample is contacted with the coverslip at room temperature for 15 minutes allowing the DNA to selectively bind the streptavadin s...

example 2

6.2 Example 2

Patch / Flap Nanoreporter Manufacturing Protocol

[0400]This example demonstrates another way of making a nanoreporter which consists of a single stranded linear M13mp18 viral DNA, oligonucleotide patch units and long flaps. Nanoreporter label units were successfully generated using methods substantially as described in this example. Pre-phosphorylated patch units and flaps are added together with the M13mp18 DNA vector and ligated together. After the ligation of the flaps to the patch units which are ligated to the M13mp18 DNA, the BamH1 enzyme is introduced to linearize the vector. Prepare a batch of nanoreporters starting with 5 μg of M13mp18 as a scaffold. The hybridization may be scaled up accordingly to the desired amount. This process will take about 1-2 days to complete.

[0401]Materials:

[0402]

QtyItemVendor20250 ug / ul M13mp18 viral ssDNANew EnglandBiolabs27ul0.74 pmol / ul Oligonucleotide Patch Unit MixIDT8ulLong Flap Oligonucleotide A 100 pmol / ulIDT8ulLong Flap Oligonu...

example 3

6.3 Example 3

Protocol for Production of RNA Nanoreporters

[0418]Nanoreporters were generated and successfully employed to detect target molecules using methods substantially as described in this example. An example of target detection using such this method is shown in FIG. 6.

[0419]Scaffold Production. Single-stranded circular M13mp18 DNA (USB) was annealed to a 5-fold molar excess of an oligonucleotide complementary to the Bam HI recognition site (Bam Cutter oligo) and cut with Bam HI restriction enzyme to yield a linear single-stranded DNA backbone. An oligonucleotide complementary to the Barn Cutter oligonucleotide (anti-Bam oligonucleotide) was subsequently added in 50-fold excess to sequester free Bam Cutter oligonucleotide and thus prevent recircularization of the M13 during later steps. The linear M13 molecule serves as a scaffold onto which RNA patches, or RNA segments, with incorporated fluorophores can be annealed.

[0420]PCR to form double-stranded positions on the M13 scaff...


PUM


Abstract

Methods, computers, and computer program products for detecting the presence of a probe within a sample overlayed on a substrate are provided. The probe comprises a plurality of spatially arranged labels. A data storage module stores a plurality of light images, where each light image has light from the sample at a corresponding wavelength range in a plurality of different wavelength ranges. A label identification module identifies a plurality of labels in the plurality of light images that are proximate to each other on the substrate. A spatial order of the plurality of labels determines a string sequence of the plurality of labels. A probe identification module determines whether the string sequence of the plurality of labels comprises a valid reporter sequence.

Description

[0001]This application claims the benefit under 35 U.S.C. §119(e) of U.S. Provisional Application No. 60 / 802,862 filed May 22, 2006, which is incorporated herein by reference in its entirety.1. FIELD OF THE INVENTION[0002]The present invention relates to compositions and methods for detection and quantification of individual target molecules in biomolecular samples. In particular, the invention relates to coded, labeled reporter molecules, referred to herein as labeled “nanoreporters,” that are capable of binding individual target molecules. Through the nanoreporters' label codes, the binding of the nanoreporters to target molecules results in the identification of the target molecules. Methods of making and using such nanoreporters are also provided. The nanoreporters can be used in diagnostic, prognostic, quality control and screening applications.2. BACKGROUND OF THE INVENTION[0003]Although all cells in the human body contain the same genetic material, the same genes are not acti...

Claims


Application Information

Patent Timeline
Patent Type & Authority Patents(United States)
IPC IPC(8): G06F11/00G16B25/00
CPCB82Y30/00C40B20/04G06F19/20C40B70/00G06F19/16G16B15/00G16B25/00
Inventor HWANG, JENQ-NENGMITTON, JEFFREY D.
Owner NANOSTRING TECH INC
Why Eureka
Try Eureka