
Method for evaluating relative oxygen saturation in body tissues
a technology of relative oxygen saturation and body tissue, which is applied in the field of evaluating relative oxygen saturation in body tissues, can solve the problems of limiting the use of animal models, preventing clinical applications, and affecting the clinical application and the use of dyes in humans has yet to be approved
- Summary
- Abstract
- Description
- Claims
- Application Information
AI Technical Summary
Benefits of technology
Problems solved by technology
Method used
Image

Examples
example 1
Materials and Methods
[0025]Animals. The use of animals in this study was approved by the Louisiana State University Health Sciences Center Institutional Animal Care and Use Committee and conformed to current standards in the use of animals in ophthalmic and vision research.
[0026]Two cynomolgus monkeys with normal eyes were used. The monkeys were anesthetized, and their eyes dilated. The initial opthalmologic examination included fluorescein angiography, color and red-free fundus photography, and slit-lamp examination of the fundus. To measure oxygen saturation of the optic nerve head (ONH) and paired retinal vessels, a contact lens was placed on the cornea to prevent drying, and reflectance hyperspectral imaging measurements as described below were obtained in one eye of each monkey. During imaging, pure oxygen was administered to one monkey to directly control blood oxygen saturation, and intraocular pressure (IOP) was controlled in the other monkey using methods described below.
[0...
example 2
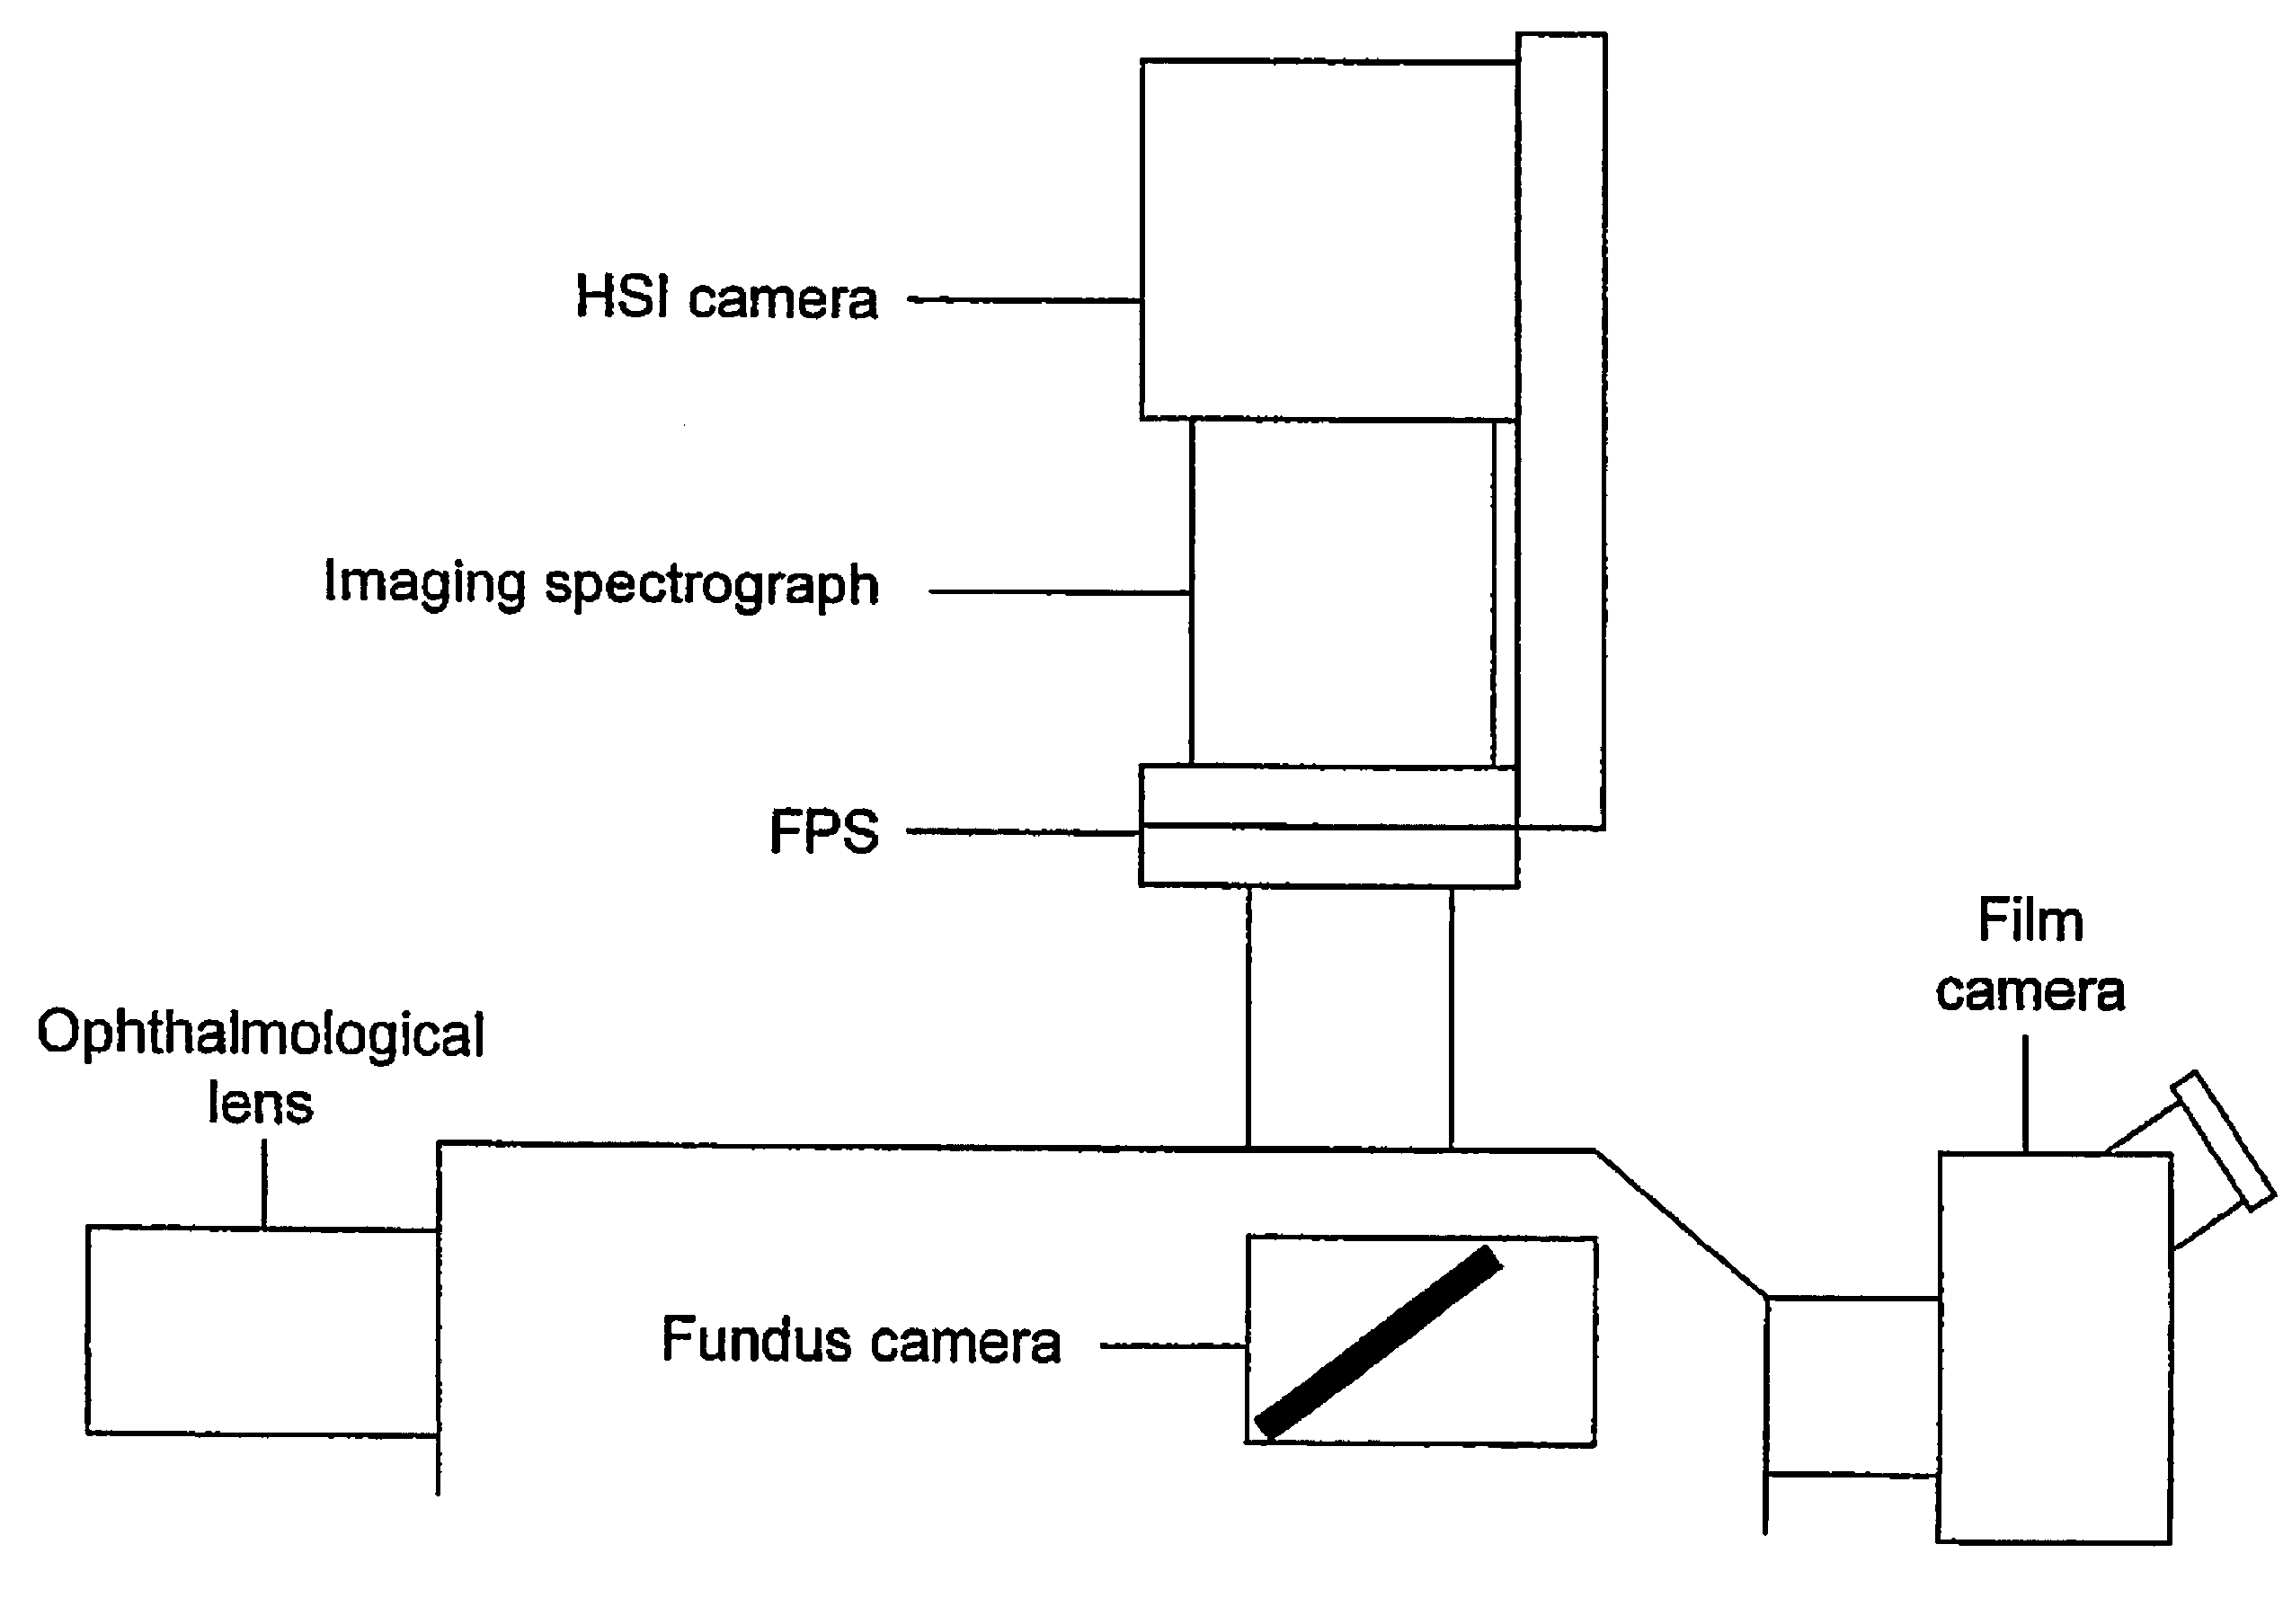
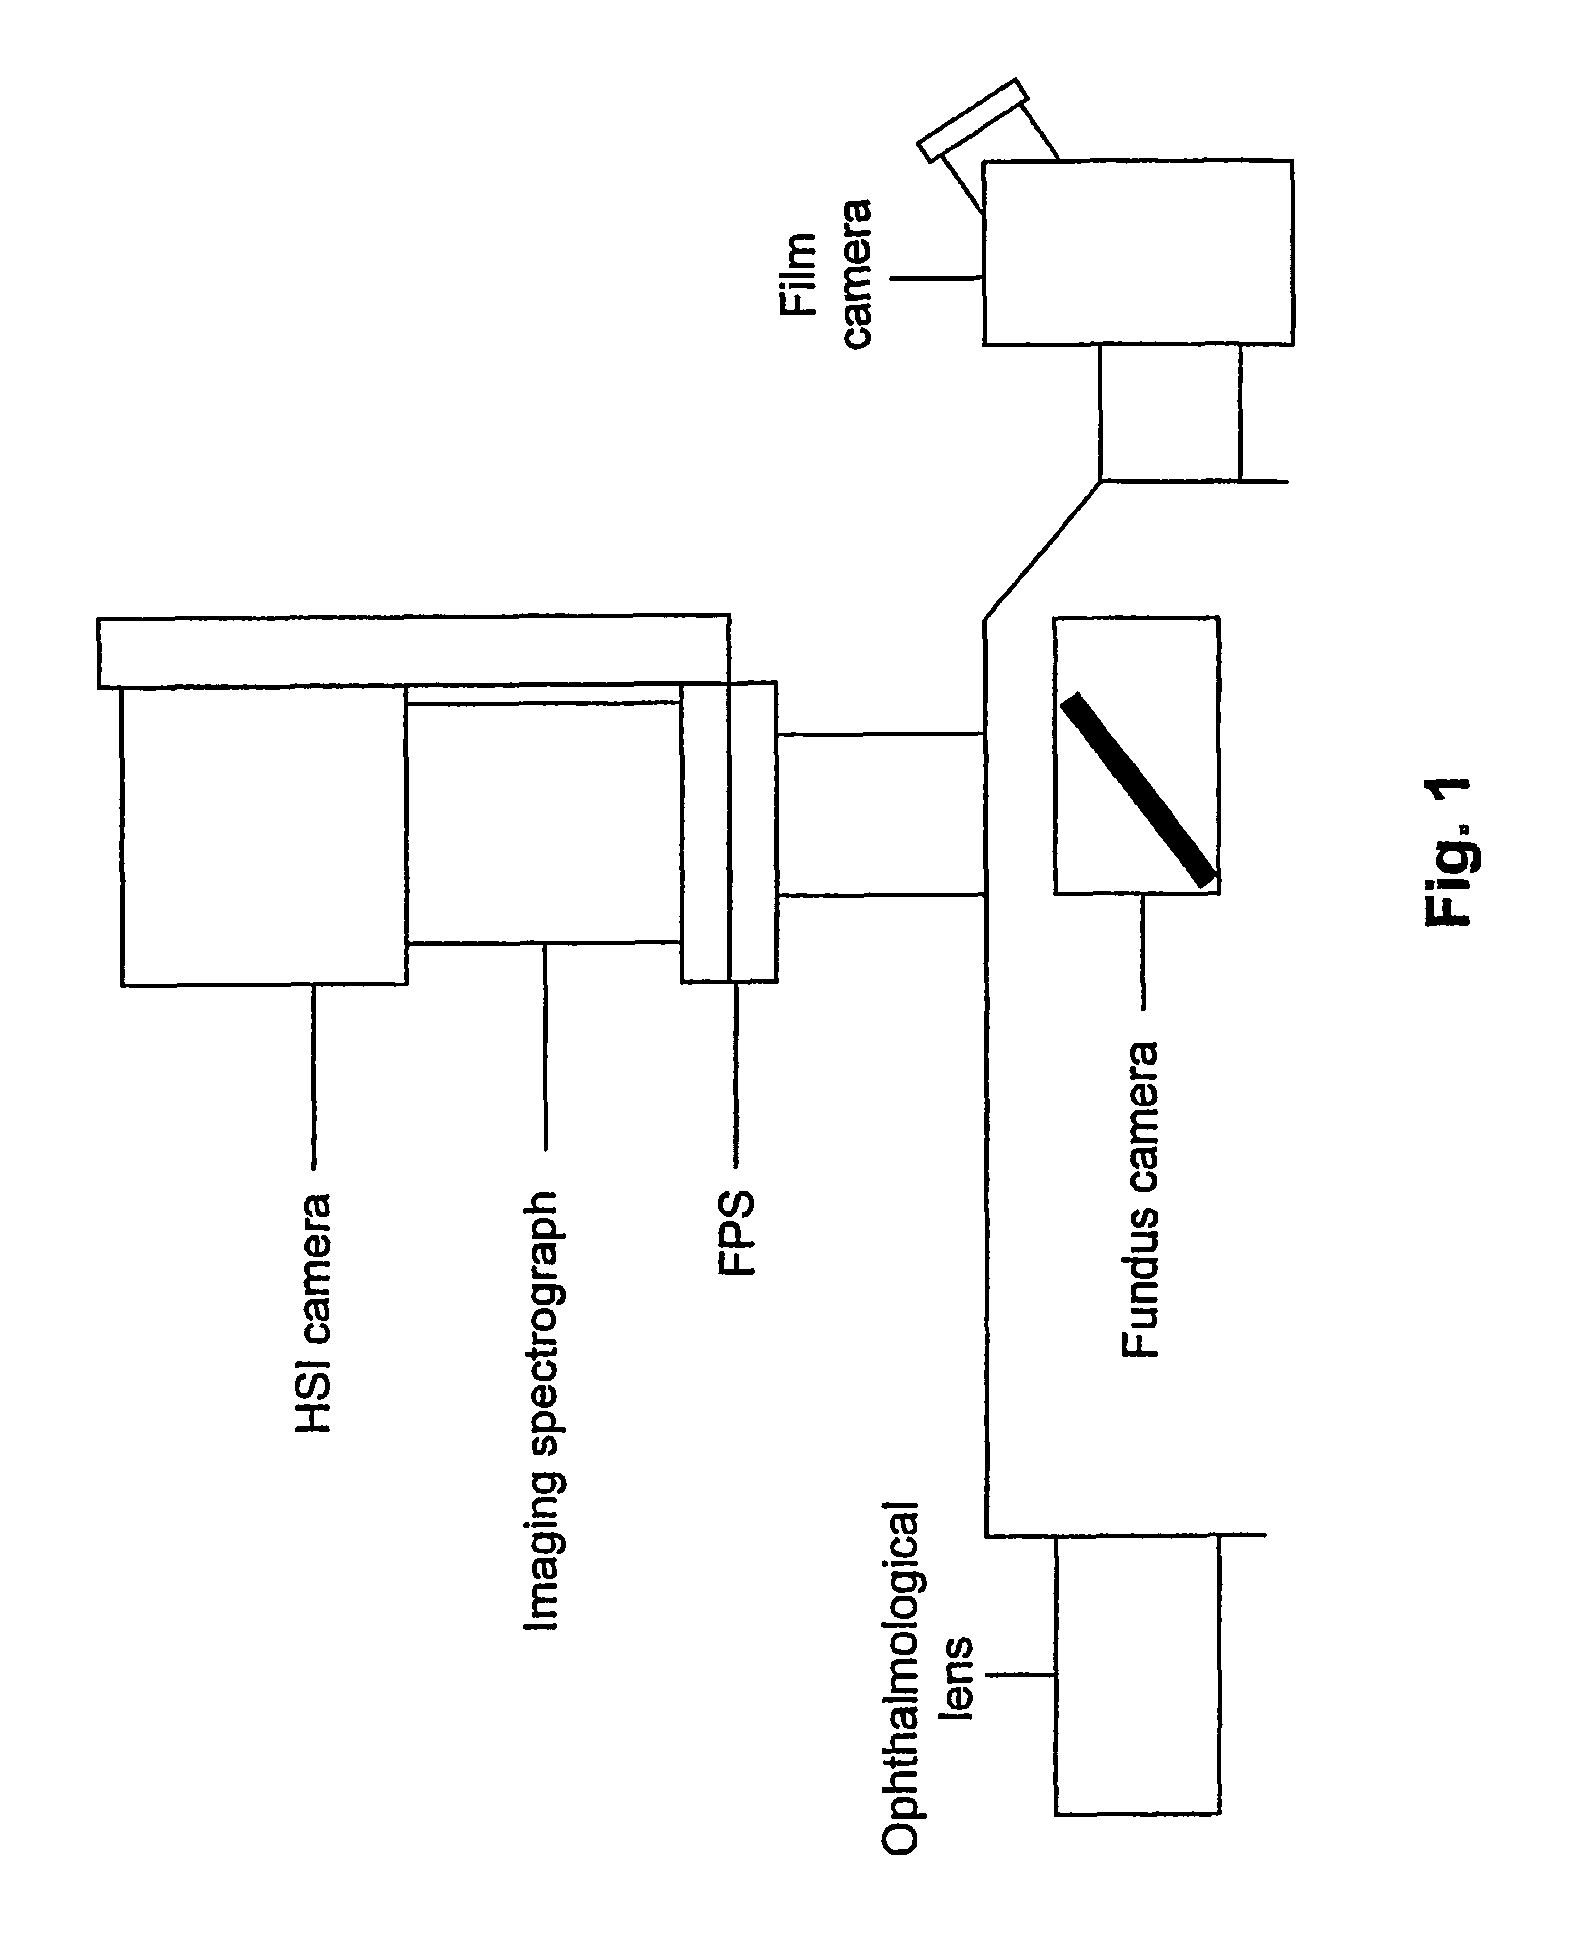
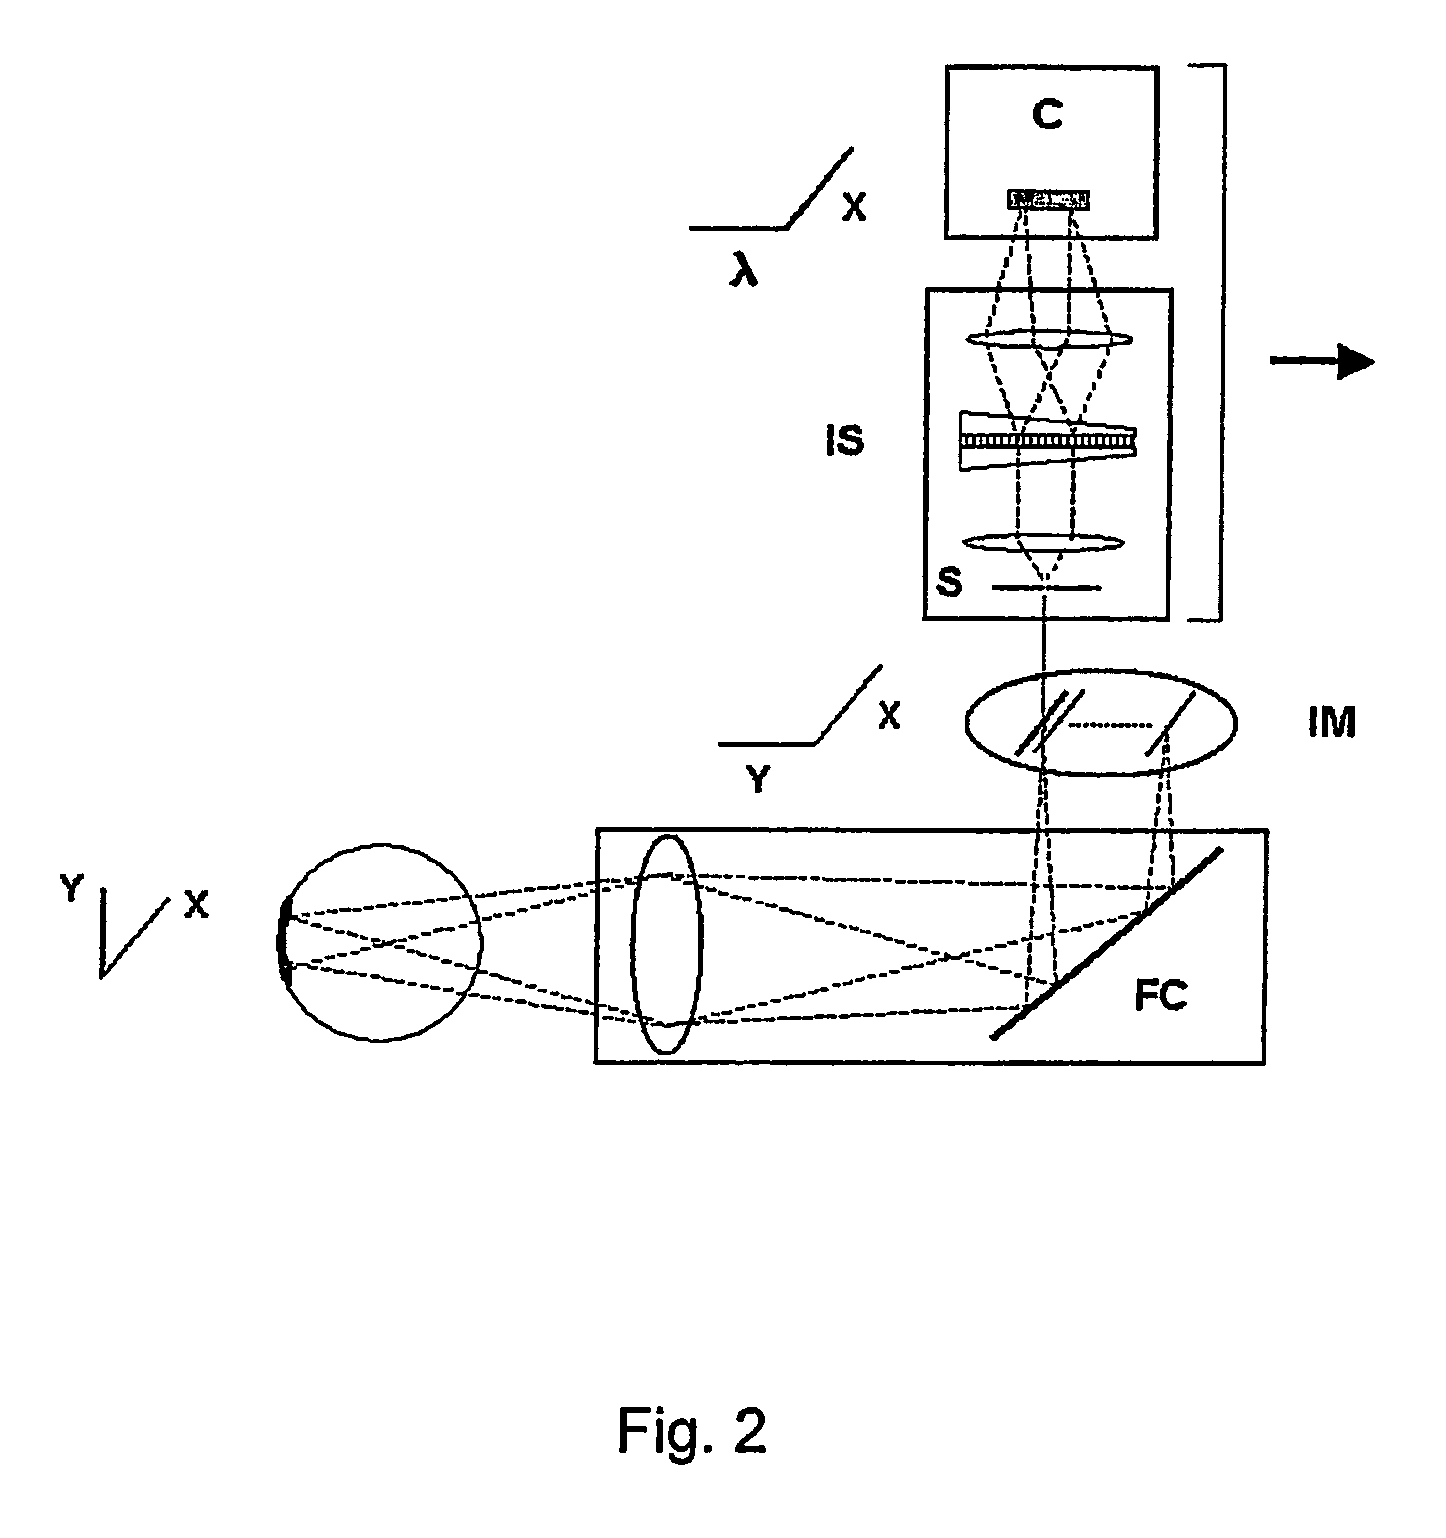
[0029]Fundus Camera. The retina was illuminated with the internal tungsten aiming light of a fundus viewing camera (TRC-50vt, Topcon, Japan), similar to the procedure described in U.S. Pat. Nos. 5,919,132; and 6,276,798. Images were acquired using this camera with an opthalmologic lens and a c-mount through the vertical path of the camera. Hyperspectral images were obtained through the vertical viewing port using an imaging spectrograph and digital camera, as described below. FIG. 1 shows the components and position of the hyperspectral imager on the fundus camera. The image normally formed at the film camera port. During hyperspectral imaging, the image is redirected upward by a mirror. The imaging system is translated over the camera port by a linear actuator mounted below the imaging spectrograph and charge-coupled device (CCD) camera. A vertical mounting facilitated image scanning by maintaining the center of gravity of the moving components over the ...
example 3
Mapping Relative Oxygen Saturation
[0035]Reference Spectra for High and Low Oxygenation States: Relative saturation was assessed from amplitudes of the hemoglobin spectral signatures that were contained in the reflectance spectra from retinal blood. As saturation was decreased from a high to a low value, spectral minima at 542 and 577 nm from oxygenated hemoglobin (HbO2 spectral signature) were converted to a single minimum at 555 nm from deoxyhemoglobin (Hb spectral signature). No changes occurred at wavelengths where HbO2 and Hb spectral curves crossed (isosbestic points). These spectral features from reflectance recordings at high and low saturation are shown in FIG. 4. Although the sloping baseline produces a slight blue-shift of spectral minima, only the areas under curves are used in this method. In FIG. 4, reflectance spectra of oxygen-saturated blood (HbO2 signature, bold curve) and oxygen-desaturated blood (Hb signature, thin curve) are shown from retinal recordings. The HbO...
PUM
 Abstract
Description
Claims
Application Information