Method for monitoring anticoagulant therapy
a technology of anticoagulant therapy and monitoring method, which is applied in the field of medical diagnosis and drug monitoring, can solve the problems of clogging arteries, fatal bleeding, and risk of blood clot formation, and achieve the effect of accurate reflection of clottability, antithrombotic effect, and measurement of the generation of thrombin or fibrin
- Summary
- Abstract
- Description
- Claims
- Application Information
AI Technical Summary
Benefits of technology
Problems solved by technology
Method used
Image
Examples
example 1
PT and P&P in Relation to Selective Reduction in Individual VKD Factors
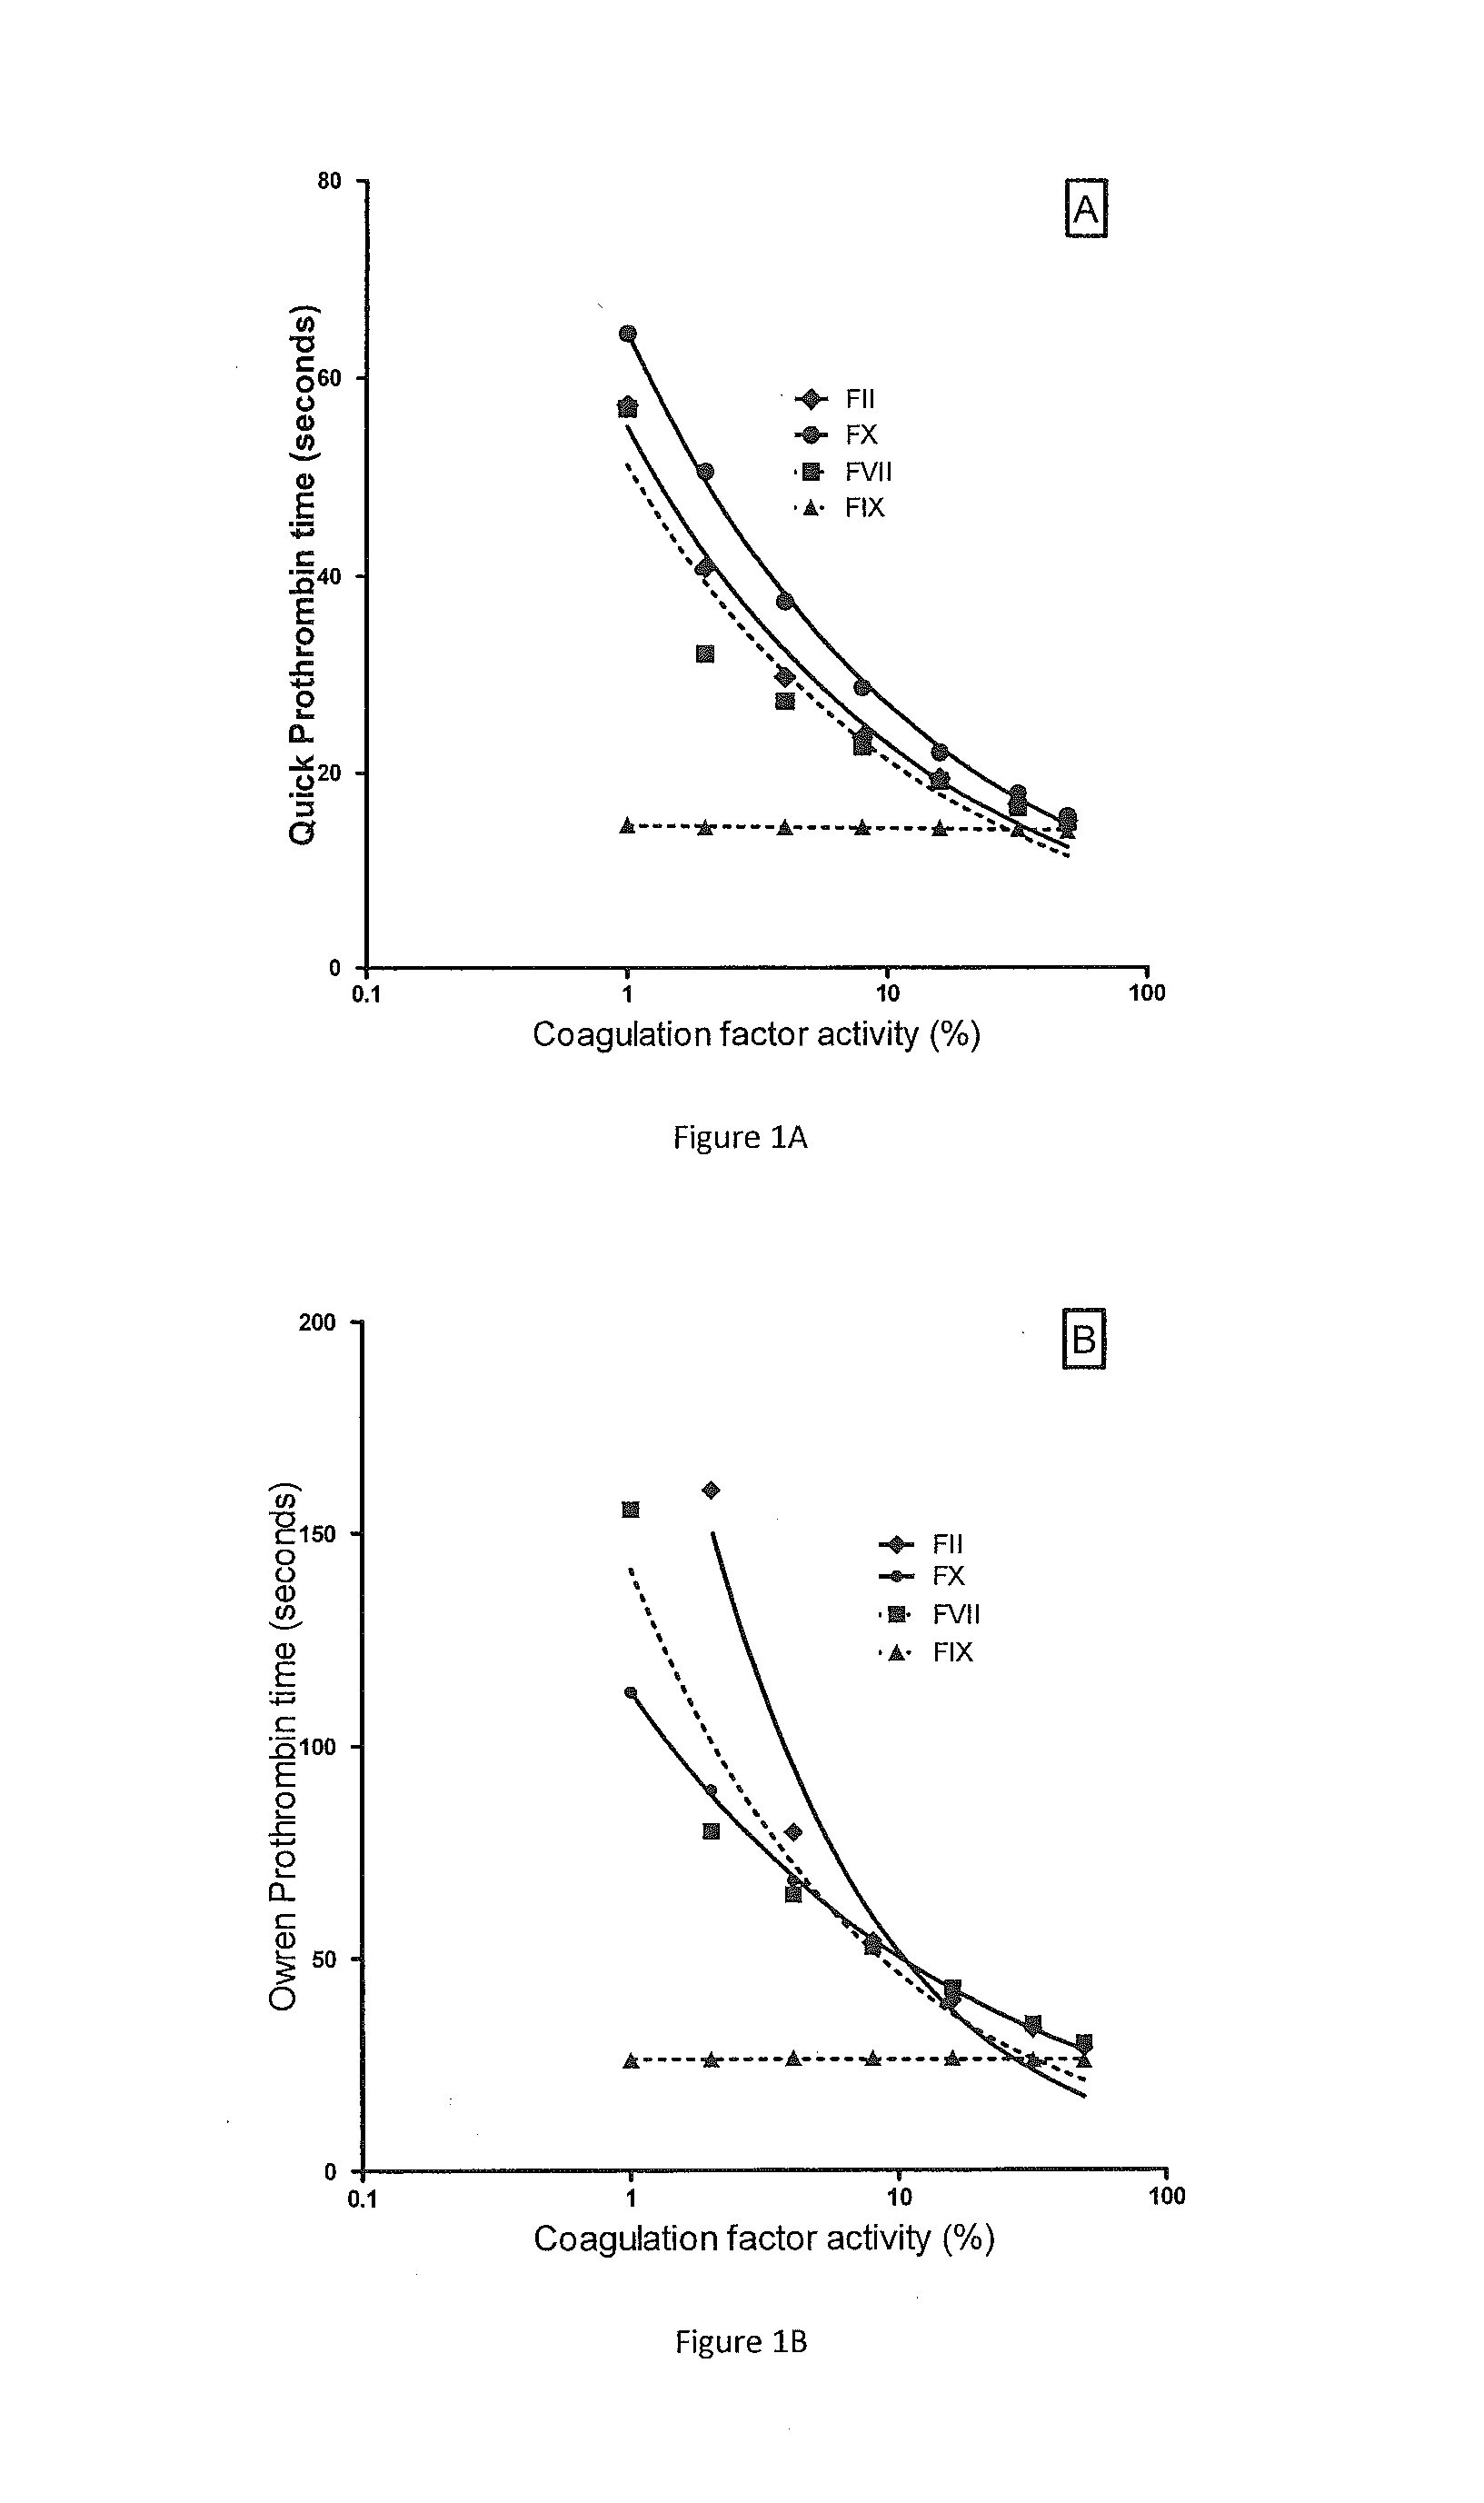
[0057]The relationship between PT and reduced concentration of selected VKD coagulation factors FII, FVII, FIX or FX in PPP is shown in FIG. 1. The Quick prothrombin time is shown in panel A and Owren's prothrombin time (P&P) in panel B. The experiments were done by gradually repleting plasma completely immunodepleted of a single factor by gradually mixing in normal plasma. As expected, both types of PT measurements (Quick and Owren) were equally sensitive to the concentration of FII, FVII and FX throughout the tested concentrations whereas neither measurement was sensitive to the FIX activity.
example 2
Correlation of ROTEM Parameters to Owren's PT in Samples from Patients on Warfarin
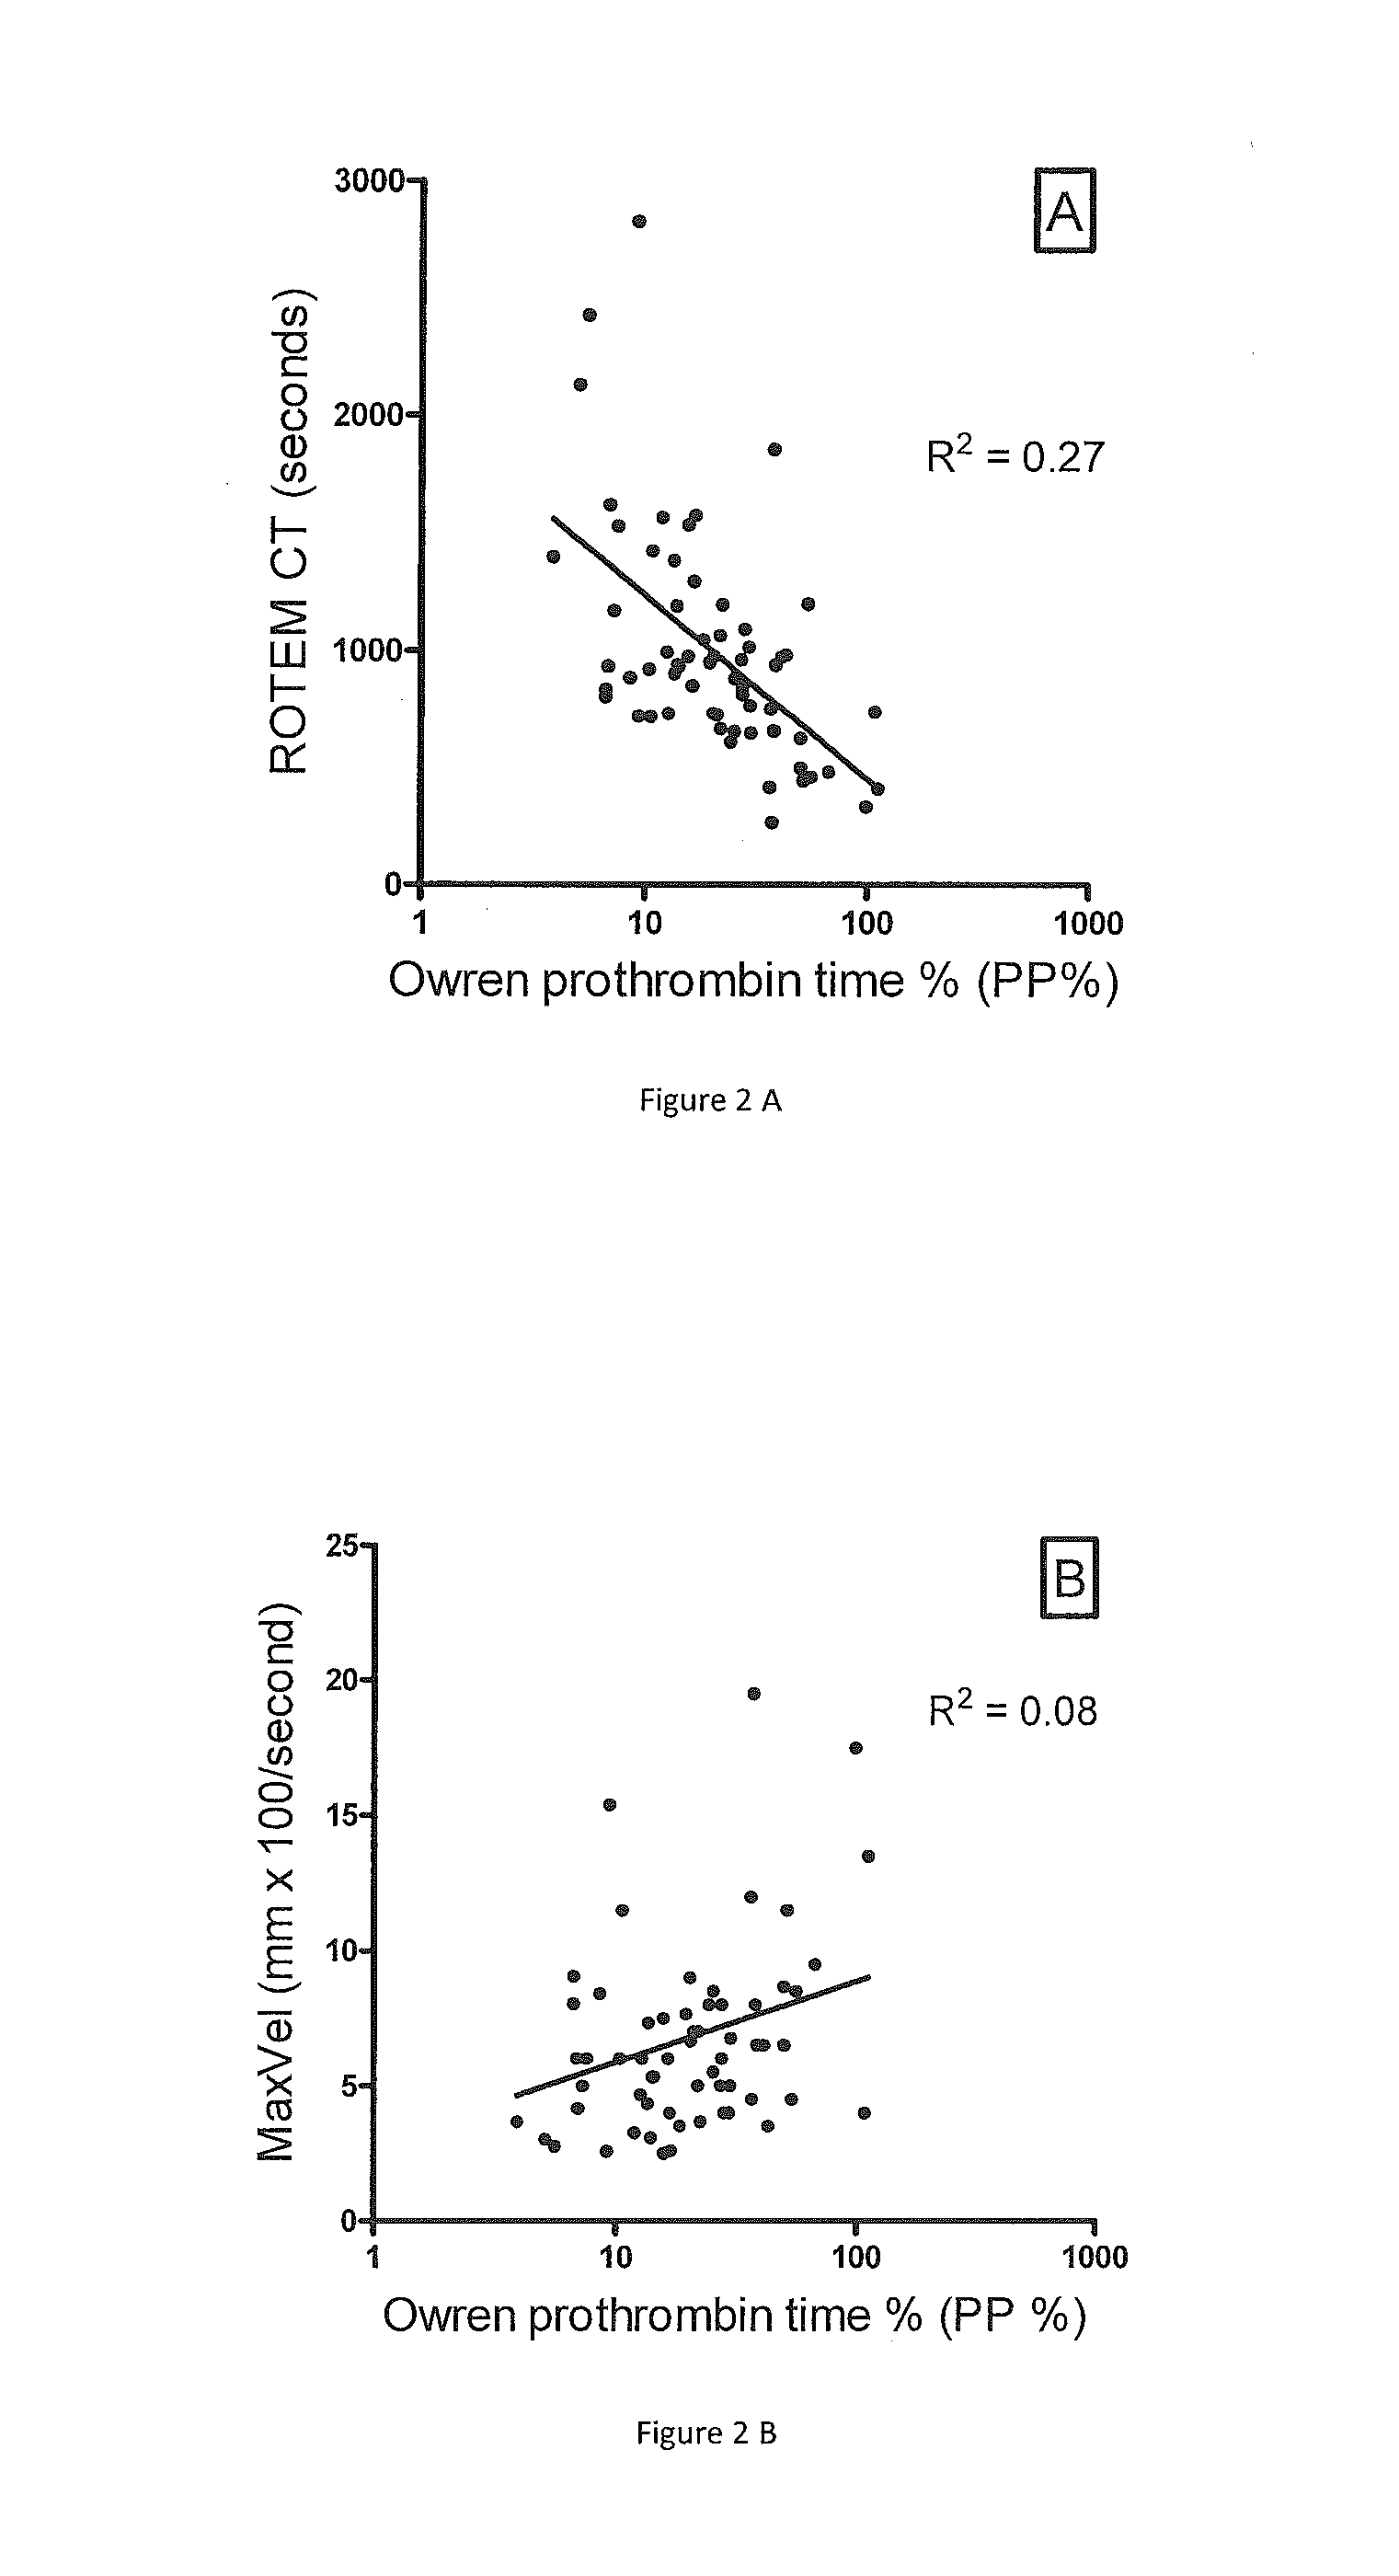
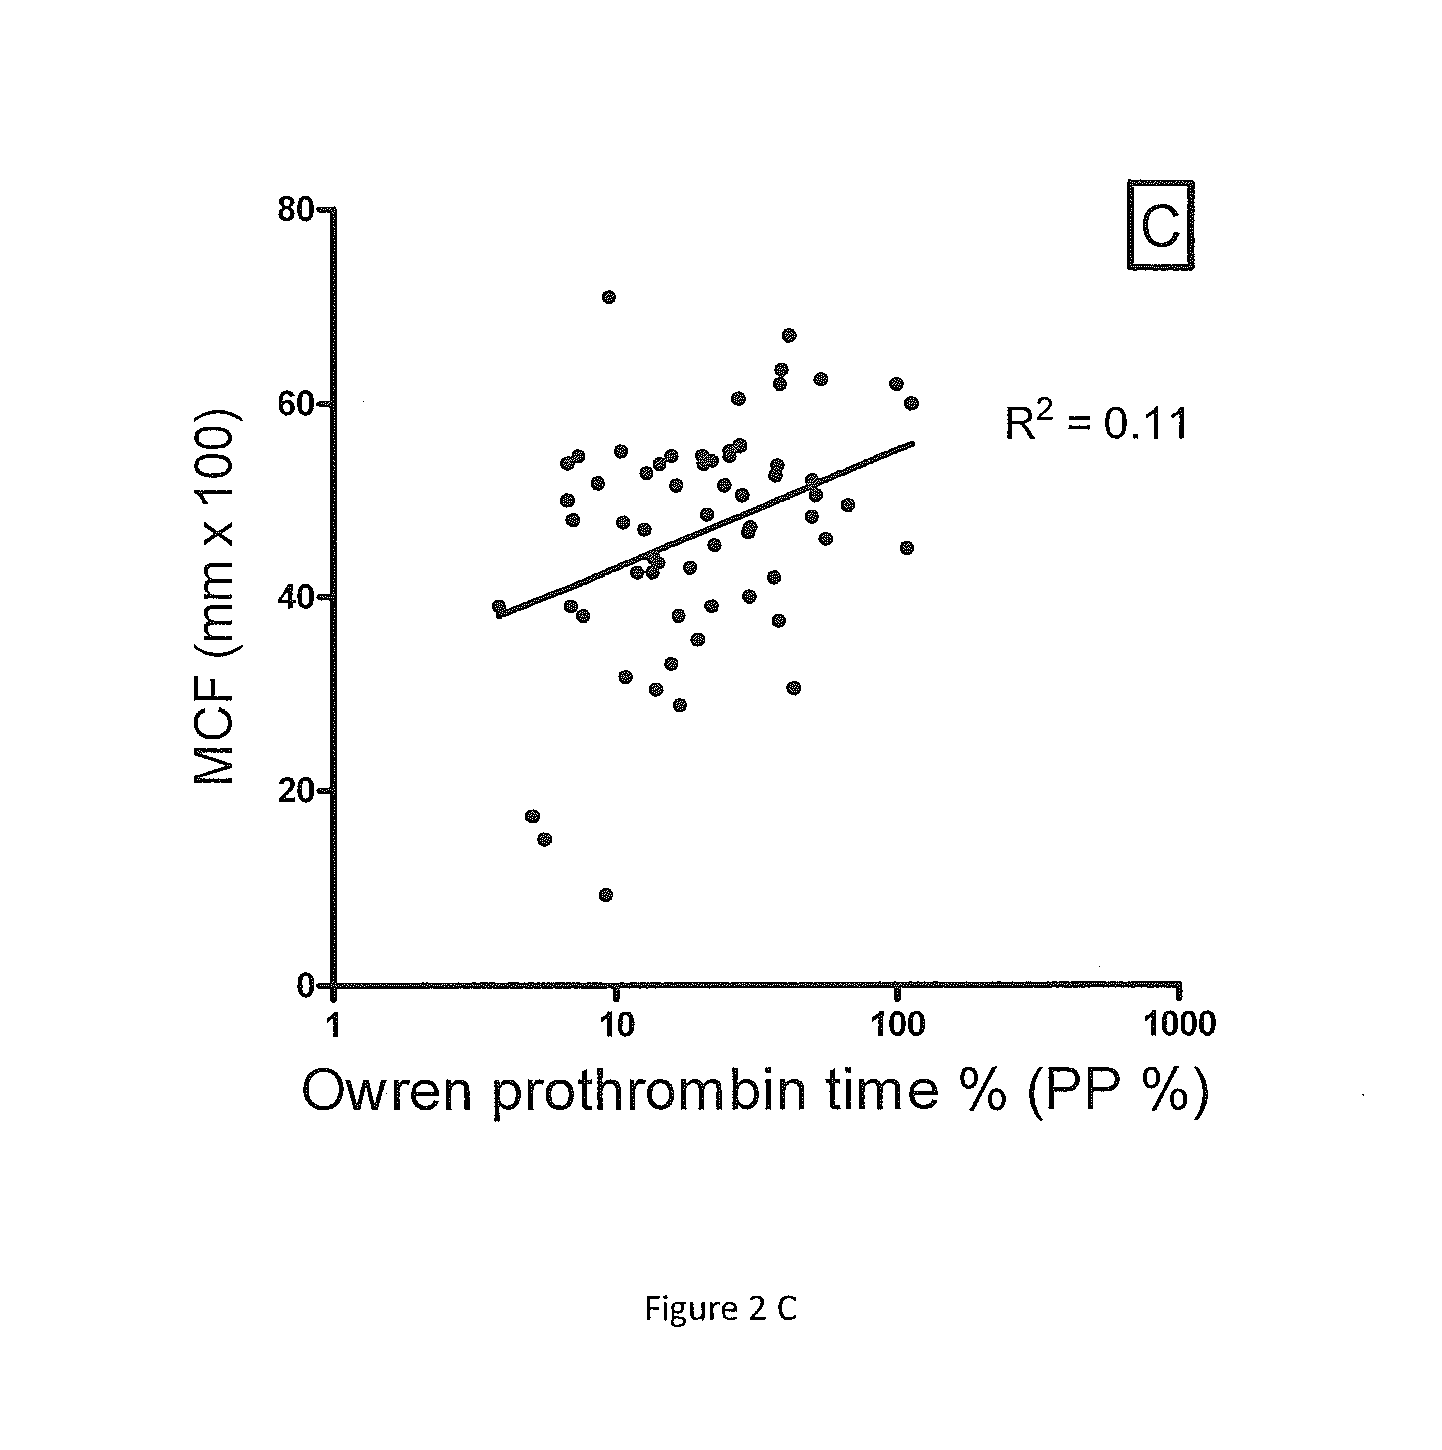
[0058]ROTEM parameters and P&P test results were compared in PPP samples obtained from 65 consecutive patients on warfarin attending the anticoagulation clinic (FIG. 2). There was only a moderate correlation between the P&P test percent coagulant activity and the ROTEM CT (R2=0.27, p2=0.08, p2=0.11, p=0.0014). Similar results are seen if the INR is plotted against the ROTEM parameters (not shown). ROTEM parameters were also measured in adsorbed PPP equally depleted of all VKD factors. By mixing in progressively increased concentrations of pooled normal PPP, the adsorbed plasma was gradually repleted with equal concentrations of VKD factors. With all VKD factor concentrations equally reduced, a good correlation was found, i.e. R2 by non-linear regression was 0.79 for the ROTEM CT, 0.64 for the ROTEM MaxVel and 0.77 for the ROTEM MCF (curves not shown).
example 3
ROTEM Parameters in Relation to Selective Reduction of Individual VKD Factors
[0059]In order to separately evaluate the influence of each VKD factor on ROTEM parameters, we tested coagulation with ROTEM in PPP selectively immunodepleted of a single individual VKD factor and then gradually repleted the relevant deficient factor by mixing in normal plasma. The data shown in FIG. 3 relate to experiments in PPP without added platelet phoshpolipid or washed platelets. The ROTEM CT (initiation phase) (FIG. 3A) was prolonged markedly more by gradual selective reduction in FII or FX at mildly and moderately low levels (similar to those aimed for during anticoagulation) than by similar reductions in FVII or FIX. The results were similar in PPP with added platelet phospholipid and in PPP with added washed platelets (data not shown). The ROTEM MaxVel (FIG. 3B) representing the propagation phase of ROTEM clot formation was also more dependent on the FII and FX concentration than on the FVII or F...
PUM
| Property | Measurement | Unit |
|---|---|---|
| prothrombin time | aaaaa | aaaaa |
| pH | aaaaa | aaaaa |
| temperature | aaaaa | aaaaa |
Abstract
Description
Claims
Application Information
 - R&D
- Intellectual Property
- Life Sciences
- Materials
- Tech Scout
- Unparalleled Data Quality
- Higher Quality Content
- 60% Fewer Hallucinations
Browse by: Latest US Patents, China's latest patents, Technical Efficacy Thesaurus, Application Domain, Technology Topic, Popular Technical Reports.
© 2025 PatSnap. All rights reserved.Legal|Privacy policy|Modern Slavery Act Transparency Statement|Sitemap|About US| Contact US: help@patsnap.com


