

Phosphor and method for production thereof, and light source
A manufacturing method and technology of phosphors, applied in the field of phosphors, can solve the problems of unsatisfactory and high proportions, and achieve the effect of cheap manufacturing costs
- Summary
- Abstract
- Description
- Claims
- Application Information
AI Technical Summary
Problems solved by technology
Method used
Image

Examples
Embodiment 1
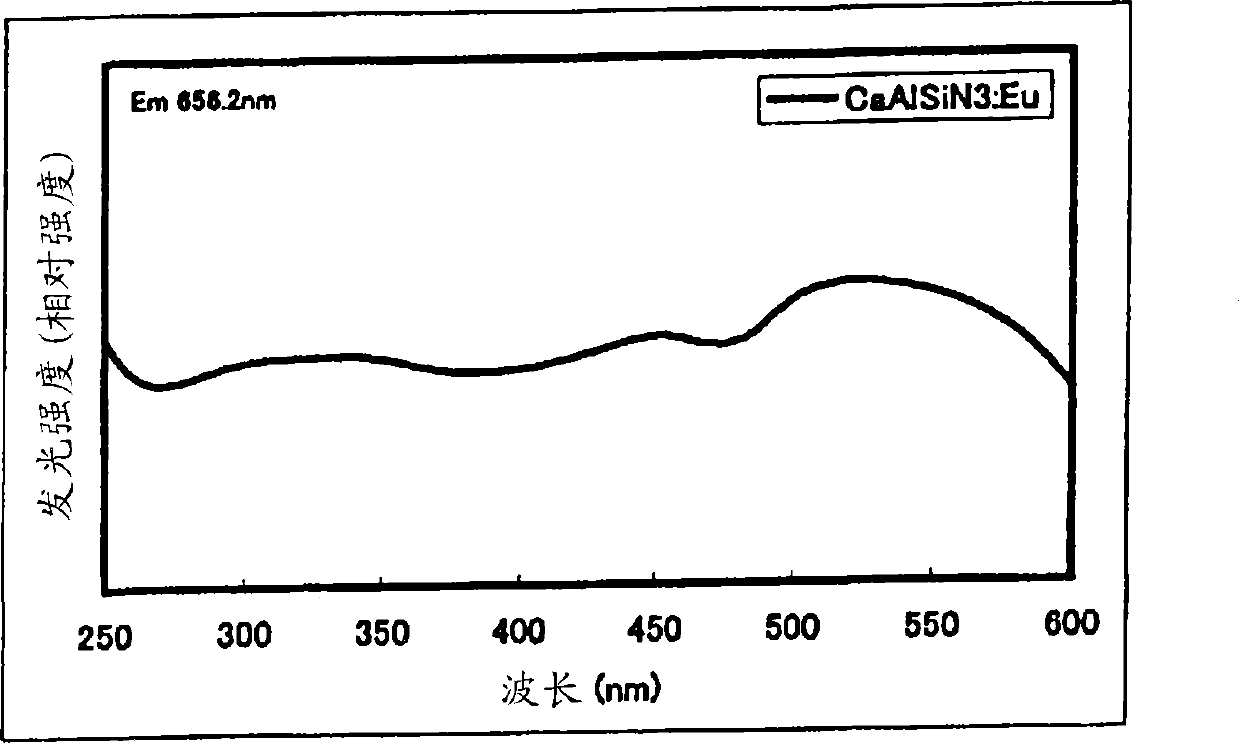
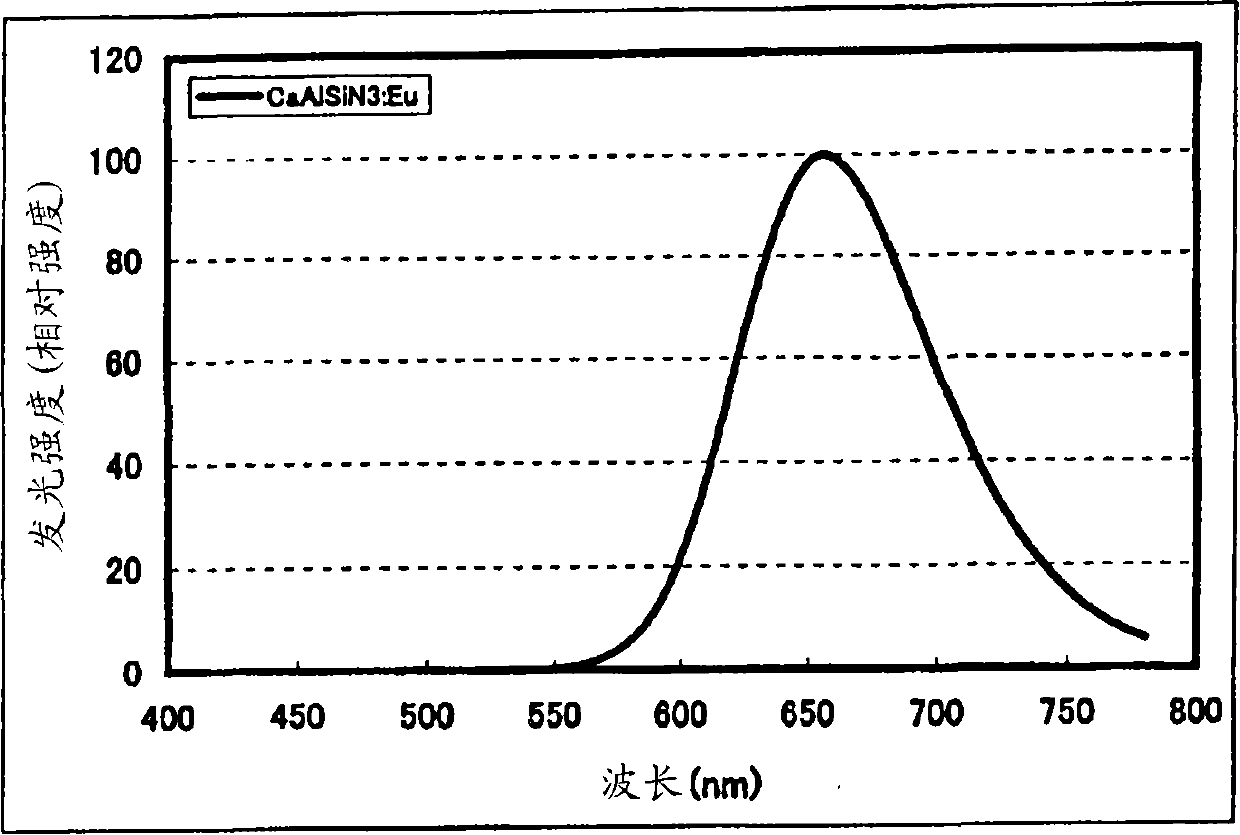
[0118] Ready to market Ca 3 N 2 (2N), AlN(3N), Si 3 N 4 (3N), Eu 2 o 3 (3N), respectively by Ca 3 N 2 is 0.985 / 3mol, AlN is 1.0mol, Si 3 N 4 is 1 / 3mol, Eu 2 o 3 0.015 / 2mol Each raw material was weighed and mixed in a spherical body under an inert atmosphere of nitrogen using a mortar. Put the mixed raw materials into the crucible and set it in the firing furnace. While maintaining the pressure of 0.05Mpa, let the nitrogen gas of 1.0L / min flow through it in a nitrogen atmosphere pressurized to 0.05Mpa, and keep it at 1600°C After firing for 3 hours, cooling from 1600°C to 200°C in one hour, the composition formula Ca 0.985 AlSiN 3 :Eu 0.0150 Phosphors representing the generated phase. The SEM observation particle diameter of the obtained phosphor sample was 3-4 micrometers. (Even in Example 2 to Example 5 below, the SEM observation particle size of the obtained phosphor samples was 3 to 4 μm)
[0119] The obtained phosphor was irradiated with an excitation light...
Embodiment 2
[0134] Put the mixed raw materials into the crucible, keep it at 1500°C for 3 hours in a nitrogen environment for firing, and then cool it from 1500°C to 200°C for one hour, except to obtain the composition containing Ca 0.985 AlSiN 3 :Eu 0.0150 The phosphor of Example 2 was obtained in the same manner as in Example 1 except for the phosphor showing the generated phase.
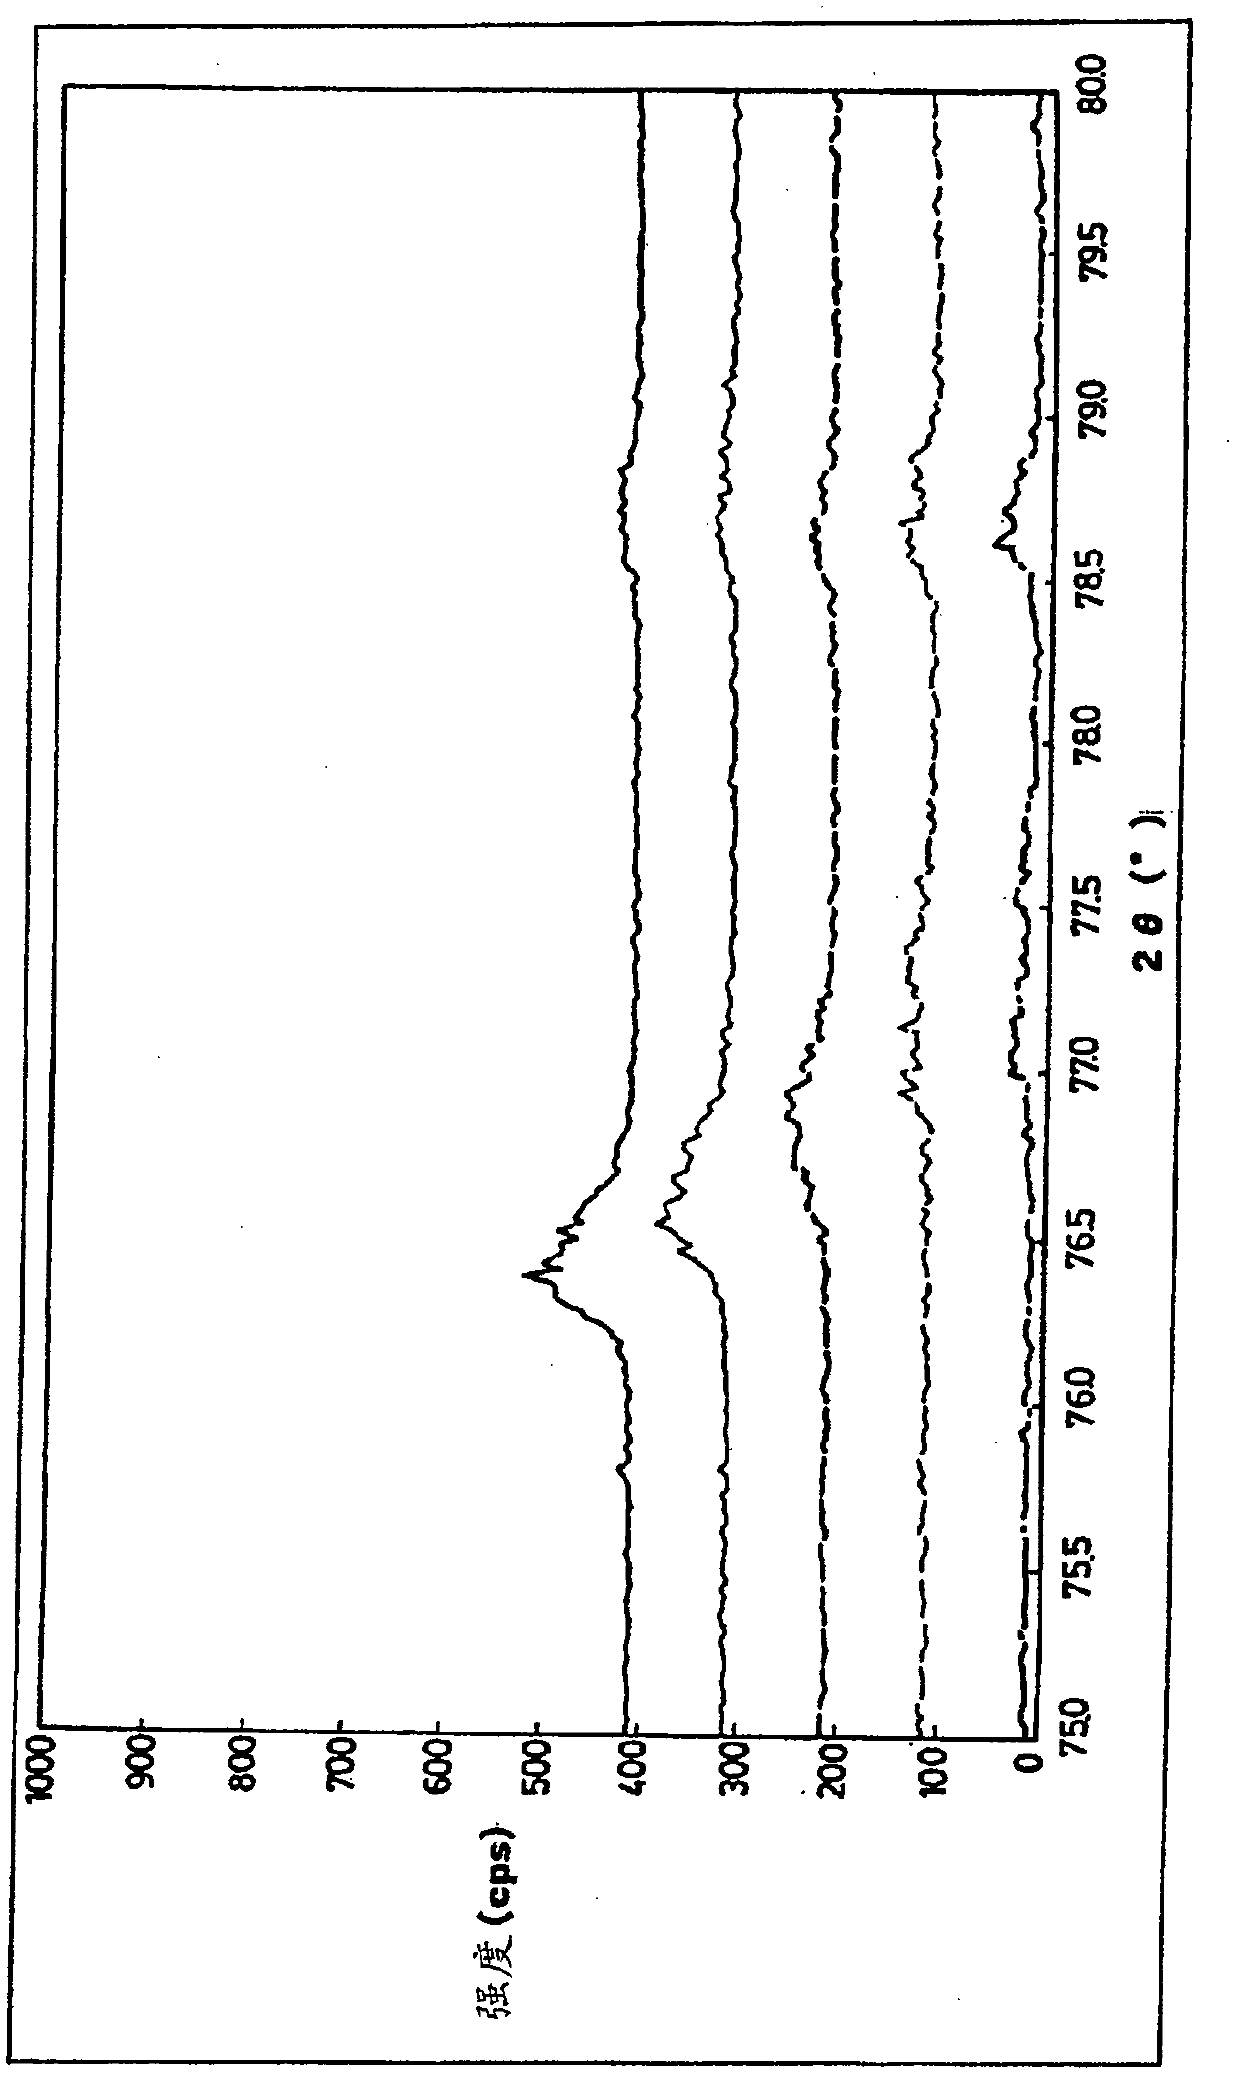
[0135] Table 1 shows the measurement results of the oxygen and nitrogen concentrations, luminescent properties and powder properties of the phosphor samples, and the obtained phosphor powder X-ray diffraction patterns are shown in Fig. 4(A) to Fig. 4 with thick solid lines. (G).
[0136] Figure 4(A) shows the X-ray diffraction patterns of the Bragg angle (2θ) in the entire range of 0°-90°, and Figure 4(B)-(G) are enlarged views of the characteristic parts of the Bragg angle. Figure 4(B) is in the range of 35°~40°, Figure 4(C) is in the range of 40°~45°, Figure 4(D) is in the range of 55°~60°, Figure 4(E) i...
Embodiment 3
[0138] In addition to setting the mixing ratio of each raw material to Ca 3 N 2 Except for (0.985-0.25) / 3mol and CaO being 0.25mol, a phosphor sample of Example 3 was produced in the same manner as in Example 2, and the emission characteristics were measured. Table 1 shows the measurement results of the oxygen and nitrogen concentrations, luminescence characteristics, and powder characteristics of the phosphor samples, and the obtained phosphor powder X-ray diffraction patterns are shown in Fig. 4(A) to Fig. 4 with thin solid lines. (G).
PUM
| Property | Measurement | Unit |
|---|---|---|
| particle size | aaaaa | aaaaa |
| particle size | aaaaa | aaaaa |
| size | aaaaa | aaaaa |
Abstract
Description
Claims
Application Information