Near-infrared spectrum method for rapidly quantifying honey quality

A technology of near-infrared spectroscopy and honey, which is applied in the field of spectroscopy to quantify the quality of honey, can solve the problems of a large number of reagents, affecting the efficiency of honey analysis, time-consuming, etc., and achieve the effects of fast analysis speed, reliable results, and simple pretreatment

Inactive Publication Date: 2009-04-22
BEE RES INST CHINESE ACAD OF AGRI SCI
View PDF0 Cites 41 Cited by
  • Summary
  • Abstract
  • Description
  • Claims
  • Application Information

AI Technical Summary

Problems solved by technology

However, analyzing these indicators at the same time is time-consuming, requiring a large amount of reagents and consumables, wh

Method used


Image

  • Near-infrared spectrum method for rapidly quantifying honey quality
  • Near-infrared spectrum method for rapidly quantifying honey quality
  • Near-infrared spectrum method for rapidly quantifying honey quality

Examples


Embodiment 1

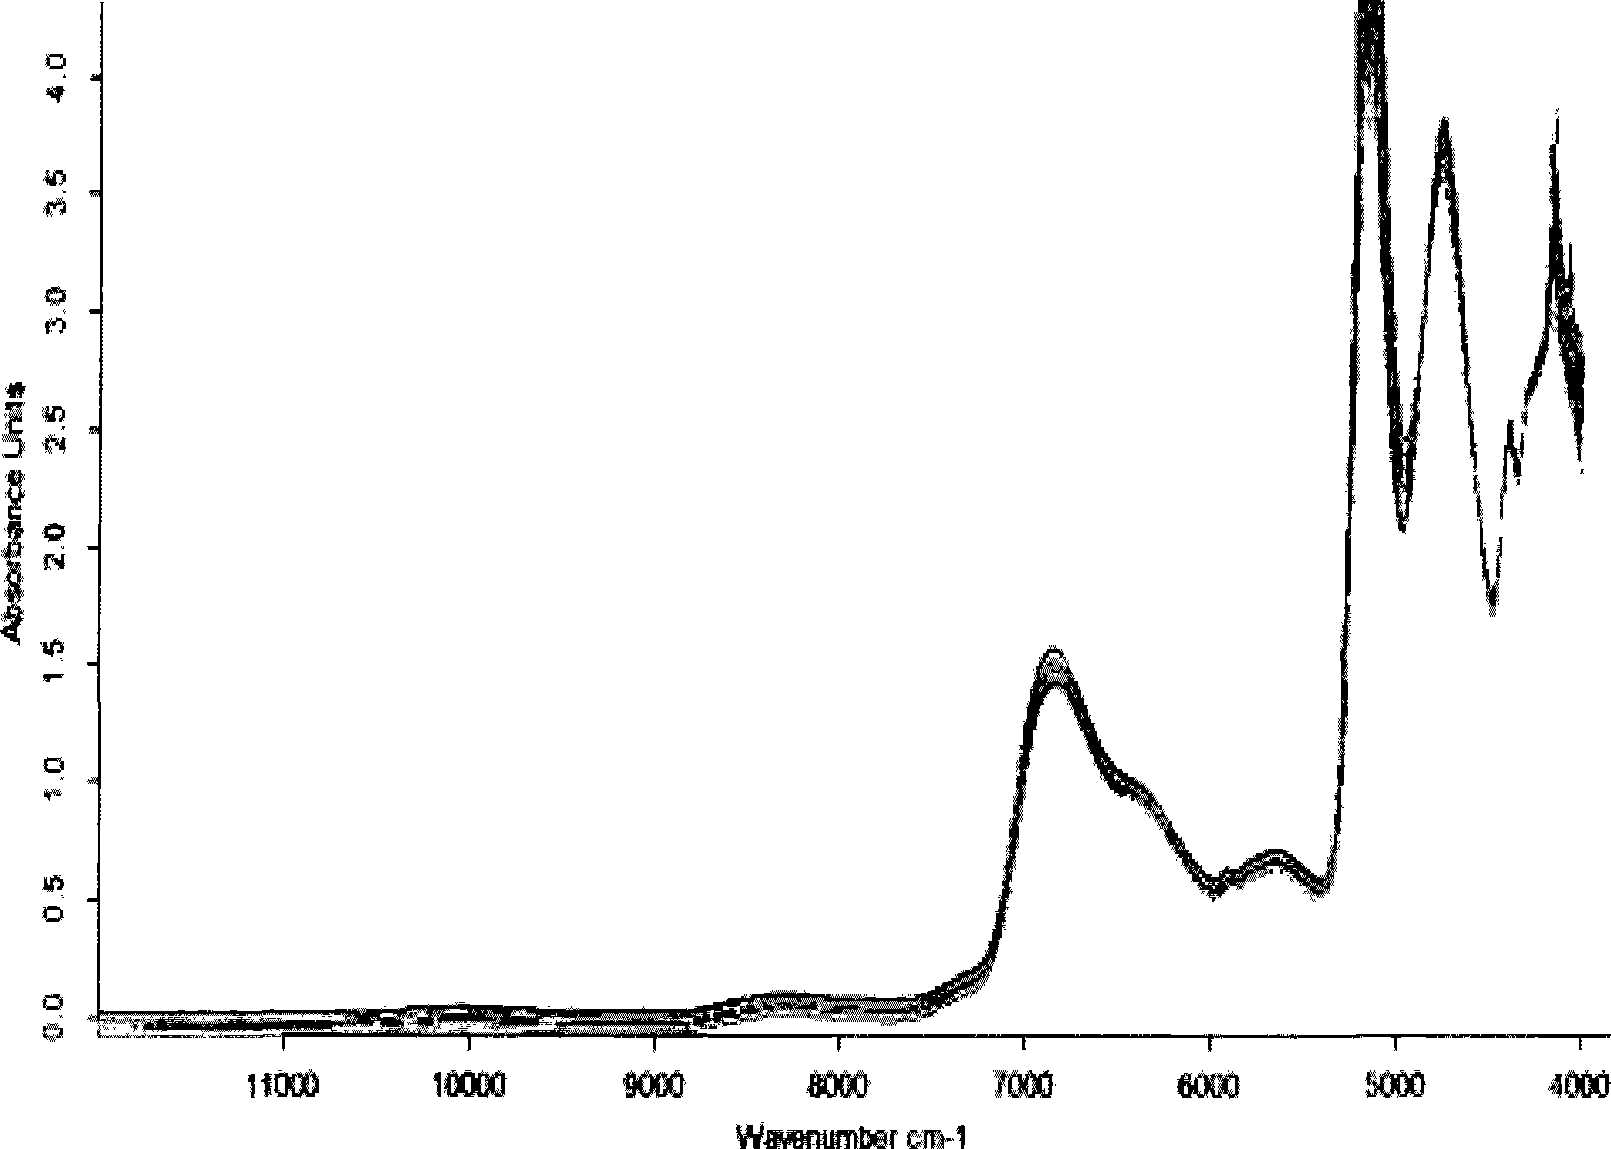
[0037] The near-infrared spectrogram of embodiment 1 honey sample

[0038] At least 50 samples (obtained from the market) were collected and randomly divided into a calibration set and a validation set (3:1). Crystallized honey was bathed in 40°C water until it was completely liquefied before analysis, and then placed at room temperature. Using Fourier transform near-infrared spectroscopy instrument and liquid fiber optic accessories to scan honey samples, the light source is tungsten-halogen lamp, indium gallium arsenic (InGaAs) detector, scanning range: 10000cm -1 ~4000cm -1 . Number of scans: 32 times, resolution: 8cm -1 . Each sample was measured in parallel 3 times, and the average spectrum was taken (see figure 1 ).

Embodiment 2

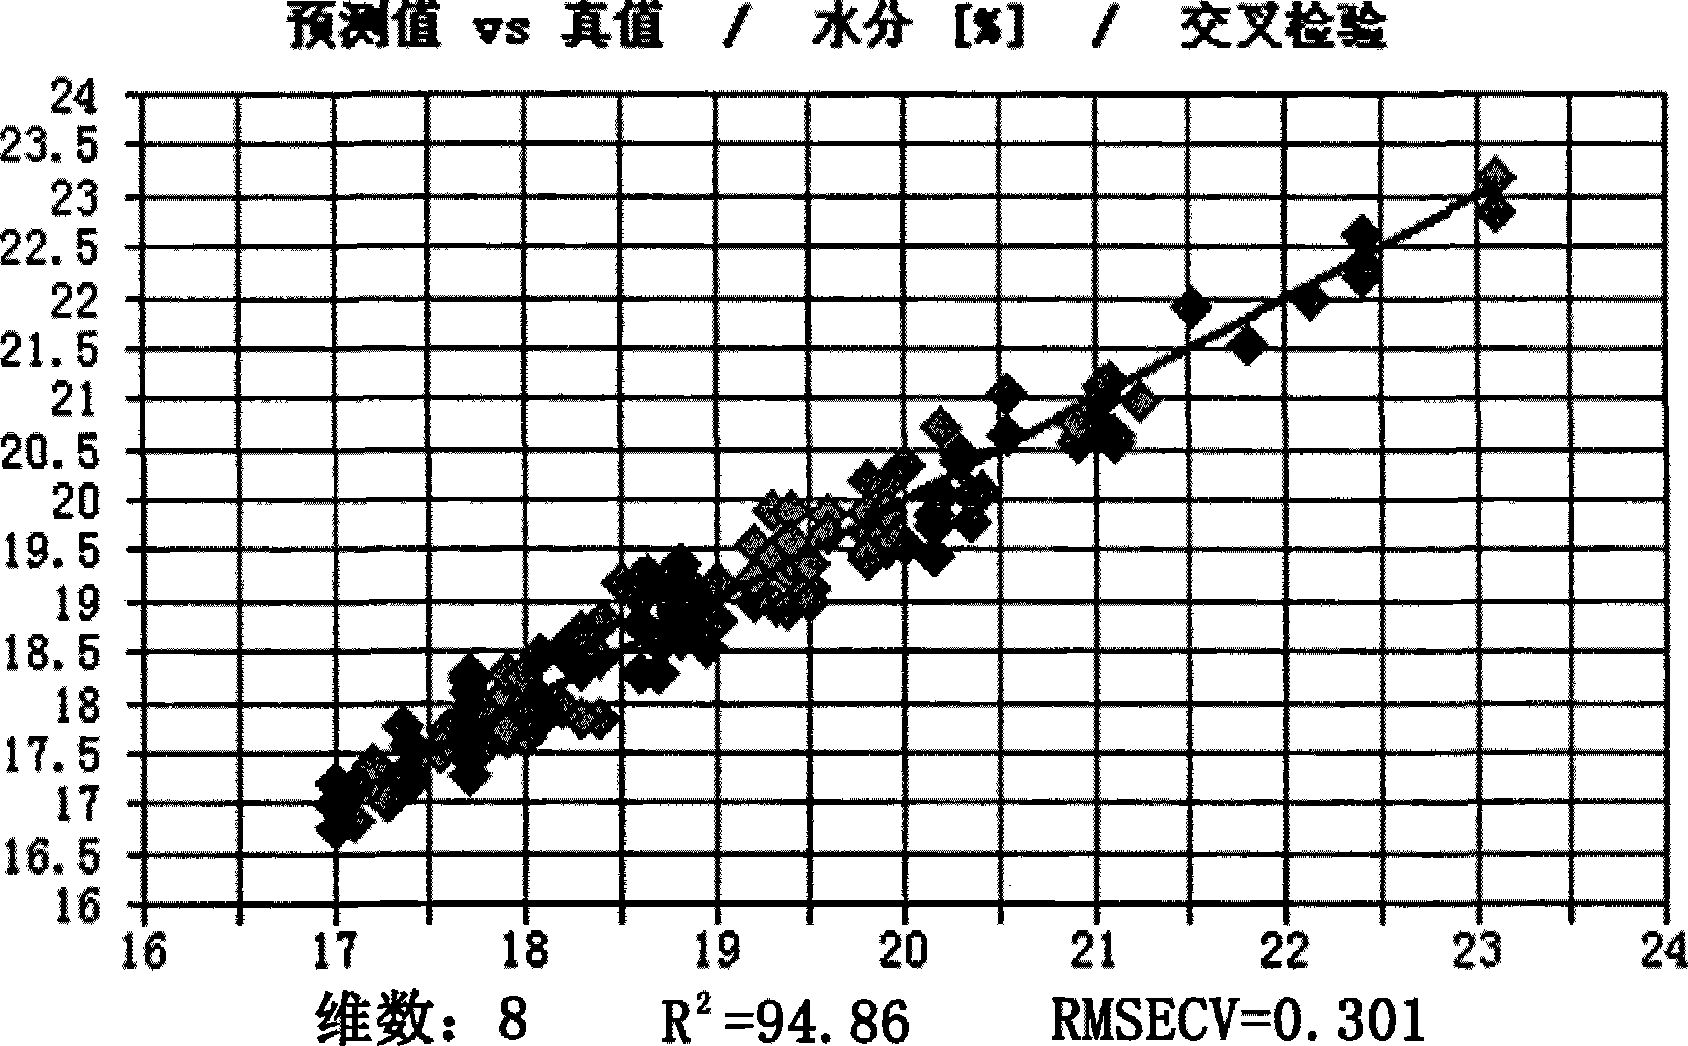
[0039] Embodiment 2 honey moisture model

[0040] 2.1 Moisture model establishment

[0041] According to the GB18796-2005 honey standard, the moisture content of the honey sample of Example 1 was measured by the refractive index method, and the OPUS5.5 software was used to carry out second-order derivative spectral preprocessing on the sample spectrum collected in Example 1, and the partial least squares method was used to establish Mathematical model, carry out cross-validation to the model, obtain moisture NIR prediction value and true value cross-test figure (see figure 2 ). coefficient of determination (R 2 ) reached 94.86, and the cross-validation mean square error (RMSECV) was 0.301.

[0042] 2.2 Moisture model test

[0043] The established model was used to predict the water content of the honey sample. The predicted results and the national standard method and their deviations are shown in Table 1. The root mean square error of prediction (RMSEP) was 0.324. Thro...

Embodiment 3

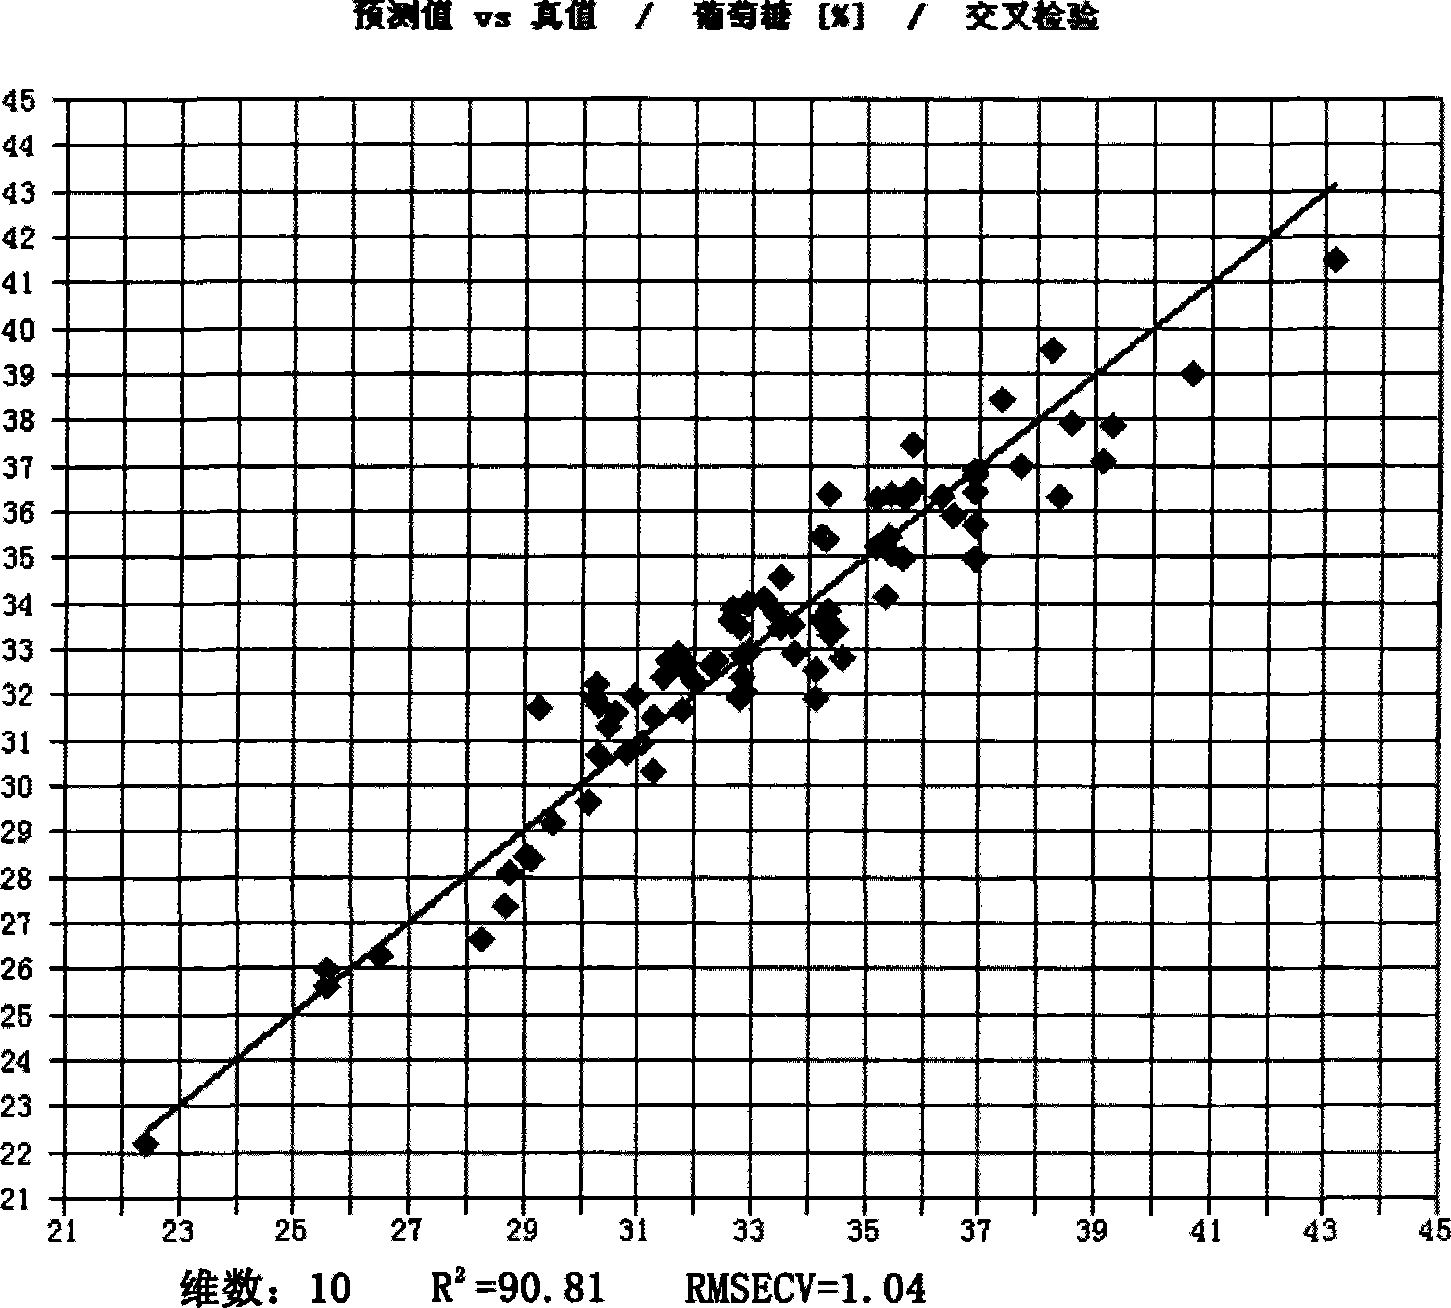
[0047] Example 3 Honey Glucose Model

[0048] 3.1 Glucose model establishment

[0049] According to the GB 18796-2005 honey standard, the glucose content of the honey sample of Example 1 was measured by liquid chromatography, and the OPUS5.5 software was used to subtract a straight line spectrum pretreatment from the sample spectrum collected in Example 1, using partial least squares Multiplication establishes a mathematical model, cross-validates the model, and obtains a glucose NIR prediction value and a true value cross-validation figure (see image 3 ). coefficient of determination (R 2 ) reached 90.81, and the cross-validation mean square error (RMSECV) was 1.04.

[0050] 3.2 Glucose model test

[0051] The established model was used to predict the glucose of honey samples. The prediction results and the national standard method measurement results and their deviations are shown in Table 2. The root mean square error of prediction (RMSEP) was 1.09. The paired T test s...


PUM


Abstract

The invention relates to a rapid and convenient method for testing the quality of honey and the application thereof. The main steps are as follows: (1) a honey sample is collected; (2) the contents of water, glucose and fructose and the amylase value of the honey sample are obtained by a routine chemical method; (3) a near infrared spectrum of the honey sample is collected; (4) the preprocess of the near infrared spectrum is carried out, the interference factors are eliminated and the wavelength range is selected; (5) calibration models among the contents of water, glucose and fructose, the amylase value and the near infrared spectrum of the honey sample are respectively built and tested; (6) the near infrared spectrum of the sample to be tested is collected; (7) the contents of water, glucose and fructose and the amylase value of the sample to be tested are predicted by using the built models. The invention has the advantages of simple pretreatment, rapid analyzing speed, environmental protection, etc. Moreover, the contents of water, glucose and fructose and amylase value in the honey can be predicted with reliable and ideal result.

Description

technical field [0001] The invention relates to a spectroscopic method for quantifying the quality of honey, in particular to a near-infrared spectroscopic method for rapidly quantifying the quality of honey. Background technique [0002] Honey is a natural sweet substance that bees collect the nectar of surrounding nectar source plants and store in the hive, combine with their own special substances, and digest. Honey is mainly composed of carbohydrates (about 3 / 4 of the total) and water (about 1 / 4 of the total), and also contains a small amount of organic acids, vitamins, amino acids, etc. Sugars, especially monosaccharides (glucose and fructose) account for 85% to 90% of carbohydrates, forming a saturated solution with high sugar content. Moisture, glucose, fructose, and amylase (DN) are important physical and chemical indicators to evaluate the quality of honey, and determine the sensory characteristics and chemical properties of honey. For example, the water content i...

Claims


Application Information

Patent Timeline
IPC IPC(8): G01N21/35G01N21/3577G01N21/359
Inventor 陈兰珍赵静薛晓锋陈芳
Owner BEE RES INST CHINESE ACAD OF AGRI SCI
Why Eureka
Try Eureka