Supercharge Your Innovation With Domain-Expert AI Agents!

A 3D Spectral Data Correction Method

A spectral data and correction method technology, applied in the direction of fluorescence/phosphorescence, material excitation analysis, etc., can solve the problems that the component decomposition effect is greatly affected by the number of components, the quantitative analysis of the analysis results is affected, the output spectrum deviates from the actual spectrum, etc., to achieve calculation Fast speed, easy operation, and accurate calibration results

Inactive Publication Date: 2014-10-22
CHINESE RES ACAD OF ENVIRONMENTAL SCI
View PDF8 Cites 0 Cited by
  • Summary
  • Abstract
  • Description
  • Claims
  • Application Information

AI Technical Summary

Problems solved by technology

Among them, the intensity of Rayleigh scattering is higher than that of Raman scattering, and the Raman scattering region is not fixed. When the excitation wavelength is high, the peak of the substance is attached to the Raman scattering peak. Although, it can be achieved by setting a small excitation wavelength. Reduce the influence of Raman scattering, but usually it is necessary to study a larger range of excitation spectra, therefore, it is still necessary to remove Raman scattering by other methods, otherwise it will affect the analysis results, especially the quantitative analysis
[0003] The traditional method to reduce the influence of scattering is mainly to reduce the concentration of the mixture and subtract the blank sample, but the effect of this method is not ideal
At present, the mathematical models for three-dimensional spectral correction mainly include the parallel factor analysis model (PARAFAC) (see the paper Andersen CM, Bro R. Practical aspects of PARAFAC modeling of fluorescence excitation-emission data. J Chemometrics, 2003, 17: 200-215. and Paper Bahram, M., Bro, R., Stedmon, C., Afkhami, A., 2007. Handling of Rayleigh and Ramanscatter for PARAFAC modeling of fluorescence data using interpolation. J. Chemometr. 20, 99-105.) and three Linear model (TDM) (see paper A L.Xia, H.L.Wu, R.Q.Yu, et al. Alternating penalty trilinear decomposition algorithm for second-order calibration with application to interference-free analysis of excitation-emission matrix fluorescence data[J]. and Paper J.Chemom., 2005, 19:65-76.H L Wu, M Shibukawa, K Oguma.An alternating trilinear decomposition algorithm with application to calibration of HPLC-DAD for simultaneous determination of overlapped chlorinated aromatic hydrocarbons.[J]J. Chemom., 2004, 76: 1-26.), these models can be called second-order correction models, which have the disadvantages of slow convergence, and the decomposition effect of components is greatly affected by the number of components, and the randomness of component settings may cause The output spectrum deviates from the actual spectrum, therefore, it is necessary to propose a three-dimensional spectral correction method that does not destroy the characteristics of the sample itself

Method used


Image

  • A 3D Spectral Data Correction Method
  • A 3D Spectral Data Correction Method
  • A 3D Spectral Data Correction Method

Examples


Embodiment Construction

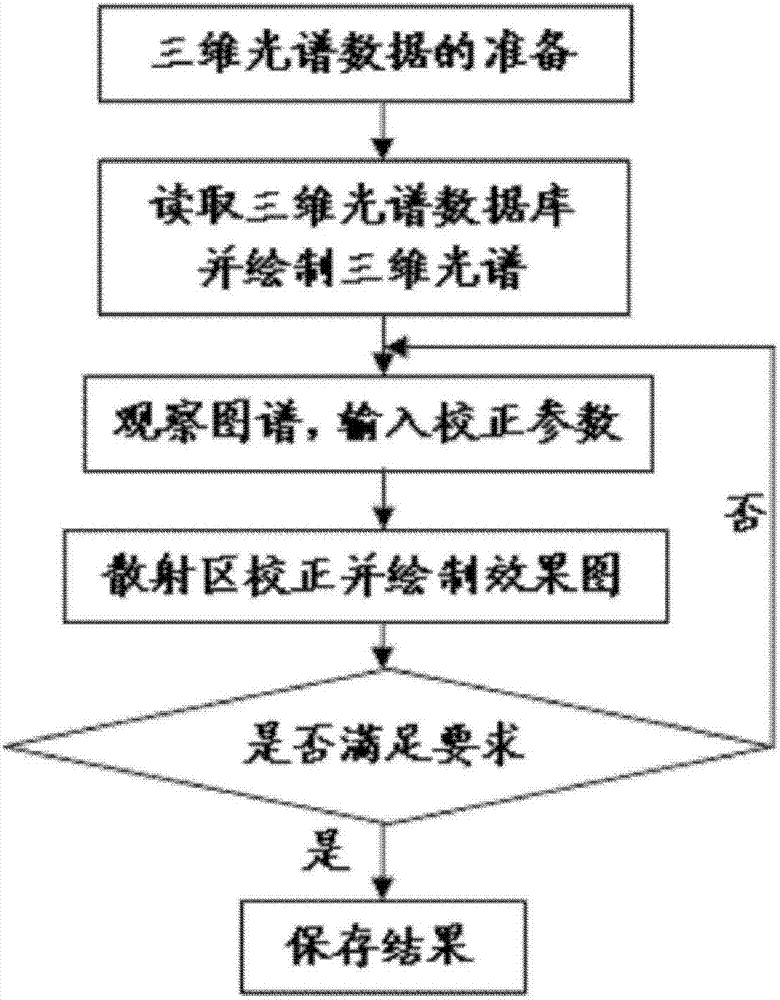
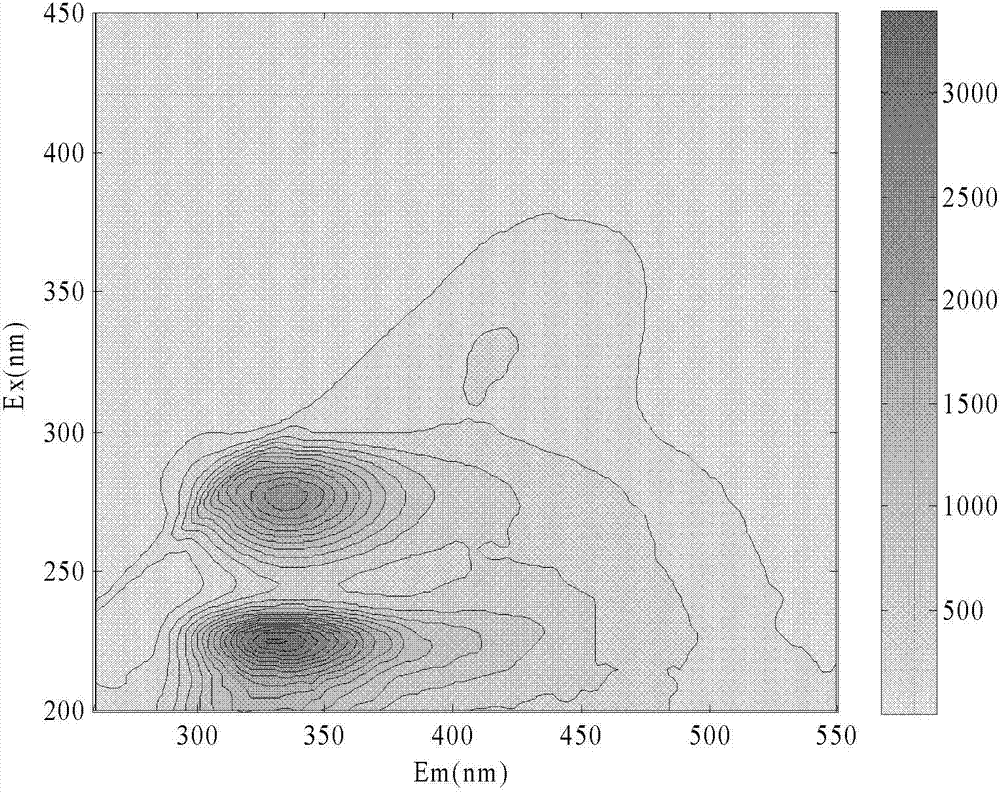
[0020] The new fast correction method for three-dimensional spectral data of the present invention adopts a three-dimensional spectral correction method based on an 8-parameter method. Its main steps are as follows:

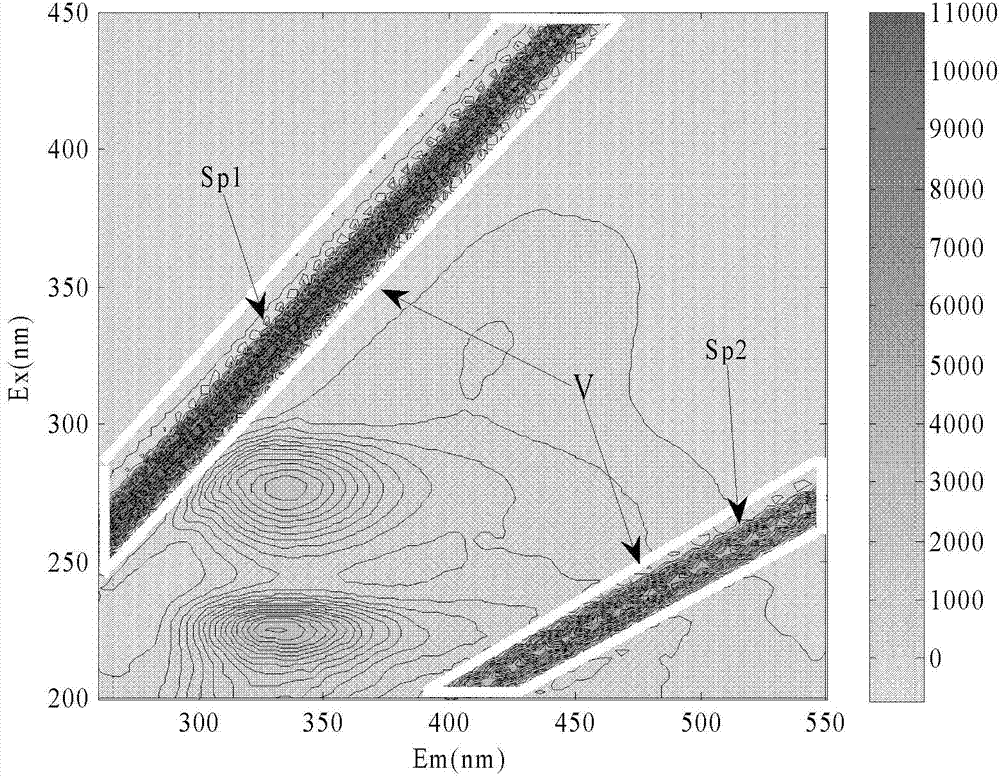
[0021] Step 1: Read the data with a computer. The computer reads the three-dimensional spectral data in the MATLAB R2009a environment. The data comes from the fluorescence spectrophotometer or the collected three-dimensional excitation / emission (EX / EM) spectrum or converts the two-dimensional excitation (EX) spectrum into EX / EM spectrum ( Conversion method: Arrange the EX spectra from small to large in rows, the first column is the excitation wavelength, and the first row is the emission wavelength), to obtain the (EX / EM) spectrum matrix F of the original data, set the excitation light band of the original EX / EM spectrum There are n, F=(f 1 , f 2 ,..., f n ), f jis the spectral column vector of the jth excitation band, assuming that there are m emission band...


PUM


Abstract

The invention relates to a three-dimensional spectroscopic data correction method. The three-dimensional spectroscopic data correction method mainly comprises the following steps of: step 1, reading data by a computer, wherein the data is derived from a three-dimensional excitation / emitting spectrum chart collected by a fluorescence spectrophotometer, or converting a dimensional excitation spectrum into a three-dimensional excitation / emitting spectrum, and obtaining a three-dimensional excitation / emitting spectrum matrix of original data; step 2, correcting the three-dimensional excitation / emitting spectrum by an eight-parameter method: determining borders of scattering regions by eight parameters, then searching effective points, finally carrying out interpolation, and replacing the data of the scattering regions by point sets obtained by the interpolation; and step 3, outputting a result. According to the three-dimensional spectroscopic data correction method, the flexible parameter input manner is adopted aiming at a STOCKS shift (Stokes shift) problem, different scattering regions can be processed; and the method is fast, accurate, convenient and efficient, and is suitable for correction of Rayleigh scattering and Raman scattering of EX / EM (excitation wavelength / emission wavelength).

Description

technical field [0001] The invention relates to a new fast correction method for three-dimensional spectral data, which can quickly correct and process three-dimensional spectral scattering. Background technique [0002] Spectral analysis is currently an important research method in the field of analytical chemistry. It is used in the study of compost decomposing characteristics, the evolution of water-soluble organic matter in water, the migration and transformation of leachate pollutants in municipal solid waste landfills, and hazardous waste treatment and disposal sites. It has been widely used in the research of security characteristics analysis and other fields. Spectroscopy, especially three-dimensional spectroscopy, has relatively rich information, and can measure substance concentration, substance composition and molecular structure characteristics according to light intensity. However, when the incident light interacts with the electrons in the molecule, energy cha...

Claims


Application Information

Patent Timeline
IPC IPC(8): G01N21/64
Inventor 席北斗何小松潘红卫许其功魏自民
Owner CHINESE RES ACAD OF ENVIRONMENTAL SCI
Features
  • R&D
  • Intellectual Property
  • Life Sciences
  • Materials
  • Tech Scout
  • Unparalleled Data Quality
  • Higher Quality Content
  • 60% Fewer Hallucinations
Learn More