Quantitative detection method of polyphosphate in a kind of microbial cell
A quantitative detection method, polyphosphate technology, applied in the biological field, can solve problems such as incomprehension, and achieve the effect of small sample demand, sample pretreatment and simple reaction process
- Summary
- Abstract
- Description
- Claims
- Application Information
AI Technical Summary
Problems solved by technology
Method used
Image
Examples
Embodiment 1
[0070] Example 1 Construction of poly P standard curve and detection of poly P concentration in samples
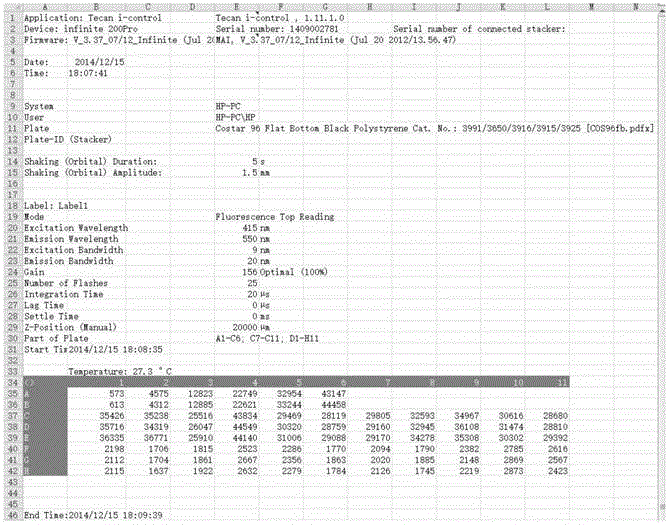
[0071] Take a sampling in a daily experiment as an example, such as figure 1 As shown, it contains all the parameters of DAPI-poly P complex detection, data A1-B6 is the original data of this test bracket construction, data C1-H11 is the original data of this test sample and its control, all data The units are relative fluorescence values (Relative fluorescence unit, Rfu).
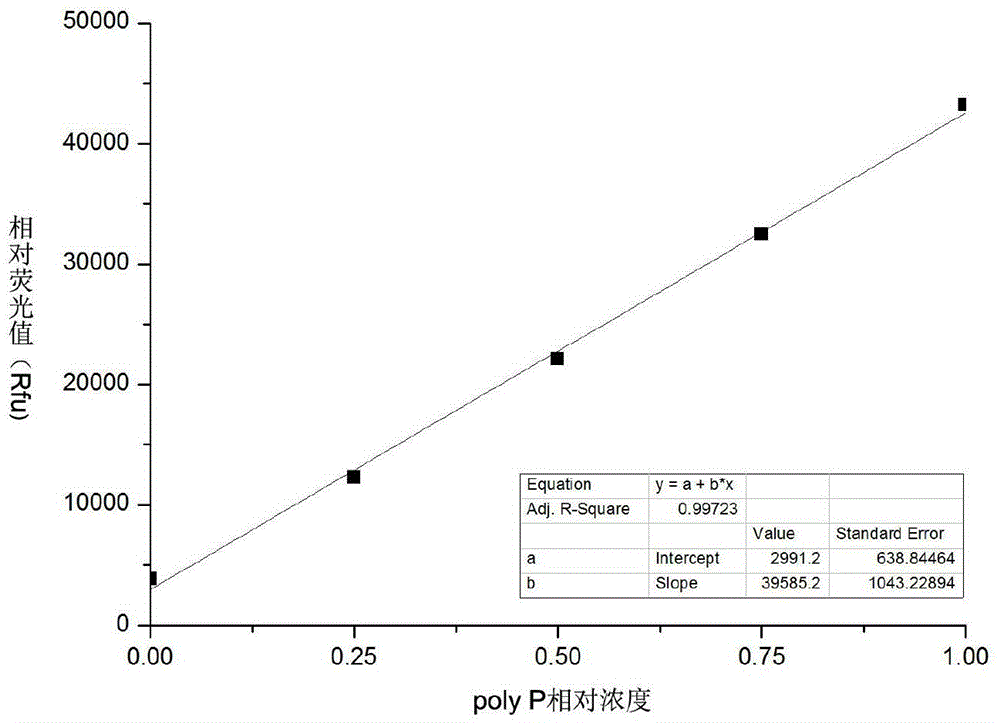
[0072] In view of the fact that 1U=3 μM orthophosphate, for the convenience of graphical description, we refer to the different concentration gradients of the standard as the relative concentration of poly P (Relative Concentration). After processing the raw data of A1-B6 standard products, the data listed in Table 3 can be obtained. For example, the data corresponding to the first column "0U" is the average value of A2B2 minus the average value of A1B1, and so on.
[0073] Table 3 Rfu correspondin...
Embodiment 2
[0079] The construction of embodiment 2 BSA standard curve and the detection of sample protein concentration
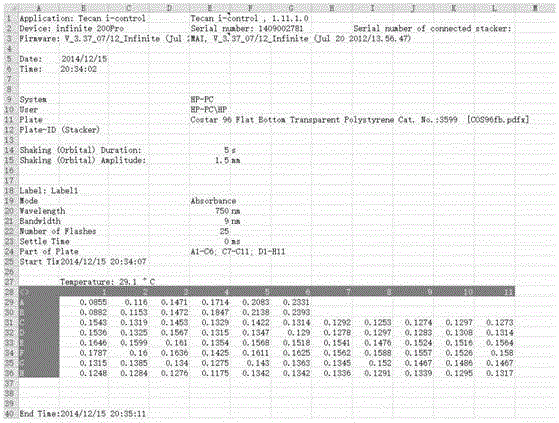
[0080] After obtaining the sample Y P After the value, you also need to get the corresponding Y A value. Such as image 3 As shown, it contains all the parameters of protein concentration detection, data A1-B6 is the original data of this detection standard curve construction, data C1-H11 is the original data of this detection sample (wherein G1-H11 is the sample S1-S11 The corresponding data, the rest of the data is the data of other samples of the same batch), and the unit of all data is the absorbance of the sample at 750nm.
[0081] After processing the raw data of A1-B6 standard products, the data in Table 5 can be obtained. For example, the data corresponding to "0.2" in the first column is the average value of A2B2 minus the average value of A1B1, and so on.
[0082] Table 5 Absorbance at 750nm of different concentrations of BSA standard
[0083]
[008...
Embodiment 3
[0088] Example 3 The final quantification of microbial intracellular poly P
[0089] After getting all samples of Y P and Y A After the value, according to the final quantitative formula of poly P: T PP =30.9738Y P / Y A The intracellular poly P content of each microbial sample can be calculated, and the detailed data are shown in Table 7.
[0090] Table 7 Polyp content in samples S1-S11
[0091]
PUM
 Abstract
Description
Claims
Application Information
 - R&D
- Intellectual Property
- Life Sciences
- Materials
- Tech Scout
- Unparalleled Data Quality
- Higher Quality Content
- 60% Fewer Hallucinations
Browse by: Latest US Patents, China's latest patents, Technical Efficacy Thesaurus, Application Domain, Technology Topic, Popular Technical Reports.
© 2025 PatSnap. All rights reserved.Legal|Privacy policy|Modern Slavery Act Transparency Statement|Sitemap|About US| Contact US: help@patsnap.com


