Fluorescence imaging analysis system and fluorescence imaging analysis method thereof

A fluorescence imaging and analysis system technology, applied in the field of biology, can solve problems such as high requirements for instrument use and maintenance, complex structure of detection instruments, and restrictions on the application of fluorescent dyes, and achieve the best detection effect, exquisite structure design, and low energy consumption. Effect

Inactive Publication Date: 2015-07-08
SHANGHAI CENT FOR BIOINFORMATION TECH
View PDF4 Cites 4 Cited by
  • Summary
  • Abstract
  • Description
  • Claims
  • Application Information

AI Technical Summary

Problems solved by technology

However, most of the existing fluorescent dye detection devices tend to have high sensitivity, high precision, and high automation, resulting in complex structure and high cost of dete

Method used


Image

  • Fluorescence imaging analysis system and fluorescence imaging analysis method thereof
  • Fluorescence imaging analysis system and fluorescence imaging analysis method thereof
  • Fluorescence imaging analysis system and fluorescence imaging analysis method thereof

Examples


Embodiment 1

[0081] 1. Construction and cultivation of Escherichia coli carrying a fluorescent protein expression vector, the name of the fluorescent protein is GFP (green fluorescent protein), and 395nm and 475nm are the maximum and second maximum excitation wavelengths respectively.

[0082] 2. Quantitative determination of excitation light:

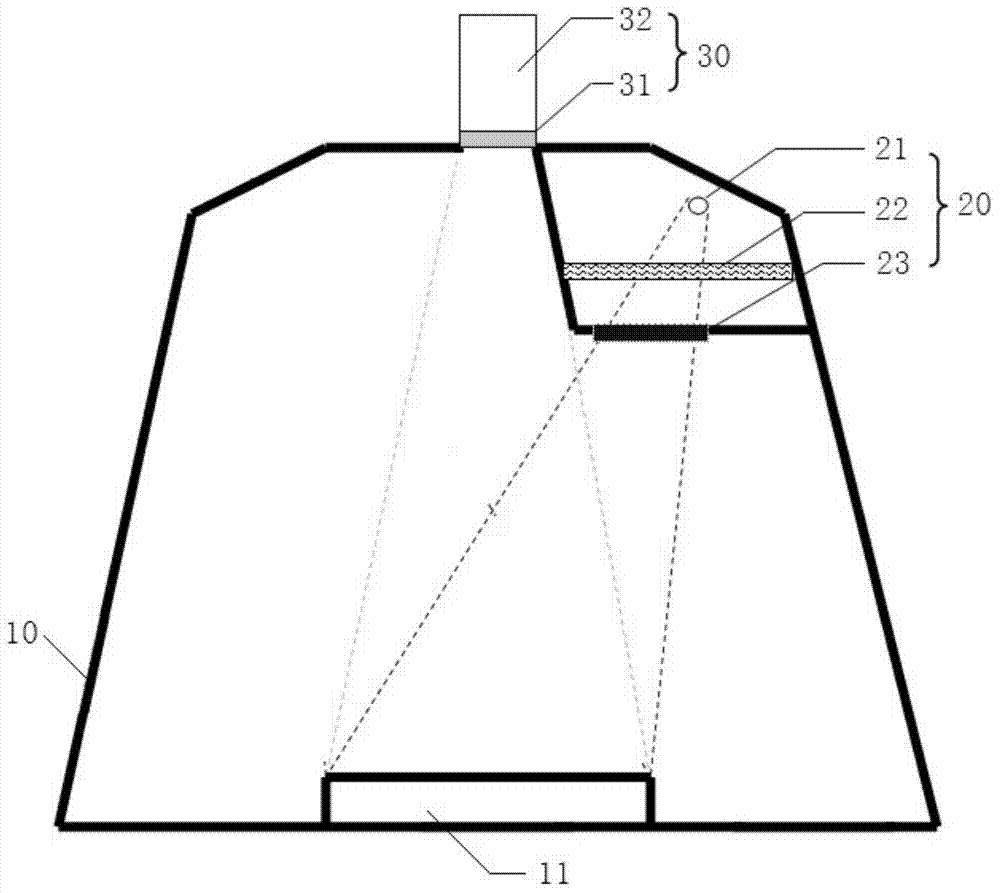
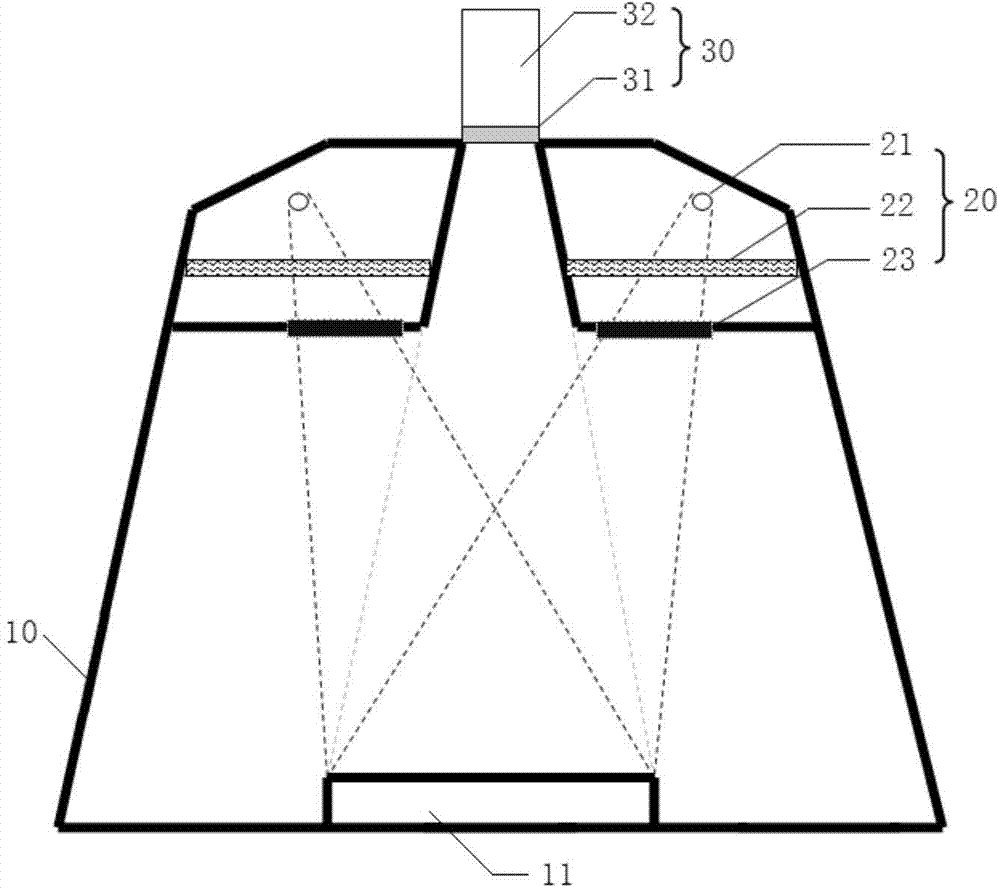
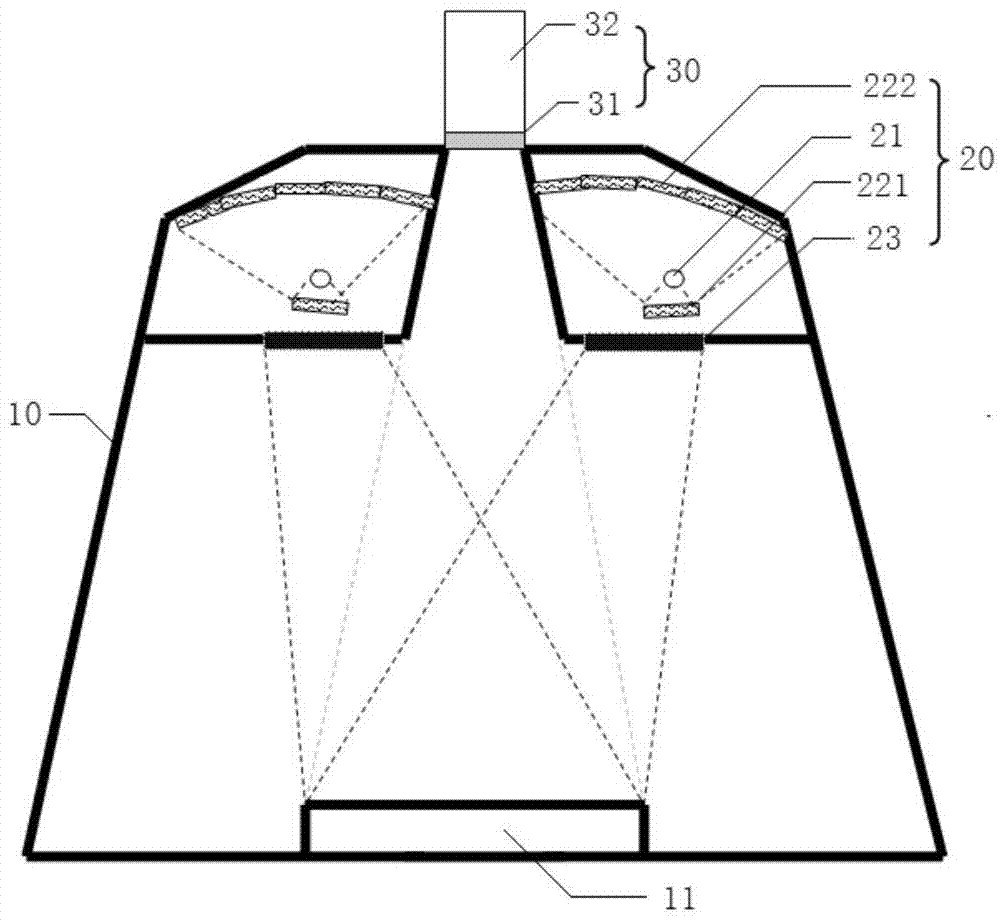
[0083] Step 1: Place a series of Escherichia coli carrying fluorescent protein expression vectors with known concentrations and serial dilutions on the sample stage in sequence, and detect one sample at a time. The detected object carries fluorescent substances, and the sample stage is placed inside the shell;

[0084] Step 2: The excitation light source 21 is a blue LED light; the excitation filter 23 is a ZB1 model, and its transmission spectrum range is 300-500nm; the filter lens 31 is a JB510 model, and its transmission spectrum range is 510nm±10nm~2500nm . Select and determine the excitation light source, excitation filter and filter lens ac...

Embodiment 2

[0093] In this embodiment, the imaging unit 32 and the imaging analysis unit 33 are utilized. The camera unit 32 adopts a digital camera, and uses the camera analysis unit 33 connected with the digital camera to perform real-time measurement and analysis. The purpose of this embodiment is to determine the relationship between the concentration of green fluorescent protein and the reading in a relatively large concentration range. The measurement conditions of the present embodiment, the shooting conditions of the digital camera (comprising aperture and exposure time), the green fluorescent protein species and the corresponding optical filters thereof are all the same as in Example 1, wherein the linear regression equation used to measure the actual concentration is determined by the above Embodiment 1 records, and linear regression equation is: y=0.0532x+16.628, R 2 = 0.9803. If the linear regression equation is unknown, repeat steps 2-4 to draw a standard curve to obtain th...

Embodiment 3

[0102] In this embodiment, the camera unit 32 and the highly integrated camera analysis unit 33 are used to capture the fluorescence and measure and analyze the concentration of the fluorescent dye / fluorescent protein. The camera unit 32 and the camera analysis unit 33 are integrated, which replaces the conventional working method of combining a digital camera and a computer. The integrated camera unit 32 and camera analysis unit 33 greatly reduce the volume and weight of the system of the present invention, reduce its production cost while satisfying its performance, and are easy to use.

[0103] In this example, SYBR Green I combined with DNA to emit fluorescence was used for analysis, and the eppendorf tube containing SYBR Green I+DNA solution was placed in the fluorescence imaging analysis system of the present invention. Wherein, the excitation light source 21 is a blue LED lamp; the excitation filter 23 is a ZB1 model, and its light transmission spectrum range is 300-500...


PUM


Abstract

The invention discloses a fluorescence imaging analysis system and a fluorescence imaging analysis method. The fluorescence imaging analysis system comprises a shell, and at least one excitation device and an imaging device, which are arranged inside the shell; the excitation device comprises an excitation light source and an excitation filter; light rays emitted by the excitation light source pass through the excitation filter to form monochromatic excitation light and the monochromatic excitation light is irradiated to a sample stage, and a detected substance emits fluorescent light after being excited; and the imaging device is used for capturing fluorescent light passing through a piece of filter glass and analyzing and determining the concentration of the fluorescent substance. Compared with the prior art, the system can acquire the reliable detection result without arranging an expensive optical grating, an interference color filter and a photomultiplier and determining an electronic circuit, the structure is skillful and simple, the preparation cost is low and the system and the method can be widely applied.

Description

technical field [0001] The invention belongs to the field of biology, and in particular relates to a fluorescence imaging analysis system and a fluorescence imaging analysis method thereof. Background technique [0002] Fluorescent dyes generally refer to substances that absorb light waves of a certain wavelength and emit light waves of another wavelength greater than the absorbed light. Due to high sensitivity and convenient operation, fluorescent dyes have gradually replaced radioactive isotopes as scientific research detection labels, and are widely used in fluorescent immunology, fluorescent probes, and cell staining. Including specific DNA staining, used for chromosome analysis, cell cycle, apoptosis and other related research. In addition, many nucleic acid dyes are very useful counterstains in multicolor staining systems, which can be used as background controls to mark cell nuclei so that the spatial relationship of intracellular structures can be seen at a glance. ...

Claims


Application Information

Patent Timeline
IPC IPC(8): G01N21/64
Inventor 陆长德刘伟李园园韦朝春安发志李雪玲
Owner SHANGHAI CENT FOR BIOINFORMATION TECH
Why Eureka
Try Eureka