

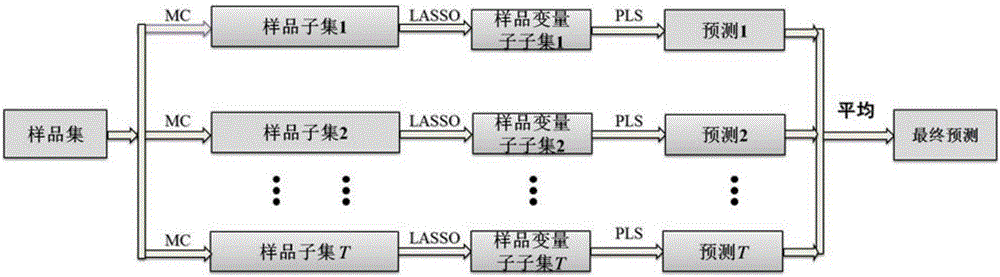
Double-integration partial least square modeling method based on Monte Carlo and LASSO
A technique of least squares and modeling methods, applied in the field of analytical chemistry, can solve the problem of low accuracy of modeling and prediction, and achieve the effect of improving prediction ability and prediction accuracy
- Summary
- Abstract
- Description
- Claims
- Application Information
AI Technical Summary
Problems solved by technology
Method used
Image

Examples
Embodiment 1
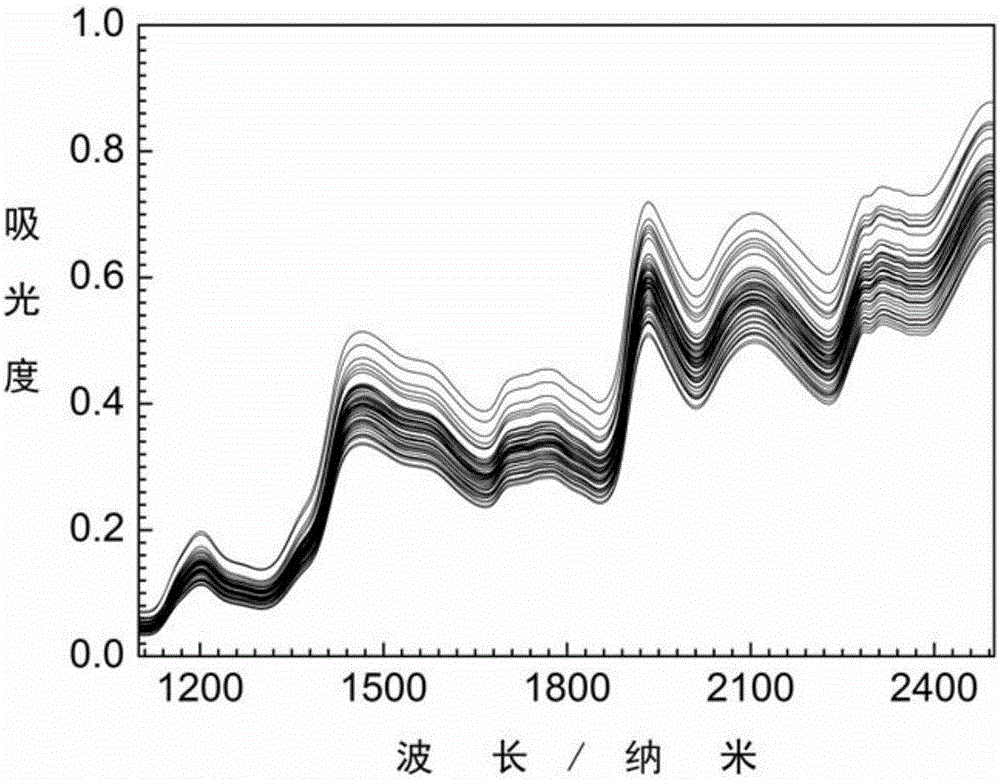
[0041] This embodiment is applied to the analysis of near-infrared spectroscopy data to determine the oil content in corn samples. The specific steps are as follows:
[0042] 1) Collect 80 corn samples, use three different near-infrared spectrometers (M5, MP5, MP6) to measure the near-infrared spectrum data of corn, and take the oil content as the target value. The wavelength range of near-infrared spectrum is 2498~1100nm (4003~9091cm -1 ), the sampling interval is 2nm, and there are 700 wavelength data points in total. The data was downloaded from http: / / software.eigenvector.com / Data / Corn / index.html. Using the KS grouping method, 53 samples are used as the training set, and the remaining 27 samples are used as the prediction set. The near-infrared spectra of the training set of the data are as follows figure 2 shown.
[0043] 2) Determine the factor number LV of the PLS model
[0044] Calculate the cross-validation root mean square error (RMSECV) under different number...
Embodiment 2
[0055] This embodiment is applied to the analysis of ultraviolet spectrum data to determine the content of single-ring aromatics in gasoline samples. The specific steps are as follows:
[0056] 1) Collect 115 light gasoline and diesel fuel samples, the ultraviolet spectrum wavelength range is 200-400nm, the sampling interval is about 0.35nm, a total of 572 wavelength data points. The content of single-ring aromatics was determined by HP model G1205A supercritical fluid chromatography instrument (Hewlett-Packard, Palo Alto, Calif). The data is downloaded from http: / / myweb.dal.ca / pdwentze / downloads.html. The training set and prediction set are divided according to the instructions on the Internet, the first 70 samples are used as the training set, and the last 44 samples are used as the prediction set. The training set UV spectrum of this data is as follows Figure 6 shown.
[0057] 2) Determine the factor number LV of the PLS model
[0058] Calculate the cross-validation r...
Embodiment 3
[0069] This embodiment is applied to near-infrared spectrum data analysis to measure the content of sesame oil in the quaternary blend oil sample. The specific steps are as follows:
[0070] 1) Collect 51 samples of quaternary blend oil containing sesame oil, corn oil, soybean oil and rice oil. Use Vertex70 multi-band infrared / near-infrared spectrometer (Bruker, Germany) for near-infrared spectral data measurement, with a wavenumber range of 4000-12000cm -1 , the sampling interval is 1.93cm -1 , a total of 4148 data points. The sesame oil content was taken as the target value. Using the KS grouping method, 34 samples are used as the training set, and the remaining 17 samples are used as the prediction set. The near-infrared spectra of the training set of the data are as follows Figure 10 shown.
[0071] 2) Determine the factor number LV of the PLS model
[0072] Calculate the cross-validation root mean square error (RMSECV) under different numbers of factors, and the n...
PUM
 Abstract
Description
Claims
Application Information