Real-time quantitative LAMP (Loop-Mediated Isothermal Amplification) primer, kit and method for detecting erysipelothrix rhuriopathiae
A real-time quantitative technology for Erysipelas suis, applied in the field of microbial detection, can solve the problems of high cost, laboratory pollution, complex equipment and other problems, and achieve the effect of simple result judgment method
- Summary
- Abstract
- Description
- Claims
- Application Information
AI Technical Summary
Problems solved by technology
Method used
Image
Examples
Embodiment 1
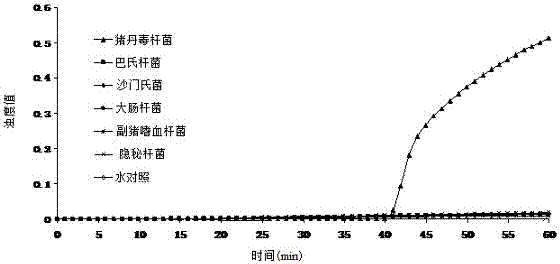
[0067] Example 1 Specific results of LAMP detection method
[0068] LAMP amplification of 1 strain of Erysipelas suis, 5 strains of negative control bacteria and water control, the results are as follows figure 1 As shown, the Erysipelas suis reaction tube showed a turbidity rising curve in about 40 minutes, which was a positive result. The 5 strains of negative control bacteria reaction tube and the water control reaction tube curve showed no amplification, which was a negative result.
Embodiment 2
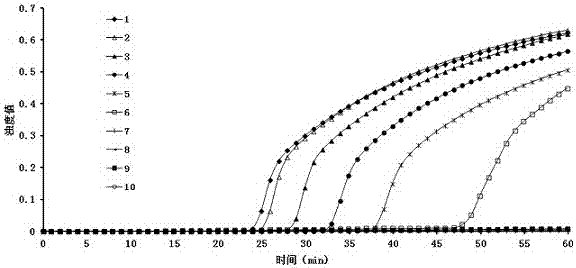
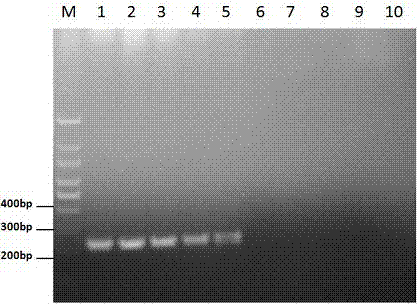
[0069] Example 2 Sensitivity results of LAMP detection method
[0070] The initial concentration of Erysipelas DNA is 1.68×10 2 ng / μL, LAMP and PCR amplification after 10-fold dilution, the results are as follows figure 2 with image 3 As shown, the result shows that the detection limit of the LAMP method is about 1.68×10 -3 ng / μL, and the detection limit of PCR method is 1.68×10 -2 ng / μL.
Embodiment 3
[0071] Example 3 Drawing of the quantitative standard curve of Erysipelas suis
[0072] Determination of recombinant plasmid pMD18-T- Spa As a standard sample, use RNA-Free Water to carry out a 10-fold dilution of 8 dilutions, and take 2 μL of each dilution as a template for LAMP amplification.
[0073] Set the control: the concentration is 1.68×10 1 ng / μL, 1.68×10 0 ng / μL, 1.68×10 -1 ng / μL, 1.68×10 -2 ng / μL, 1.68×10 -3 ng / μL recombinant plasmid pMD18-T- Spa There is one standard sample, because the negative logarithm of the standard sample concentration has a linear relationship with the time value of the amplified turbidity value of 0.1, so the negative logarithm of the sample concentration and the time value captured by the turbidimeter can be combined (see Table 1) Make a standard curve and obtain the standard curve equation, y = 0.1766x-5.3619, such as Figure 4 As shown, the correlation coefficient R 2 = 0.9961, showing a good linear relationship. Taking time as the X valu...
PUM
 Abstract
Description
Claims
Application Information
 - R&D
- Intellectual Property
- Life Sciences
- Materials
- Tech Scout
- Unparalleled Data Quality
- Higher Quality Content
- 60% Fewer Hallucinations
Browse by: Latest US Patents, China's latest patents, Technical Efficacy Thesaurus, Application Domain, Technology Topic, Popular Technical Reports.
© 2025 PatSnap. All rights reserved.Legal|Privacy policy|Modern Slavery Act Transparency Statement|Sitemap|About US| Contact US: help@patsnap.com


