A method for quantitative analysis of sulfur and phosphorus in iron and steel
A quantitative analysis and steel technology, applied in the field of spectral quantitative analysis, can solve the problems of long measurement cycle, inability to control the production process, instability, etc., to save sample processing time, improve production line capacity, and reduce volatility.
- Summary
- Abstract
- Description
- Claims
- Application Information
AI Technical Summary
Problems solved by technology
Method used
Image
Examples
Embodiment 1
[0031] In the laser-induced breakdown system of this embodiment, the excitation source is Nd:YAG solid-state laser (wavelength is 1064nm, pulse width is 10ns, laser energy is adjustable from 4 to 80mJ, and laser emission frequency is 5Hz), and the laser pulse is focused on Plasma is excited on the surface of the sample, and the spectral signal is transmitted to the echelle spectrometer (the wavelength range is 200-800nm, and the resolution is about 0.1nm). During the experiment, in order to obtain the spectrum with good signal-to-noise ratio, each spectrum is obtained by 20 signal accumulations.
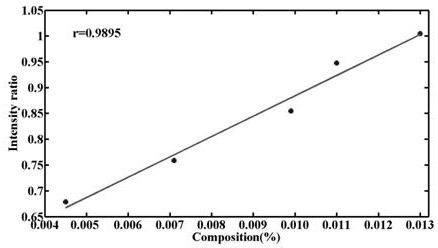
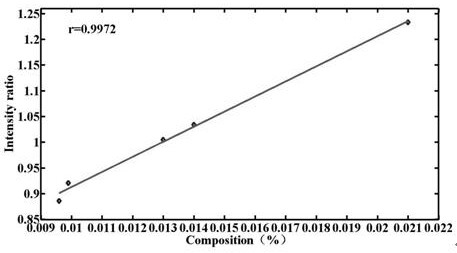
[0032] The present invention combines laser-induced breakdown spectroscopy and an internal standard method for quantitative analysis of sulfur and phosphorus in iron and steel, specifically comprising the following steps:
[0033] 1. Sample preparation: Make the sample to be tested and the standard-building sample with known component content into a cylinder of Φ20×6mm; there are 5 s...
Embodiment 2
[0045] The present invention combines laser-induced breakdown spectroscopy and internal standard method for quantitative analysis of sulfur and phosphorus in steel:
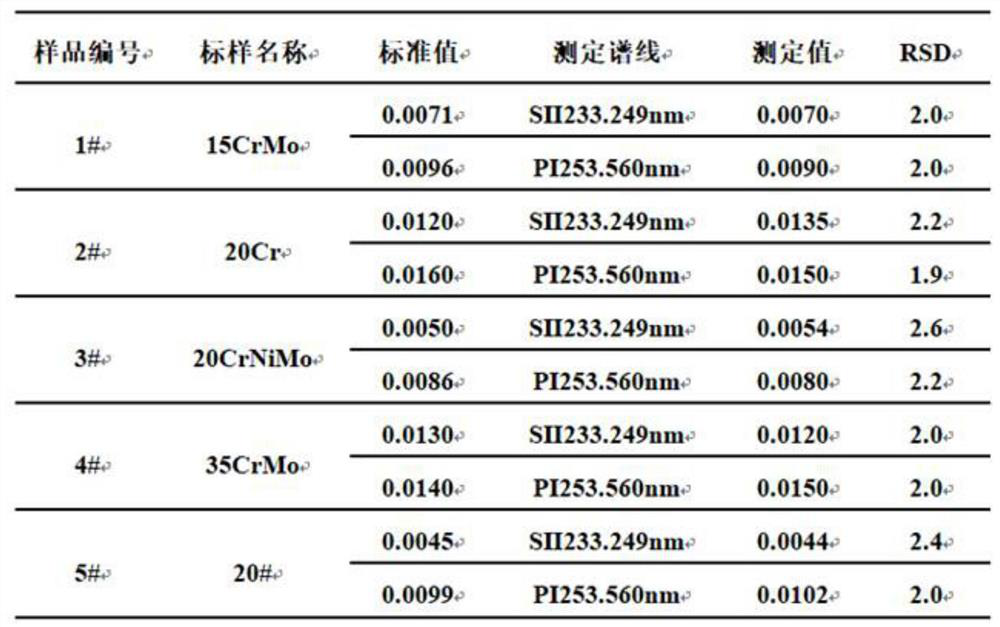
[0046] The samples to be tested are chromium steels 20Cr, 20CrMo and 20CrNiMo purchased in the market, and the samples to be tested are made into cylinders with a diameter of 20×6mm.
[0047] Using the test method and test conditions of Example 1, the laser-induced breakdown spectrum signal collection is carried out on the 3 samples to be tested, and the standard curve of SII 233.249nm and the standard curve of PI 253.560nm established in Example 1 are used to analyze and obtain the samples to be tested. The quantitative analysis results of S and P elements in the samples are as follows.
[0048]
Embodiment 3
[0054] In this example, the standard curve of SII 233.249nm and the standard curve of PI 253.560nm established in the first implementation are used, and the laser-induced breakdown system and the computer system for establishing the standard curve are set up on the production site. The steel samples on the production line can be processed without pretreatment. Detection is performed directly, thereby enabling in-situ, on-line sulfur and phosphorus quantification of steel samples.
PUM
| Property | Measurement | Unit |
|---|---|---|
| wavelength | aaaaa | aaaaa |
Abstract
Description
Claims
Application Information
 - R&D
- Intellectual Property
- Life Sciences
- Materials
- Tech Scout
- Unparalleled Data Quality
- Higher Quality Content
- 60% Fewer Hallucinations
Browse by: Latest US Patents, China's latest patents, Technical Efficacy Thesaurus, Application Domain, Technology Topic, Popular Technical Reports.
© 2025 PatSnap. All rights reserved.Legal|Privacy policy|Modern Slavery Act Transparency Statement|Sitemap|About US| Contact US: help@patsnap.com


