Separation membrane diagnosis method, water processing method, separation membrane diagnosis device, water processing device and separation membrane diagnosis program
A diagnostic method and diagnostic program technology, applied in the field of separation membrane diagnosis, can solve the problems of reduced water treatment operation rate, increased labor costs, chemical costs, etc., and achieve the effect of reducing water treatment costs
- Summary
- Abstract
- Description
- Claims
- Application Information
AI Technical Summary
Problems solved by technology
Method used
Image
Examples
Embodiment approach
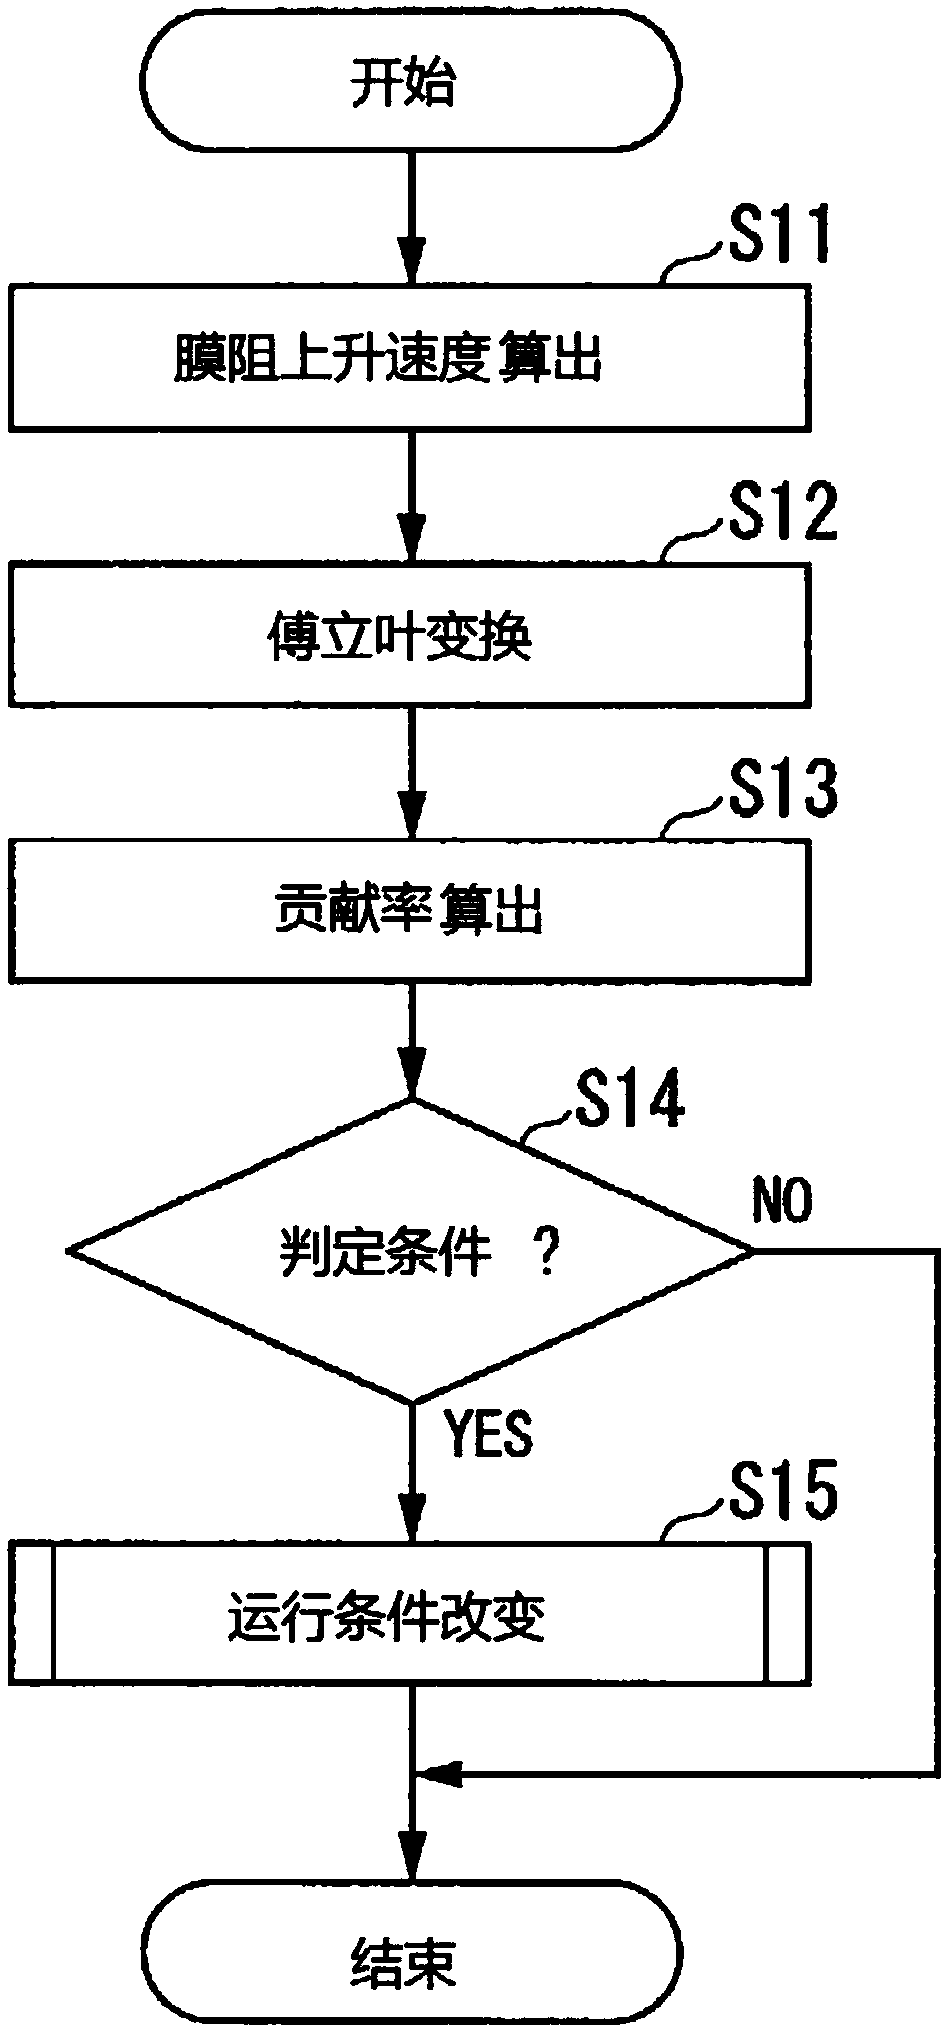
[0170] According to at least one embodiment described above, the separation membrane diagnosis method includes the acquisition step, the time-lapse recording step, the vibration analysis step, and the determination step, so as to accurately grasp the state of the separation membrane used for water treatment, thereby providing a A separation membrane diagnosis method for reducing water treatment costs, a water treatment method, a separation membrane diagnosis device, a water treatment device and a separation membrane diagnosis program, or a storage medium recording the program.
[0171]In addition, the above-mentioned device may also be realized by a computer. At this time, a program for realizing the function of each functional block is recorded on a computer-readable recording medium. It can also be realized by causing the computer system to read the program recorded on the recording medium and execute it by the CPU. The term "computer system" herein refers to a system inclu...
Embodiment 1
[0175] (Example 1) Figure 15 Indicates an example of predicting membrane fouling for MBR. Figure 15 It is a graph showing the transition of the membrane resistance R of the separation membrane 21 in the present embodiment, the band 1 contribution rate, and the band 2 contribution rate. From February 13th, the membrane resistance increased rapidly, and the operation was stopped on February 14th. A method of predicting the sharp increase using the transition of the Band 1 contribution rate will be described. In addition, here, the judgment of the sign of pollution is performed using the value of the band 1 contribution rate within 2 days. The calculation method of the band 1 contribution rate is as described above.
[0176] It can be judged that the water permeation state of the separation membrane is good if the value of the band 1 contribution rate does not remain below 60% for 2 days from the start of operation until February 9. The band 1 contribution rate continued to...
Embodiment 2
[0177] (Example 2) Figure 16 An example of predicting MBR membrane fouling in the same manner as in Example 1 is shown. Figure 16 This is an example of operation from June 1st to July 4th, and the film resistance rapid rise operation was stopped on July 4th. From June 1st to June 17th in the initial stage of operation, if the contribution rate of frequency band 1 is not continuously below 60% for 2 days, it can be judged that the water permeability of the separation membrane is good. Since June 17, the contribution rate of band 1 has continued to be 60% or less, and it can be judged that the state of the separation membrane is poor. From this, predictions of contamination can start about two weeks in advance.
PUM
 Abstract
Description
Claims
Application Information
 - R&D
- Intellectual Property
- Life Sciences
- Materials
- Tech Scout
- Unparalleled Data Quality
- Higher Quality Content
- 60% Fewer Hallucinations
Browse by: Latest US Patents, China's latest patents, Technical Efficacy Thesaurus, Application Domain, Technology Topic, Popular Technical Reports.
© 2025 PatSnap. All rights reserved.Legal|Privacy policy|Modern Slavery Act Transparency Statement|Sitemap|About US| Contact US: help@patsnap.com


