Method for measuring micro beryllium in aluminum alloy by using atomic emission spectroscopic analysis

A technology of atomic emission spectroscopy and measurement method, which is applied in the field of atomic emission spectroscopy to measure trace amounts of beryllium in aluminum alloys. It can solve problems such as the influence of third elements, many ions, and the influence of aluminum alloy structure, so as to improve the analysis sensitivity and accuracy. Effect of suppressing spectral line intensity and improving measurement accuracy

Active Publication Date: 2018-11-20
颜长明
View PDF4 Cites 0 Cited by
  • Summary
  • Abstract
  • Description
  • Claims
  • Application Information

AI Technical Summary

Problems solved by technology

[0005] Evaporation and excitation are highly sensitive in spectroscopic analysis, but when measuring trace amounts of beryllium in aluminum alloys, due to the high content of third elements (such as Mg, Zn, Cu), the atoms and ions generated when these third elements are excited, and the transition energy Large, affecting the excited state of trace elements (such as beryllium), there is a more serious influence of the third element and the influence of aluminum alloy structure
Due to the influence of the third element, special standard samples and specific spectral analysis methods need to be used for different types of aluminum alloys; due to the influence of aluminum alloy structures, standard samples and sample structures must be maintained for different types of aluminum alloys. Consistent, resulting in the inability to meet and use spectral analysis to quantitatively detect the content of trace elements in aluminum alloys
The above-mentioned limitations of spectral analysis have seriously affected the application of spectral analysis in the determination of trace elements in aluminum alloys.

Method used


Image

  • Method for measuring micro beryllium in aluminum alloy by using atomic emission spectroscopic analysis
  • Method for measuring micro beryllium in aluminum alloy by using atomic emission spectroscopic analysis
  • Method for measuring micro beryllium in aluminum alloy by using atomic emission spectroscopic analysis

Examples


Embodiment 1

[0033] instrument

[0034]The model of the spectrograph is QL-170, the photosensitive plate is Type I photosensitive plate, the light source is US-1, the total resistance of the light source is 78Ω, the spark resistance is 7.9Ω, the phaser is set to +6.6°, and the intermittent arc resistance is 23Ω. Spark current 4A, arc voltage 220V, arc current 12A, spark voltage 55V. The slit width is 20 μm, the lens is selected from three lenses, and the wavelength of the characteristic spectrum is selected from 220.0-280.0 nm.

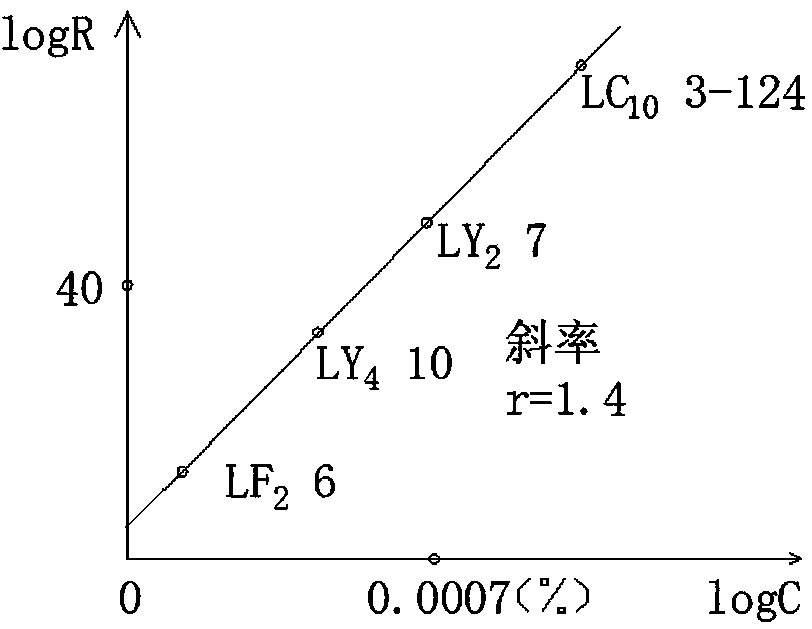
[0035] Beryllium spectral standard

[0036] LF 2 6 # , LY 2 7 # , LY 4 10 # Aluminum alloy is the procurement standard sample, among which, LF 2 6 # Anti-rust aluminum, anti-rust aluminum is Al-Mg alloy, Mg content 2.05-2.50%; LY 2 7 # It is hard aluminum, and hard aluminum is Al-Cu-Mg-Mn alloy, with Cu content of 2.70-3.10%, Mg content of 2.00-2.40%, and Mn content of 0.45-0.70%; LY 4 10 # It is hard aluminum, and hard aluminum is an Al-Cu-Mg-M...

Embodiment 2

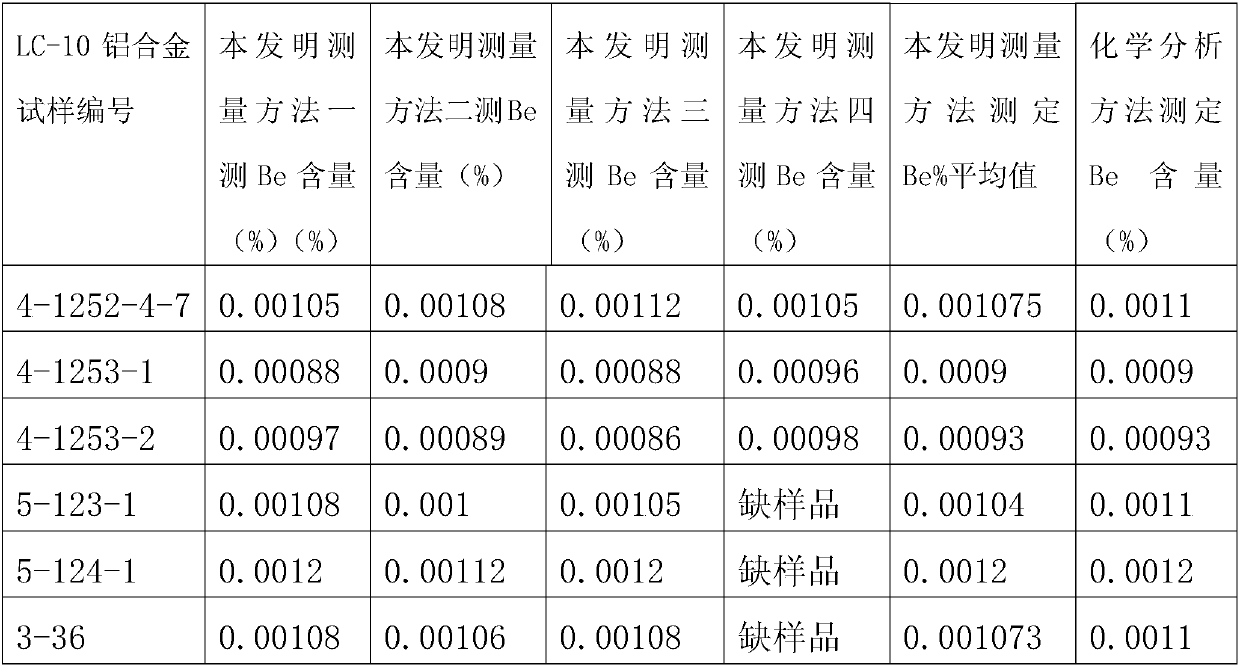
[0045] The parameters are the same as in Example 1. The upper electrode of the spectrograph is made of high-purity copper with a purity of 99.99% and processed into a flat-topped cone with a diameter of 6-8mm and a taper of 30-70°. The diameter of the discharge plane is 0.5-4.0mm. Take the LC-10 aluminum alloy sample numbered 4-1253-1 of the same specifications as the beryllium spectral standard sample as the lower electrode, and process the end face corresponding to the upper electrode into a plane by lathe. The aluminum alloy sample was clamped at the lower electrode of the spectrograph, and the spectroscopic analysis was carried out using the same spectroscopic conditions as the beryllium spectral standard sample, and the spectroscopic analysis was repeated four times.

[0046] Substituting the obtained aluminum alloy sample beryllium spectral lines into the standard curve, the calculated content of beryllium in the aluminum alloy sample is 0.00088%, 0.0009%, 0.00088%, 0.00...

Embodiment 3

[0048] The parameters are the same as in Example 1. The upper electrode of the spectrograph is made of high-purity copper with a purity of 99.99% and processed into a flat-topped cone with a diameter of 6-8mm and a taper of 30-70°. The diameter of the discharge plane is 0.5-4.0mm. Take the LC-10 aluminum alloy sample numbered 4-1253-2 of the same specifications as the beryllium spectral standard sample as the lower electrode, and process the end face corresponding to the upper electrode into a plane by lathe. The aluminum alloy sample was clamped at the lower electrode of the spectrograph, and the spectroscopic analysis was carried out using the same spectroscopic conditions as the beryllium spectral standard sample, and the spectroscopic analysis was repeated four times.

[0049] Substituting the obtained beryllium spectral lines of the aluminum alloy sample into the standard curve, the calculated content of beryllium in the aluminum alloy sample is 0.00097%, 0.00089%, 0.0008...


PUM

PropertyMeasurementUnit
Taperaaaaaaaaaa
Diameteraaaaaaaaaa
Total resistanceaaaaaaaaaa

Abstract

The invention discloses a measuring method for micro beryllium in an aluminum alloy. The method includes the following steps by adopting a spectrograph: 1) taking high purity copper or high purity carbon as a top electrode, taking a beryllium spectral standard sample / an aluminum alloy sample as a lower electrode, wherein the beryllium spectral standard sample selects three or four aluminum alloyswhose type numbers are LF2, LY2, LY4 and LC10, the top electrode is arranged to a flat top cone whose conical degree is 30-70 DEG, the top face of the flat top cone is a discharge plane whose diameteris 0.5-4.0 mm, the end face of the lower electrode opposite to the discharge plane is arranged to a plane, a polar distance is 1.7-2.5 mm, and the slit width of the spectrograph is 20-30 [mu]m, performing pre-combustion for 10-20 s and exposure for 13-16 s, developing for 4-7 min under a condition of 20+ / -1 DEG C, fixing for 6-10 min, and recording the beryllium spectral line of each beryllium spectral standard sample / aluminum alloy sample; and 2) drawing the beryllium spectral line of each beryllium spectral standard sample to standard curves, plugging the beryllium spectral lines of the aluminum alloy sample into the standard curves so that the micro beryllium content in the aluminum alloy sample can be obtained.

Description

technical field [0001] The invention relates to the field of quantitative analysis of trace elements in aluminum alloys, in particular to a method for measuring trace beryllium in aluminum alloys by atomic emission spectrometry. Background technique [0002] Aluminum alloy is the most widely used non-ferrous metal alloy material in industry, and it is widely used in aviation, aerospace, machinery manufacturing, shipbuilding and chemical industry. Aluminum alloys usually contain 1-10 ppm of trace beryllium elements, and chemical analysis or spectral analysis is usually used to determine the content of trace beryllium elements in aluminum alloys. [0003] When chemical analysis is used to quantitatively analyze the trace amount of beryllium in aluminum alloy, it is necessary to process the sample powder, weigh the sample, dissolve the sample, and then react to detect the content of beryllium element through reagent preparation. Chemical analysis takes a long time, and due to ...

Claims


Application Information

Patent Timeline
IPC IPC(8): G01N21/67
CPCG01N21/67
Inventor 颜长明程淇
Owner 颜长明
Why Eureka
Try Eureka