Breast imaging device and method based on adjustable LED and dynamic SiPM
A breast imaging and LED light source technology, applied in the field of medical image analysis, can solve problems such as high price, difficulty in early inspection, inspection range or complexity of equipment, etc., and achieve low-cost effects
- Summary
- Abstract
- Description
- Claims
- Application Information
AI Technical Summary
Problems solved by technology
Method used
Image
Examples
Embodiment 1
[0049] Embodiment 1: as Figure 5 Shown are the near-infrared absorption spectra of oxygenated hemoglobin, reduced hemoglobin and water, and the near-infrared light at 700-1300nm is called the "tissue light window". figure 1 It can be seen that the absorption spectrum of water is mainly in the band around 1000nm. Oxygenated hemoglobin and reduced hemoglobin have different absorption characteristics for red light and near-infrared light. The isoabsorptive point is at 805nm, and 760nm and 850nm are points at the same distance from the isoabsorptive point around 805 nm. Combined with oxygenated hemoglobin And the absorption spectrum of reduced hemoglobin and water, so these two wavelengths are selected for measurement.
Embodiment 2
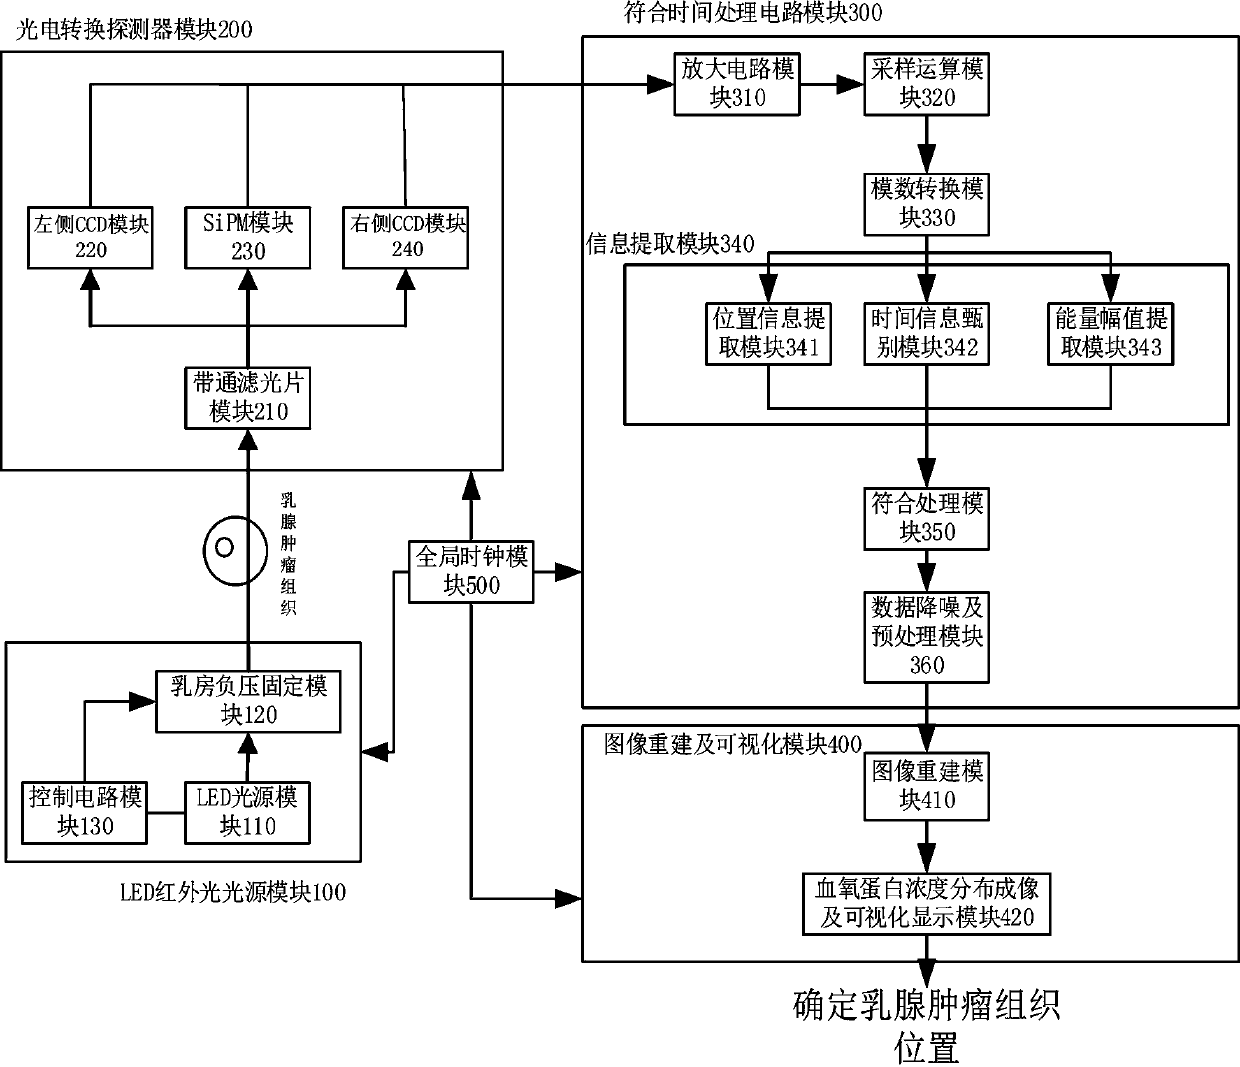
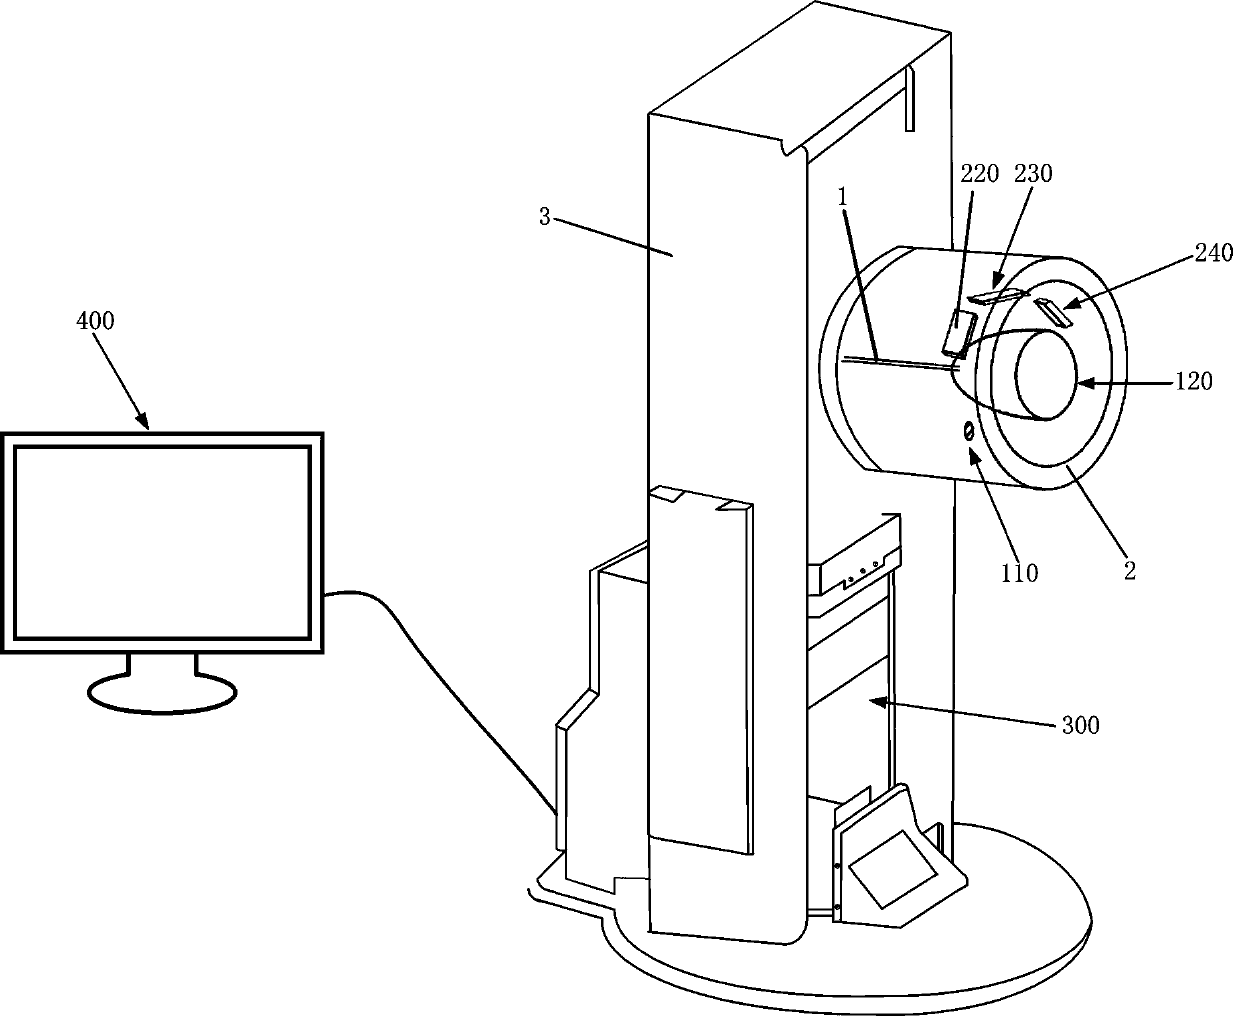
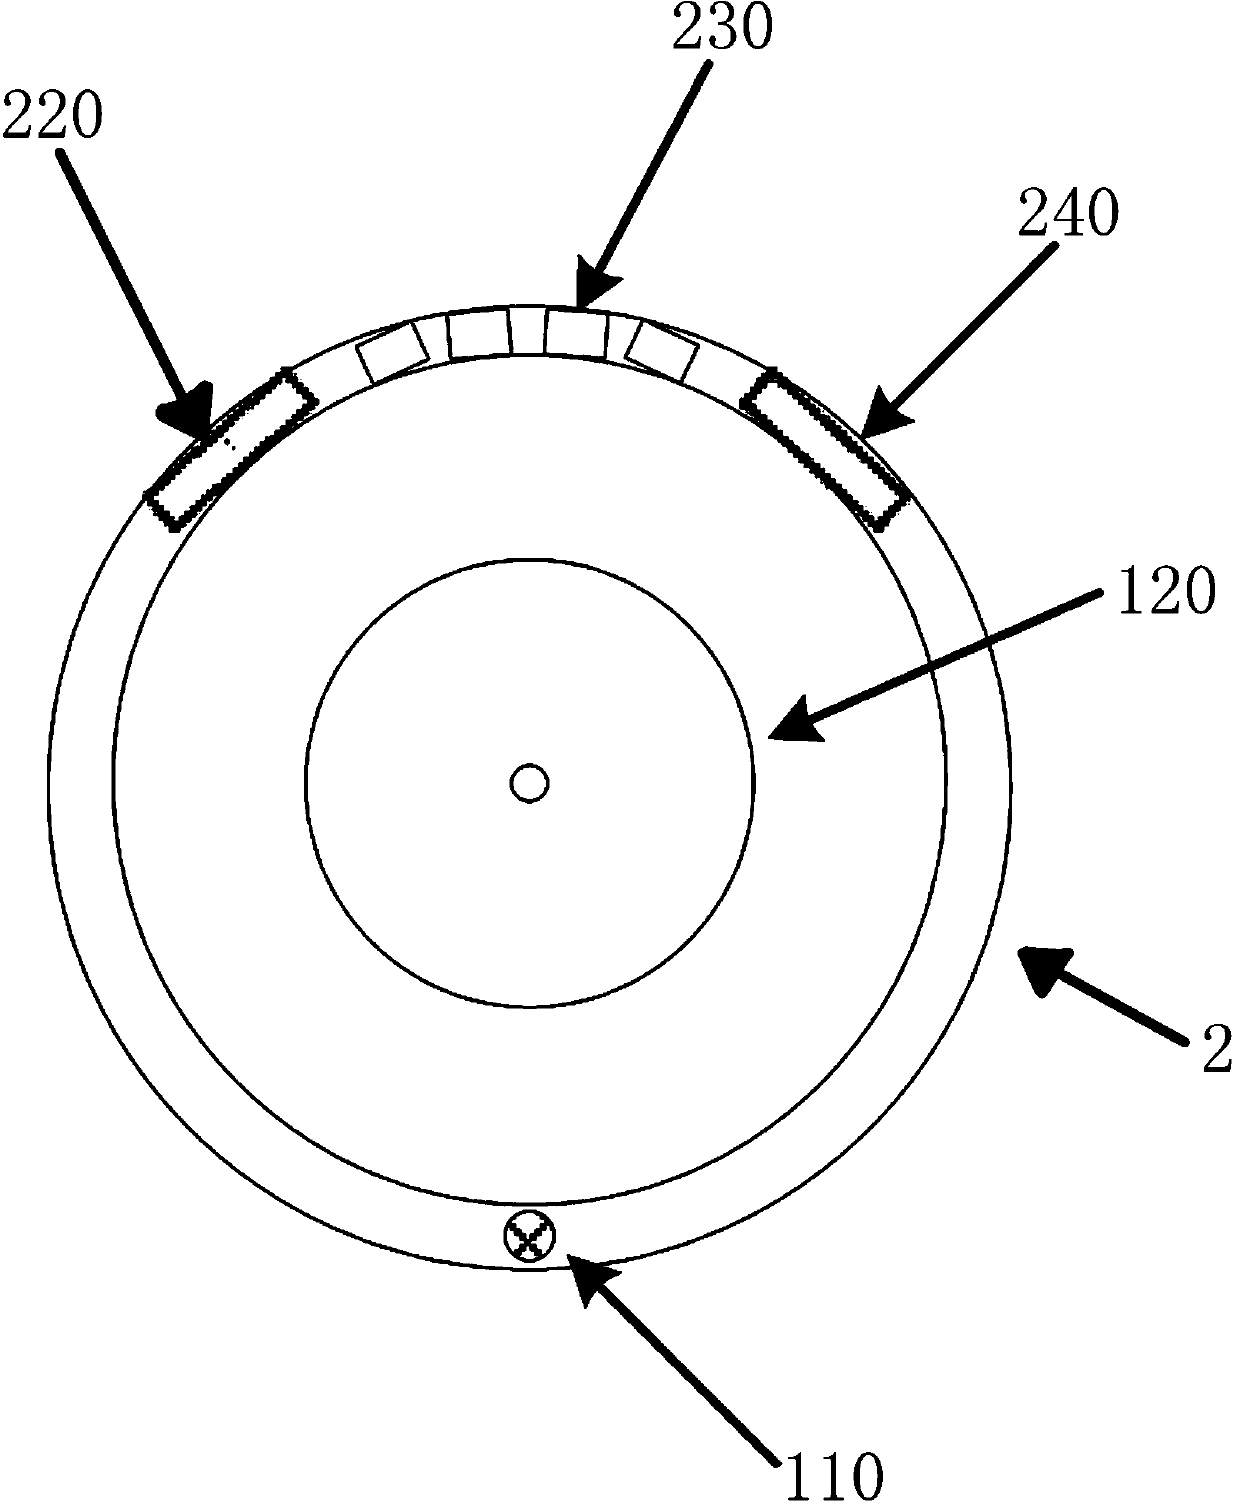
[0050] Embodiment 2: as figure 2 As shown, in this embodiment, the adjustable LED light source module is used to irradiate the detected part to obtain the corresponding hemoglobin concentration distribution map, so as to diagnose the tumor. The adjustable LED and dynamic SiPM imaging device in this embodiment mainly include: LED infrared light source module 100, photoelectric conversion detector module 200, consistent time processing circuit module 300, image reconstruction and visualization module 400 and global clock module 500; LED infrared light source device module 100 includes LED light source module 110, breast negative pressure fixation Module 120, control circuit module 130; Photoelectric conversion detector module 110 includes left side CCD module 220, SiPM module 230, right side CCD module 240 and band-pass filter module 210; Meets time processing circuit module 300 and includes amplifying circuit module 310 , sampling operation module 320, analog-to-digital conver...
Embodiment 3
[0054] Embodiment 3: Perform power spectrum and cross-correlation analysis on the collected optical signals.
[0055] Power spectrum analysis, the random signal X(n) N point observation value X N (n) As a signal with limited energy, take its Fourier transform and get X N (e jw ), then take the square of its magnitude and divide it by N as the real power spectrum P(e of X(n) jw ) estimates. In the specific application, FFT is used to calculate the sampling of the signal spectrum, and the corresponding power spectrum is estimated as:
[0056]
[0057] What the Fourier transform reveals is the inner connection between the time function and the spectrum function, reflecting all the spectrum components of the signal in the entire time range. When using Fourier transform method to extract the signal spectrum, it is necessary to use all the time domain information of the signal. Local changes in the signal affect the entire frequency spectrum of the signal. The collected out...
PUM
| Property | Measurement | Unit |
|---|---|---|
| Wavelength | aaaaa | aaaaa |
Abstract
Description
Claims
Application Information
 - R&D
- Intellectual Property
- Life Sciences
- Materials
- Tech Scout
- Unparalleled Data Quality
- Higher Quality Content
- 60% Fewer Hallucinations
Browse by: Latest US Patents, China's latest patents, Technical Efficacy Thesaurus, Application Domain, Technology Topic, Popular Technical Reports.
© 2025 PatSnap. All rights reserved.Legal|Privacy policy|Modern Slavery Act Transparency Statement|Sitemap|About US| Contact US: help@patsnap.com


