Methods and apparatus for controlling contaminant deposition on dynode electron-emmissive surface

A technology of dynode and electron emission, applied in the direction of dynode, cleaning method and appliance, electron multiplier dynode, etc.

Inactive Publication Date: 2020-07-28
艾德特斯解决方案有限公司
View PDF6 Cites 2 Cited by
  • Summary
  • Abstract
  • Description
  • Claims
  • Application Information

AI Technical Summary

Problems solved by technology

This approach offers only a modest increase in lifetime and is of course limited by the size constraints of the detector unit with the mass spec instrumentation

Method used


Image

  • Methods and apparatus for controlling contaminant deposition on dynode electron-emmissive surface
  • Methods and apparatus for controlling contaminant deposition on dynode electron-emmissive surface
  • Methods and apparatus for controlling contaminant deposition on dynode electron-emmissive surface

Examples


example 1

[0089] Example 1: Analysis of Dynode Surfaces Using Auger Electron Microscopy

[0090] The purpose of this study was to identify the main causes of electron multiplier degradation over time with the aim of optimizing detector lifetime in mass spectrometry applications. Understanding the "aging" process in electron multipliers is an essential prerequisite for developing ultra-long-lived mass spectrometer detectors. By studying the dynode surface of ETP multipliers (ETP Electron Multipliers, New South Wales, Australia), the main factors affecting the performance degradation of electron multipliers were identified.

[0091] Although the analysis of dynode surfaces was performed on discrete dynode devices, these results can be generalized to any type of electron multiplier detector.

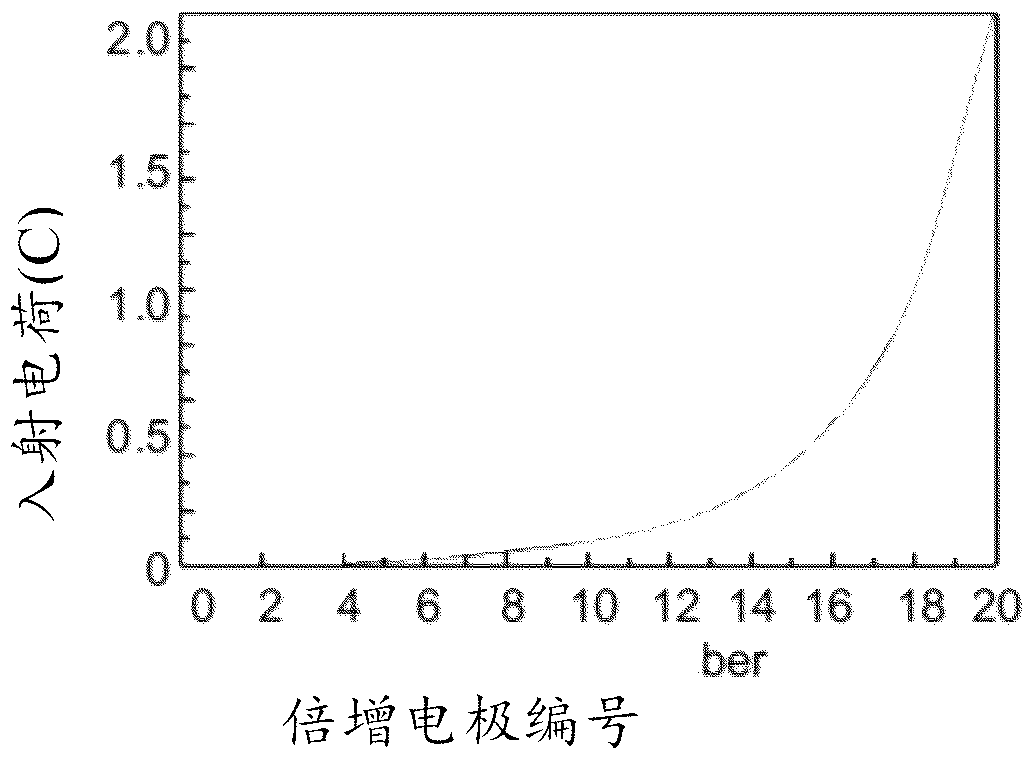
[0092] Tests were performed on a 20-stage multiplier in a 3×10 -6 Operates under millibar vacuum. Introduce a constant flow of nitrogen ions into the multiplier hole and dynamically adjust the m...

example 2

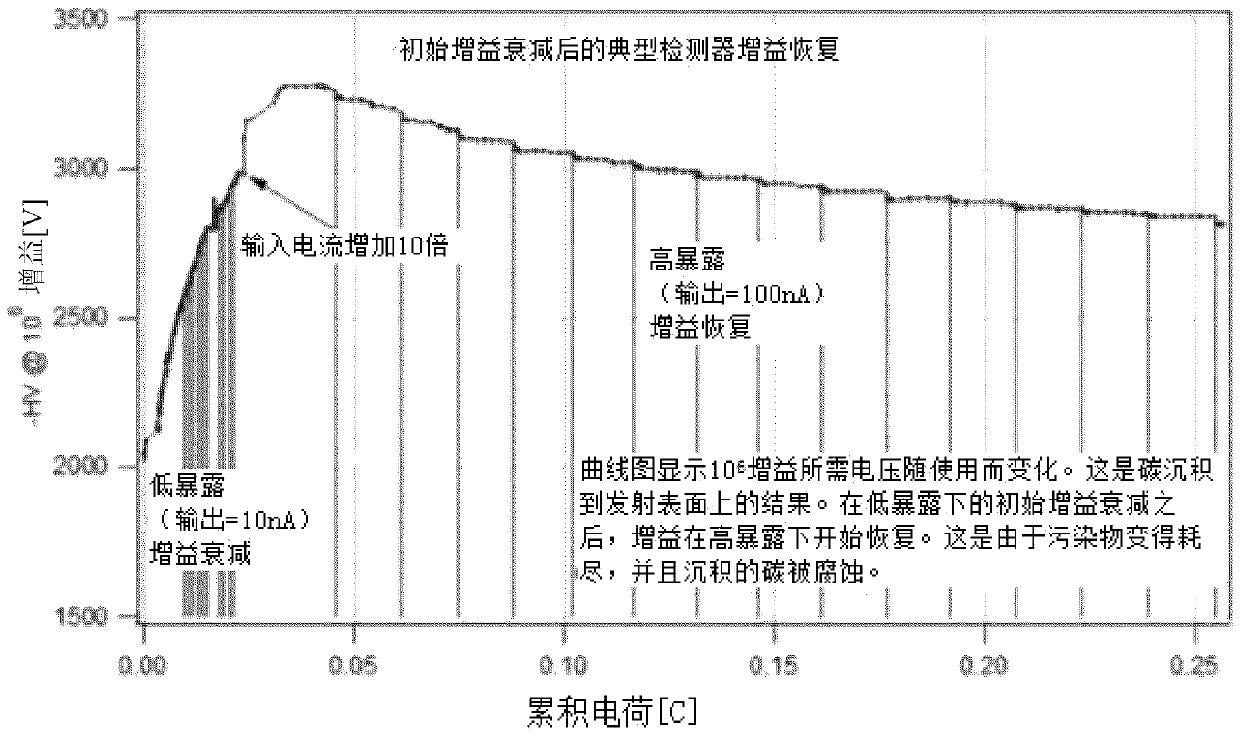
[0100] Example 2: Restoring detector gain after initial gain decay by removing carbonaceous contaminants.

[0101] An experiment was performed to show the removal of carbon deposits from the dynode surface by manipulating the input current in the presence of water molecules. refer to Figure 6 .

[0102] The device used is a magnetic multiplier (MagneTOF) with continuous dynodes operating in a time-of-flight mass spectrometer. The base pressure of the analyzer chamber is 1×10 -6 millibar.

[0103] During the experiment, the voltage supplied to the detector (y-axis) was adjusted to maintain 10 6 total gain. The output charge accumulated by the detector over time (unit: coulombs) is shown on the x-axis.

[0104] The plot shows that at low electron exposure levels, as the accumulated charge increases from zero, an increase in voltage is required to counteract the gain reduction. At the point indicated by the arrow, the output current is increased by a factor of 10 from 1...

example 3

[0106] Example 3: Water-assisted removal of carbonaceous pollutants.

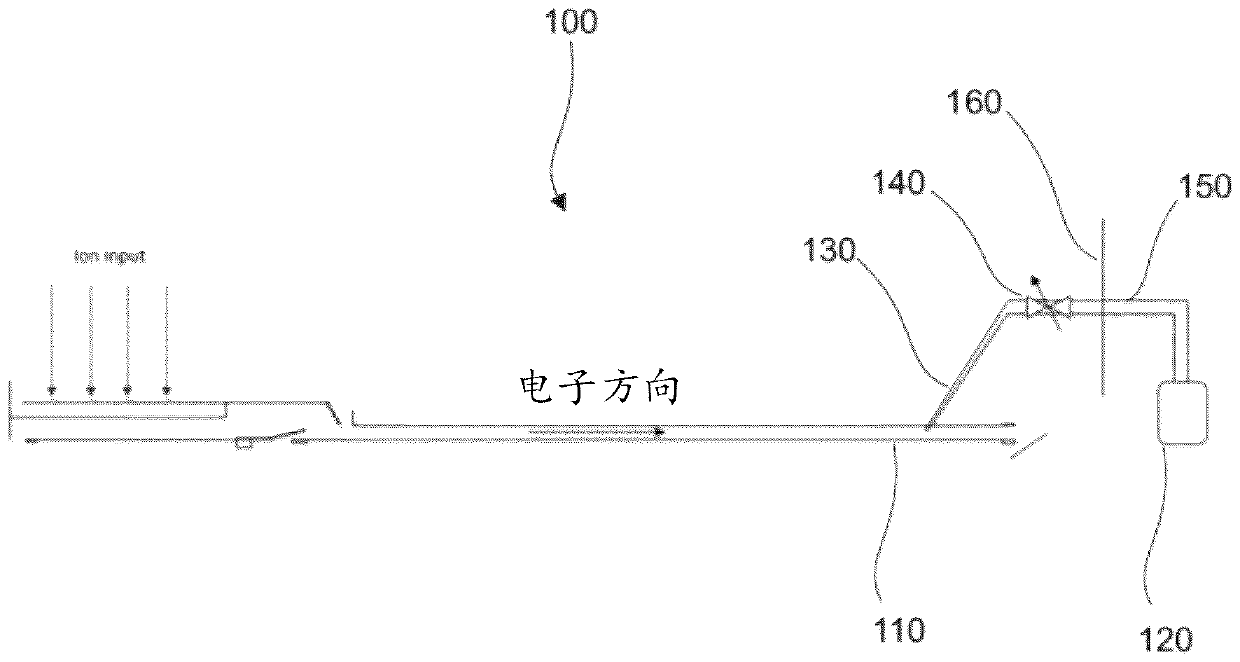
[0107] The detector of Example 2 was modified to include a capillary extending from the inside to the outside of the detector vacuum chamber. The outdoor end of the capillary is connected to a source of gaseous water. A valve is placed between the water source and the capillary so that the amount and timing of the gaseous water can be controlled.

[0108] The detector was operated as described in Example 2, except that gaseous water was introduced at 1 mPa. The water flow is controlled at about 0.1 sccm, so the total chamber pressure is essentially unaffected, but the water is concentrated on critical surfaces.

[0109] The resulting voltage graph is similar to Figure 6 The difference is that the gain recovery portion of the graph (i.e., after the initial decay) is steeper, thus reflecting a faster (and possibly more complete) reversal of the gain decay.

[0110] refer to Figure 7 , which shows a c...


PUM


Abstract

The present invention relates to generally to components of scientific analytical equipment, and particularly to methods for extending the operational lifetime or otherwise improving the performance of dynodes used in electron multipliers. An aspect of the invention is embodied in a method for: (i) increasing the secondary electron yield of a dynode and / or (ii) decreasing the rate of degradation of electron yield of a dynode, the method comprising the step of exposing a dynode electron-emissive surface to an electron flux under conditions causing electron-impact induced removal of a contaminant deposited on the dynode electron-emissive surface. The conditions may be selected such that the electron-mediated removal is enhanced relative to a contaminant deposition process so as to provide anet decrease in the rate of contaminant deposition and / or a decrease in the amount of contaminant present on the dynode electron-emissive surface.

Description

technical field [0001] The present invention generally relates to components of scientific analysis equipment. More particularly, the present invention relates to methods for extending the operating life or otherwise improving the performance of dynodes used in electron multipliers. Background technique [0002] Amplifying electronic signals is necessary in many scientific applications. For example, in a mass spectrometer, analytes are ionized to form a series of charged particles (ions). The resulting ions are then separated according to their mass-to-charge ratios, typically by acceleration and exposure to electric or magnetic fields. The separated signal ions strike the ion detector surface to generate one or more secondary electrons. Results are shown as spectra of relative abundance of detected ions as a function of mass-to-charge ratio. [0003] In other applications, the particles to be detected may not be ions, but may be neutral atoms, neutral molecules or ele...

Claims


Application Information

Patent Timeline
Patent Type & Authority Applications(China)
IPC IPC(8): H01J43/10H01J37/00
CPCH01J43/10H01L21/263H01J49/025B08B7/0035H01J9/00H01J2209/017
Inventor W.希尔斯T.尚利
Owner 艾德特斯解决方案有限公司
Why Eureka
Try Eureka