
Method for Quantitative Monitoring of Substance Content by Raman Spectroscopy

A technology of Raman spectroscopy and material content, which is applied in the fields of medicine, industrial technology and biomedicine, can solve problems such as the difficulty of accurate concentration data, and achieve the effects of ensuring measurement accuracy, improving accuracy, and improving accuracy

Active Publication Date: 2022-02-11
GREATER BAY AREA STAR BIOTECH (SHENZHEN) CO LTD
View PDF10 Cites 0 Cited by
  • Summary
  • Abstract
  • Description
  • Claims
  • Application Information

AI Technical Summary

Problems solved by technology

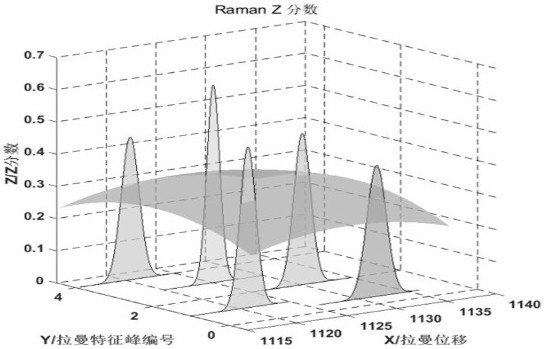
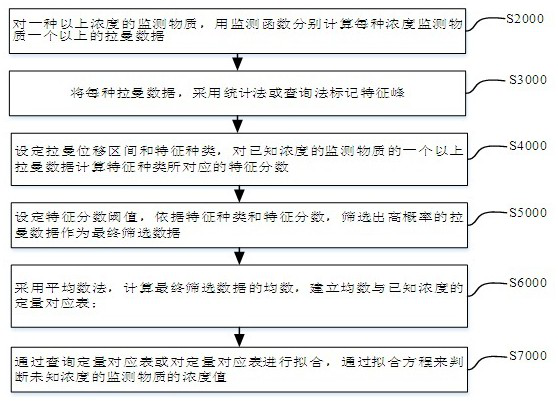
[0035] For the industrial field, especially the medical field, under the hardware conditions of the existing Raman spectrometer, due to the interference of fluorescence and other non-monitored substances Raman spectrum, as well as the existence of system errors and measurement errors, artificially pass a one-time single It is difficult to obtain accurate concentration data within the set error range, based on a For the monitored substances with the above concentrations, use the following methods to collect a large number of sample data and calculate the data to form the Raman spectrum big data of the monitored substances, and then analyze and screen the Raman big data through algorithms based on probability statistics theory, and finally Obtain a more accurate quantitative analysis of the concentration of the monitored substance within a controllable allowable error range

Method used


Image

  • Method for Quantitative Monitoring of Substance Content by Raman Spectroscopy
  • Method for Quantitative Monitoring of Substance Content by Raman Spectroscopy
  • Method for Quantitative Monitoring of Substance Content by Raman Spectroscopy

Examples


Embodiment 1

[0191] Example 1: In vitro blood glucose Raman spectroscopy quantitative monitoring method.

[0192] This example is a general example of the method for quantitatively monitoring substance content by Raman spectroscopy of the present invention. Glucose is used as the monitoring experiment object, and spectra are collected by Raman spectroscopy measurement equipment. Among them, the glucose substance is composed of pure glucose powder and glucose aqueous solution with different concentration ratios, through the optical signal collection of the Raman spectroscopic measurement equipment, the corresponding Raman data and Raman spectral lines are obtained, and then the method of the present invention is used to perform Raman characteristics. Peak extraction and analysis, as well as big data quantitative analysis, establishes the corresponding relationship between Raman characteristic peaks and glucose concentration, that is, establishes a quantitative correspondence table and a fitt...

Embodiment 2

[0370] Embodiment 2: Raman spectroscopy quantitative monitoring method for mixed component substances.

[0371] 1. Description of the basic plan.

[0372] In order to more fully describe the scope of application of the present invention, the inventor provides an example of a method for quantitative monitoring of Raman spectroscopy of mixed component substances, the purpose of which is to illustrate that the present invention is used for in vitro blood glucose Raman spectroscopy as described in Example 1. In terms of quantitative monitoring, it can also be used in the aspect of quantitative monitoring of mixed component substances by Raman spectroscopy. The mixed component substances mentioned in this embodiment refer to mixed component substances composed of more than one different substance in random proportions. There are no more than 4 kinds of substances in the optimal composition of the mixture. This is because, under the condition of fixed intensity and wavelength, the l...

Embodiment 3

[0383] Embodiment 3: The single-machine version specific substance Raman spectroscopy quantitative monitoring method.

[0384] 1. Differentiation description.

[0385] Based on the fact that Embodiment 1 and Embodiment 2 are both cloud mode versions, in some application scenarios, it needs to be simplified as much as possible, and the application conditions for wide area networks are not yet available, such as anti-drug work, market supervision work, ocean exploration work, field investigation work, etc. Scenarios, these application scenarios often need to monitor only known substances, and only these specific substances need to be preset in the storage. Therefore, the inventor provides a stand-alone Raman spectrum monitoring method for a specific substance that can be used on a portable device. For details, refer to Embodiment 1 and Embodiment 2. The similarities will not be repeated, and the differences lie in the following points.

[0386] 1. Cancel the working steps of th...


PUM


Abstract

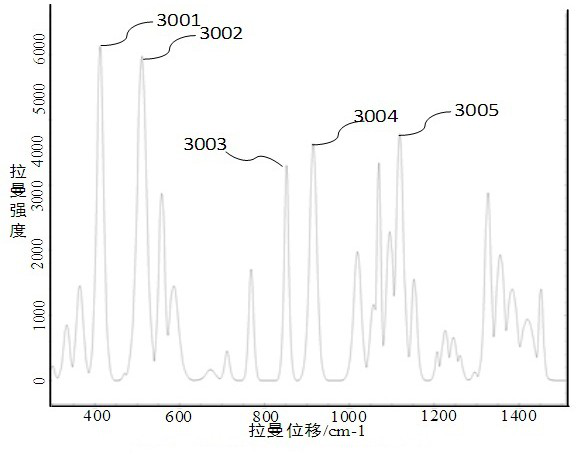
The method of Raman spectroscopy quantitatively monitors the content of substances. For various concentrations of monitored substances, the monitoring functions of Euclidean geometry and Riemannian geometry are established, and the corresponding Raman data are calculated respectively, and the characteristics of Raman spectral lines are marked by statistical methods or query methods. Peak; for the characteristic peak shape and type set for multiple Raman data of the same concentration of monitored substances, the characteristic score is calculated through the Z test algorithm and other algorithms, and the Raman data with high probability are screened out based on statistical principles As the final screening data; use the average method to calculate the mean value of the screening data, establish a quantitative correspondence table between the mean value and the concentration, and obtain the concentration and error of the substance with an unknown concentration by querying the quantitative correspondence table; or use the fitting method to match the concentration of the known substance in the correspondence table The Raman data corresponding to the value of the value is the fitting point, and the curve fitting of the controllable error is performed to obtain the fitting equation, so as to realize a more accurate calculation of the concentration value of the unknown concentration monitoring substance. In addition, it also provides the working steps of cloud computing .

Description

technical field [0001] The present invention relates to the field of industrial technology and biomedicine, in particular to the Raman spectrum big data analysis method of medical data and industrial data, especially for the Raman test in the medical field, by establishing the Raman spectrum big data of monitoring substances, the Raman A method for spectroscopic quantitative monitoring of substance content. Background technique [0002] As early as 1928, the Indian scientist C.V. Raman discovered the Raman scattering phenomenon, that is, when a beam of light is irradiated on certain substances, the frequency of the scattered light will change. The last name of the person who discovered it called it a Raman spectrum. Different substances correspond to a unique spectrum with extremely strong resolution, which makes it possible for Raman spectroscopy to be used as an analysis and testing method for the structure of substances. Although C.V. Raman won the Nobel Prize for this ...

Claims


Application Information

Patent Timeline
Patent Type & Authority Patents(China)
IPC IPC(8): G01N21/65G06K9/62
CPCG01N21/65G06F18/241G06F18/2411G06F18/2415
Inventor 丁贤根黄世回嵇旭辉丁远彤
Owner GREATER BAY AREA STAR BIOTECH (SHENZHEN) CO LTD
Learn More