

Paramagnetic material-containing magnetic resonance external marker or calibration composition
a technology of external markers and magnets, which is applied in the direction of biocide, plant growth regulators, sensors, etc., can solve the problems of temperature dependence, temperature and field strength dependence, and temperature control of magnets, and howe did not provide a solution
- Summary
- Abstract
- Description
- Claims
- Application Information
AI Technical Summary
Problems solved by technology
Method used
Image

Examples
example 2
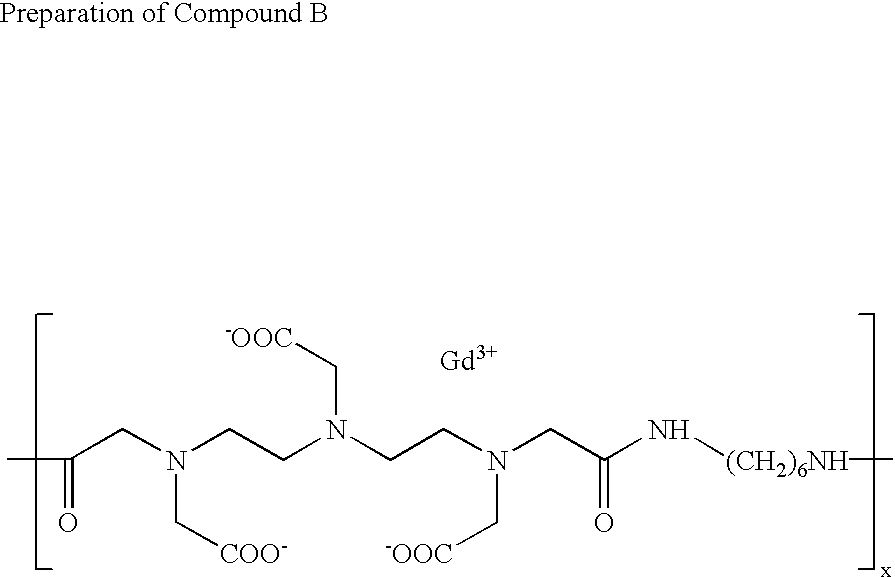
[0142] 2
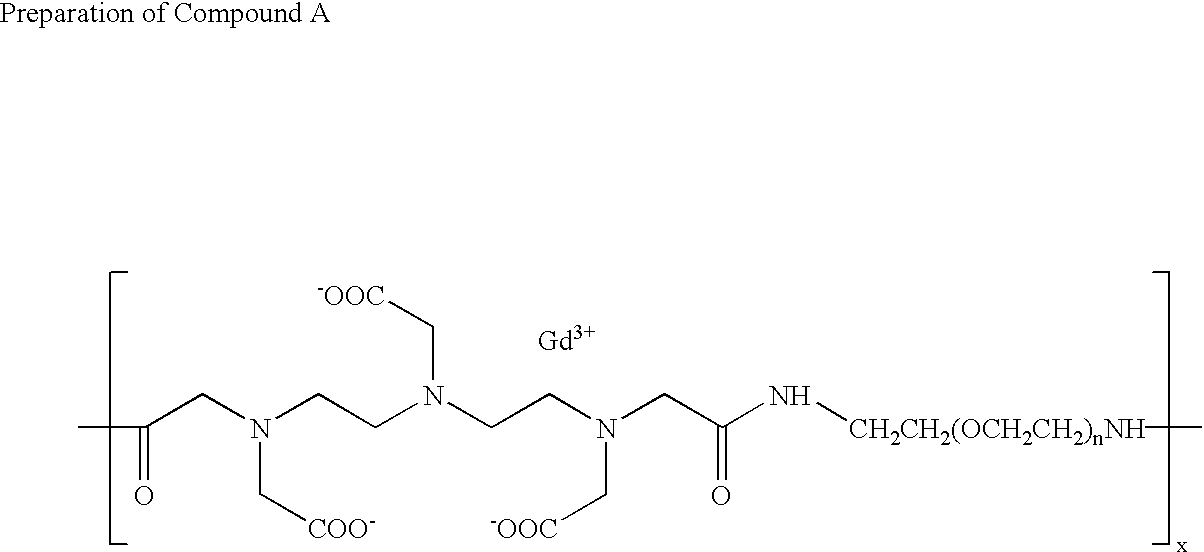
[0143] To a solution of 2.97 g (25.5 mmol) of 1,6-hexanediamine in 45.1 ml of dimethylsulfoxide were added 11.08 ml (79.5 mmol) of triethylamine and 9.45 g (31.8 mmol) of diethylenetriaminepentaacetic acid dianhydride with vigorous stirring. The resulting reaction mixture was stirred at ambient temperature for 28 hours to give a homogeneous solution, following which it was diluted to approximately 1% solids content with water and diafiltered for 5 turnovers using a nominal 10,000 MW cut-off, spiral wound, polysufone diafiltration membrane. The resulting aqueous retentate was then freeze-dried to yield a hygroscopic white solid.
[0144] 15.0 g of this solid was dissolved in 600 mls of deionized water and stirred at moderate speed as it was slowly treated with a 5% aqueous solution of gadolinium (III) chloride hexahydrate. The addition was continued until a small test sample, dripped into PAR test reagent, caused a color change from pale yellow to deep yellow. The PAR test reage...
example 3
[0147] Preparation of Gadolinium Polymer Markers in 2% Agar Gel
[0148] Preparation of 2% (wt / wt) Agarose Gel
[0149] 1.00 g of granulated purified Agar-Agar (Merk KGAA) was weighed into five 50 ml glass vials. 0.075 g of Sodium benzoate (Fluka Chemika-BioChemika) and 0.075 g of potassium sorbate (>99%, Fluka Chemika-BioChemika) were weighed into each of the five samples. 50.0 mL of purified water was pipetted into each of the five samples. The samples were sealed with Teflon clamp tops and placed in a boiling water bath for 20 minutes until a clear solution was observed. The samples were removed from the water bath and allowed to cool to 60-70.degree. C. prior to the addition of the gadolinium complexes.
[0150] NMRD profiles of the pure gel are shown in FIGS. 4 and 5.
[0151] Preparation of the Gadolinium Polymers
[0152] Table 2 shows the amount of Compounds A and B required to prepare the external markers with 1 / T.sub.1 (s.sup.-1) values of 1.15, 1.31, 1.68 and 3.03 s.sup.-1. One gel blan...
example 4
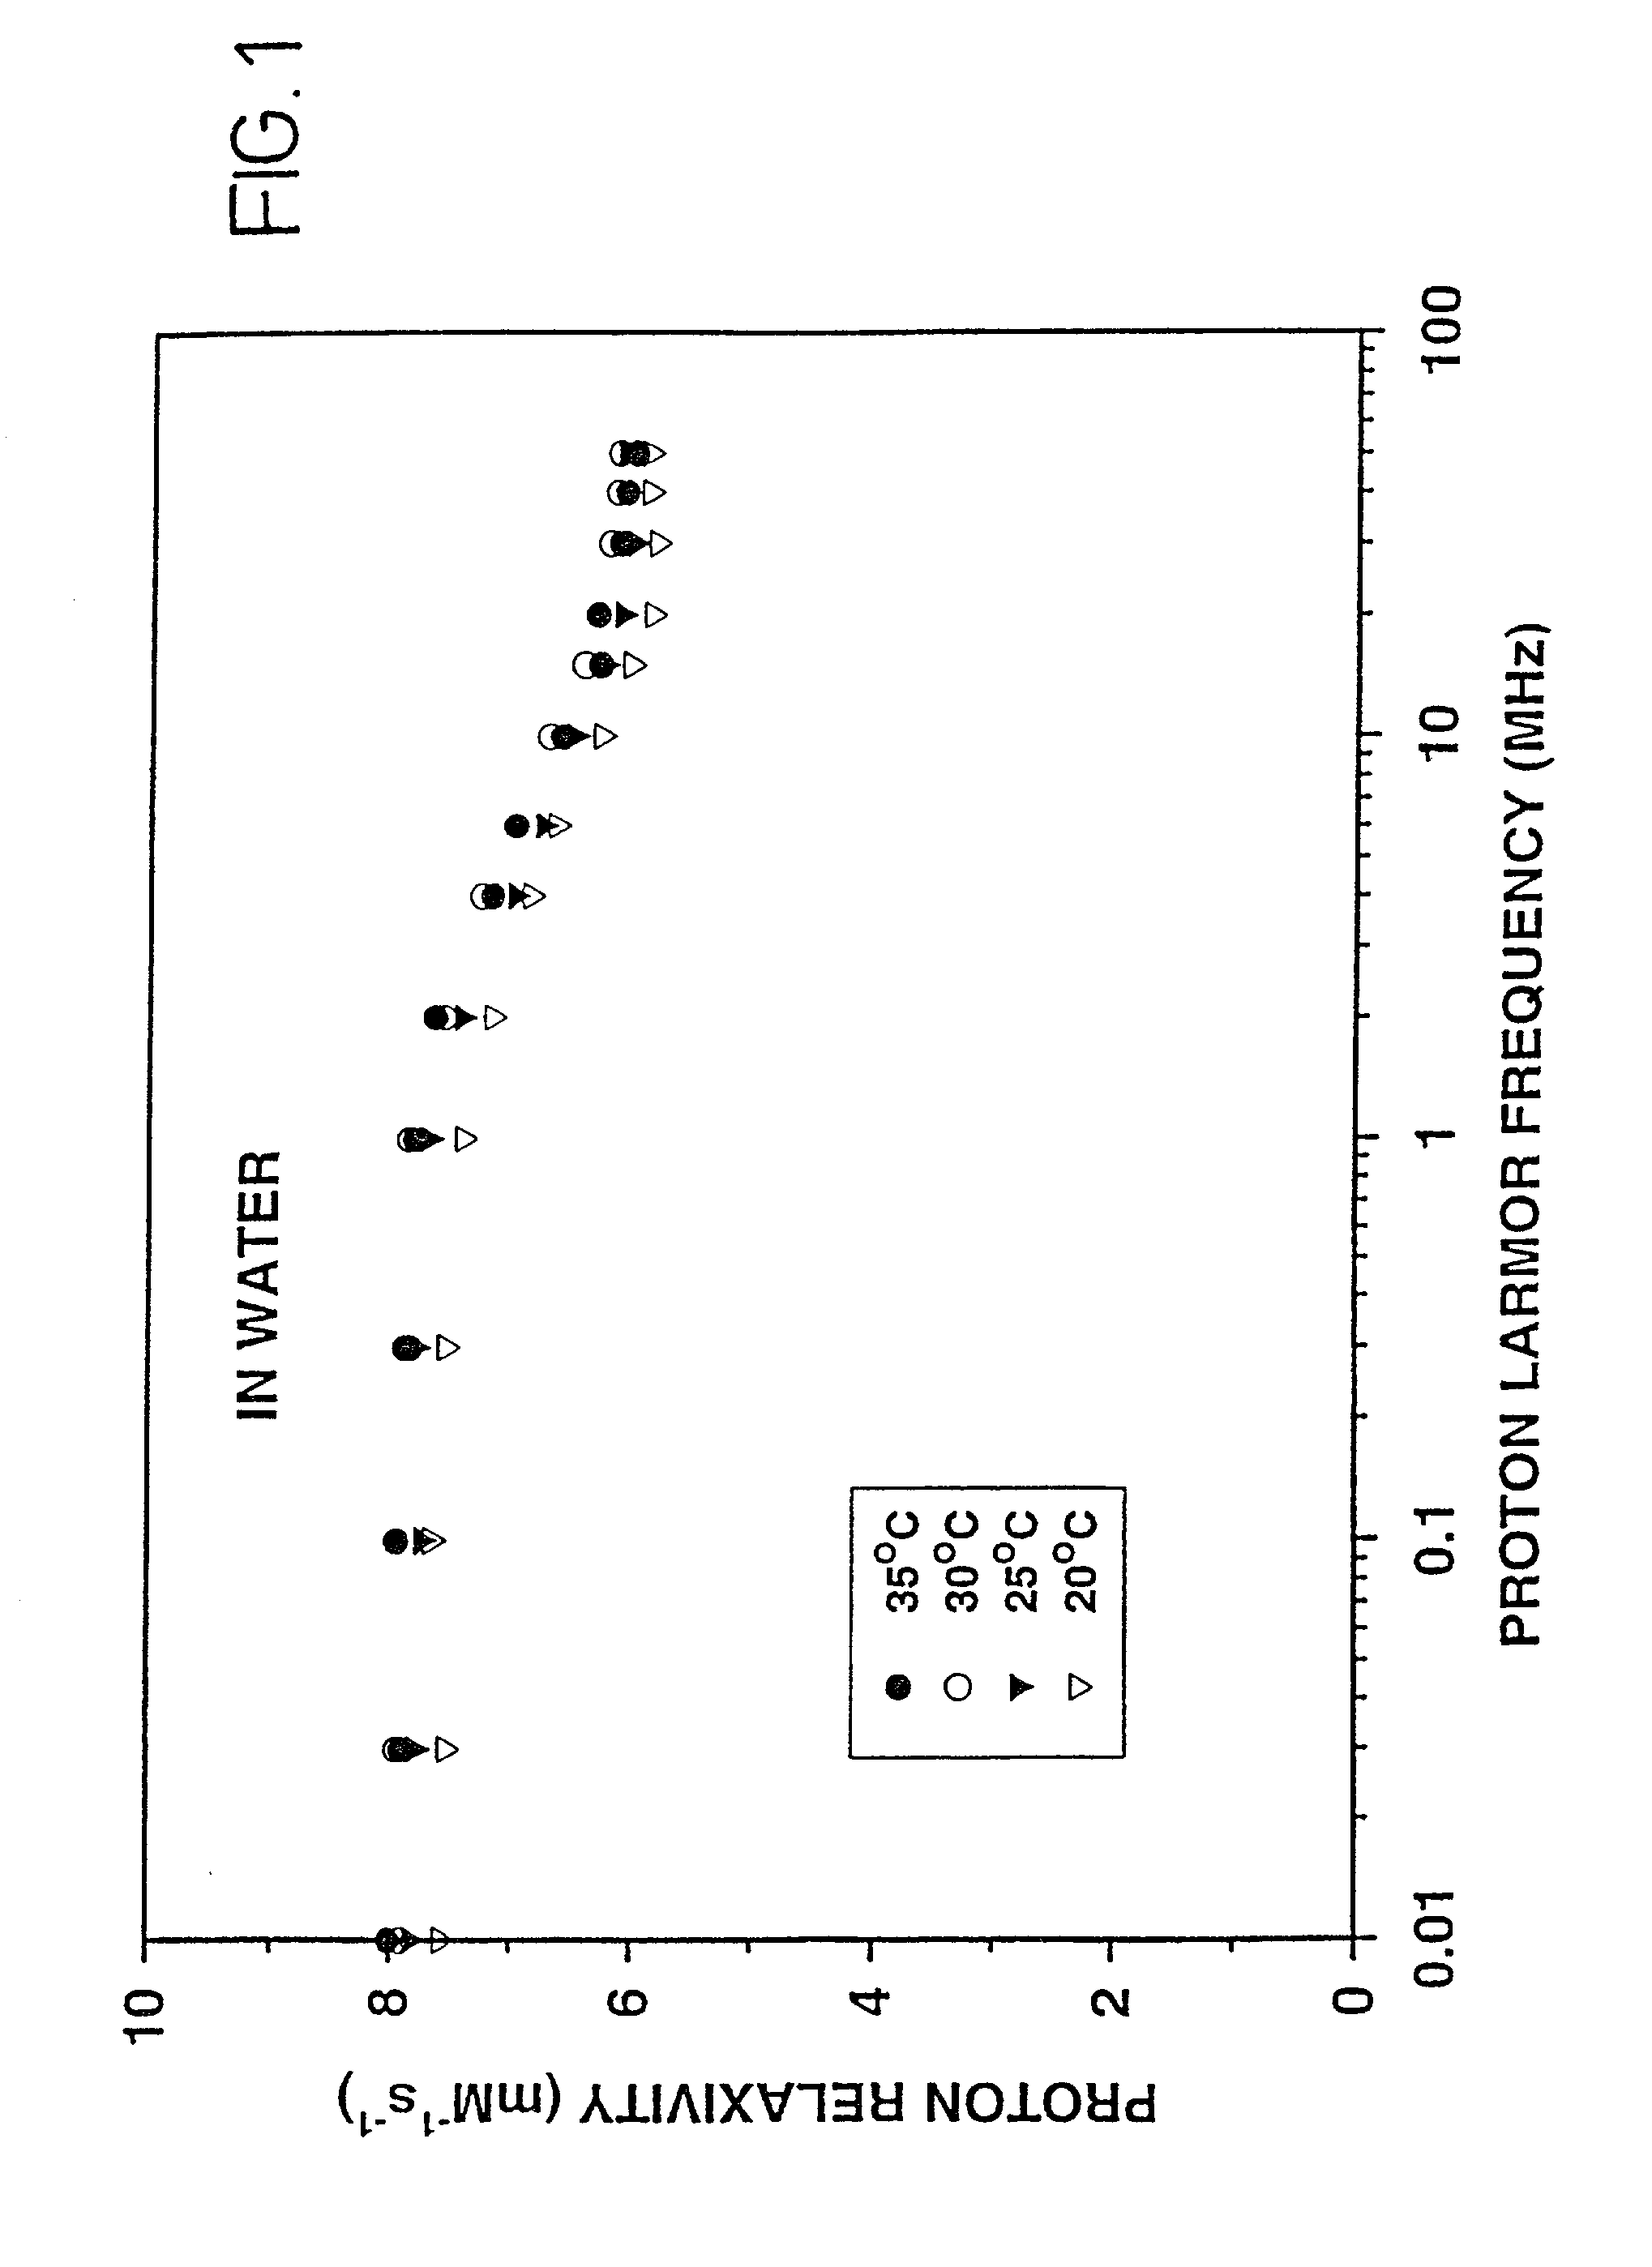
[0162] Preparation of Markers in Water
[0163] A stock solution of Compound A in distilled water with a total Gd concentration of 4.02 mM, and a stock solution of Compound B in distilled water with a total Gd concentration of 7.03 mM, were prepared. The relative concentrations of the two stock solutions to be used in a marker with a given projected T.sub.1 were determined as described previously. A total volume of 10 mL was used for each marker; the volume used for each of the stock solutions is listed below.
3 Volume of Compound A Volume of Compound B Projected T.sub.1 (ms) Stock Added (mL) Stock Added (mL) 1000 0.0746 0.0755 800 0.200 0.0646 600 0.409 0.0515 400 0.828 0.0215
[0164] In order for the markers to have clinical utility, the markers must give stable T.sub.1 results as a function of sample storage. The shelf-life stability of the marker solutions were evaluated by analyzing the longitudinal relaxaiton times over a nine month storage period. The samples were stored at 4.degre...
PUM
| Property | Measurement | Unit |
|---|---|---|
| temperature | aaaaa | aaaaa |
| temperature | aaaaa | aaaaa |
| temperature | aaaaa | aaaaa |
Abstract
Description
Claims
Application Information