Methods for comparing relative flux rates of two or more biological molecules in vivo through a single protocol

a technology of biological molecules and flux rates, applied in the field of methods for comparing relative flux rates of two or more biological molecules in vivo through a single protocol, can solve the problems of no commercially available, high-throughput screening tools available for phenotypic characterization or toxicity assessment, and technical limitations that have held back the development of high-throughput universal screening procedures

Active Publication Date: 2005-01-27
RGT UNIV OF CALIFORNIA
View PDF54 Cites 50 Cited by
  • Summary
  • Abstract
  • Description
  • Claims
  • Application Information

AI Technical Summary

Benefits of technology

Toxic effects of a biological agent may be determined by measuring and comparing the molecular flux rates of two or more biological molecules in a first population of one or more tissues or individuals, administering the biological agent to a second population of one or more tissues or individuals, and measuring and comparing the relative molecular flux rates of the two or more biological molecules in the second population compared to the first population. A difference in the compared molecular flux rates between the first population and the second population identifies a toxic effect of the biological agent.
Alternatively, toxic effects of a biological agent may be determined by measuring and comparing the molecular flux rates of two or more biological molecules in a population of one or more tissues or individuals, administering the biological agent to the population, and measuring and comparing the relative molecular flux rates of the two or more biological molecules before and after administration. A difference in the compared molecular flux rates before and after administration of the biological agent identifies a toxic effect of the biological agent.
Toxic effects of a xenobiotic (such as a new chemical entity, drug, drug candidate, drug lead, a biological agent, an environmental chemical, food additive, industrial chemical, or cosmetic, or combinations or mixtures thereof) may be determined by measuring and comparing the molecular flux rates of two or more biological molecules in a first population of one or more tissues or individuals (such as experimental animals or humans), administering the xenobiotic (or combination of xenobiotics or mixtures of xenobiotics) to a second population of one or more tissues or individuals, and measuring and comparing the relative molecular flux rates of the two or more biological molecules in the second population compared to the first population. A difference in the compared molecular flux rates between the first population and the second population identifies a toxic effect of the xenobiotic (or combination of xenobiotics or mixtures of xenobiotics).
Alternatively, toxic effects of a xenobiotic may be determined by measuring and comparing the molecular flux rates of two or more biological molecules in a population of one or more tissues or individuals, administering the xenobiotic (or combination of xenobiotics or mixtures of xenobiotics) to the population, and measuring and comparing the relative molecular flux rates of the two or more biological molecules before and after administration. A difference in the compared molecular flux rates before and after administration of the xenobiotic (or combination of xenobiotics or mixtures of xeniobiotics) identifies a toxic effect of the xenobiotic (or combinations of xenobiotics or mixtures of xenobiotics).

Problems solved by technology

There are too many targets and too many lead compounds for pharmaceutical companies to pursue all of them fully.
At present, however, there are no commercially available, high-throughput screening tools available for phenotypic characterization or toxicity assessment.
This deficiency represents a serious gap in the pharmaceutical industry's repertoire of tools.
Technical limitations have held back the development of high-throughput universal screening procedures for measuring biochemical phenotypes, in contrast to genotypes.
Although research techniques for measuring the concentrations of molecules (such as immunoassay, standard clinical chemistry, genomics / proteomics and other conventional high-throughput methods) are highly advanced, research techniques for measuring molecular fluxes are not as advanced.
This deficiency represents a fundamental problem because the altered flow of molecules through complex metabolic pathways underlies essentially all diseases.
By way of example, a labeled amino acid, such as 3H-leucine or 13C-lysine, can be given to label a protein or all proteins biosynthetically in the cell or organism of interest, but other classes of molecules (e.g., lipids, DNA, carbohydrates), are not usefully or reliably labeled from amino acids.
Similarly, labels for measuring DNA and RNA kinetics do not allow kinetic measurements of lipids, proteins, and other classes of molecules.
For this reason, previous kinetic labeling measurements have not provided information about relative molecular flux rates of multiple biological molecules of different classes, through a single protocol.

Method used


Image

  • Methods for comparing relative flux rates of two or more biological molecules in vivo through a single protocol
  • Methods for comparing relative flux rates of two or more biological molecules in vivo through a single protocol
  • Methods for comparing relative flux rates of two or more biological molecules in vivo through a single protocol

Examples


example 1

Ratio of DNA: Protein Synthesis in Growing Tissues

The ratio of 2H-incorporation from 2H2O into DNA: protein in muscle, liver or other tissues reveals whether tissue growth is due to hyperplasia (addition of new cells) or hypertrophy (growth in size of each cell, without addition of new cells). This distinction is key to evaluating growth factors, genes or other interventions designed to alter the mass of any tissue. DNA:protein synthesis rates are measured concurrently by administering labeled water and detecting the incorporation of the isotope label in the DNA and proteins.

example 2

Ratio of DNA: Protein Synthesis in Tumor Cells or Microorganisms During Chemotherapy

The ratio of DNA: protein kinetics in bacteria during antibiotic chemotherapy reveals whether the antibiotic agent is working in a bactericidal manner (killing cells) or in a bacteriostatic manner (preventing cells from growing but not killing them). Similarly, ratios of DNA: protein kinetics in a tumor during chemotherapy reveals if cell death has been induced or growth has been halted (tumoricidal vs. tumoristatic effects). DNA: protein synthesis rates are measured concurrently by administering labeled water and detecting the incorporation of the isotope label in the DNA and proteins.

example 3

Ratio of Mitochondrial DNA to Cellular Protein or Genomic DNA Synthesis Rates

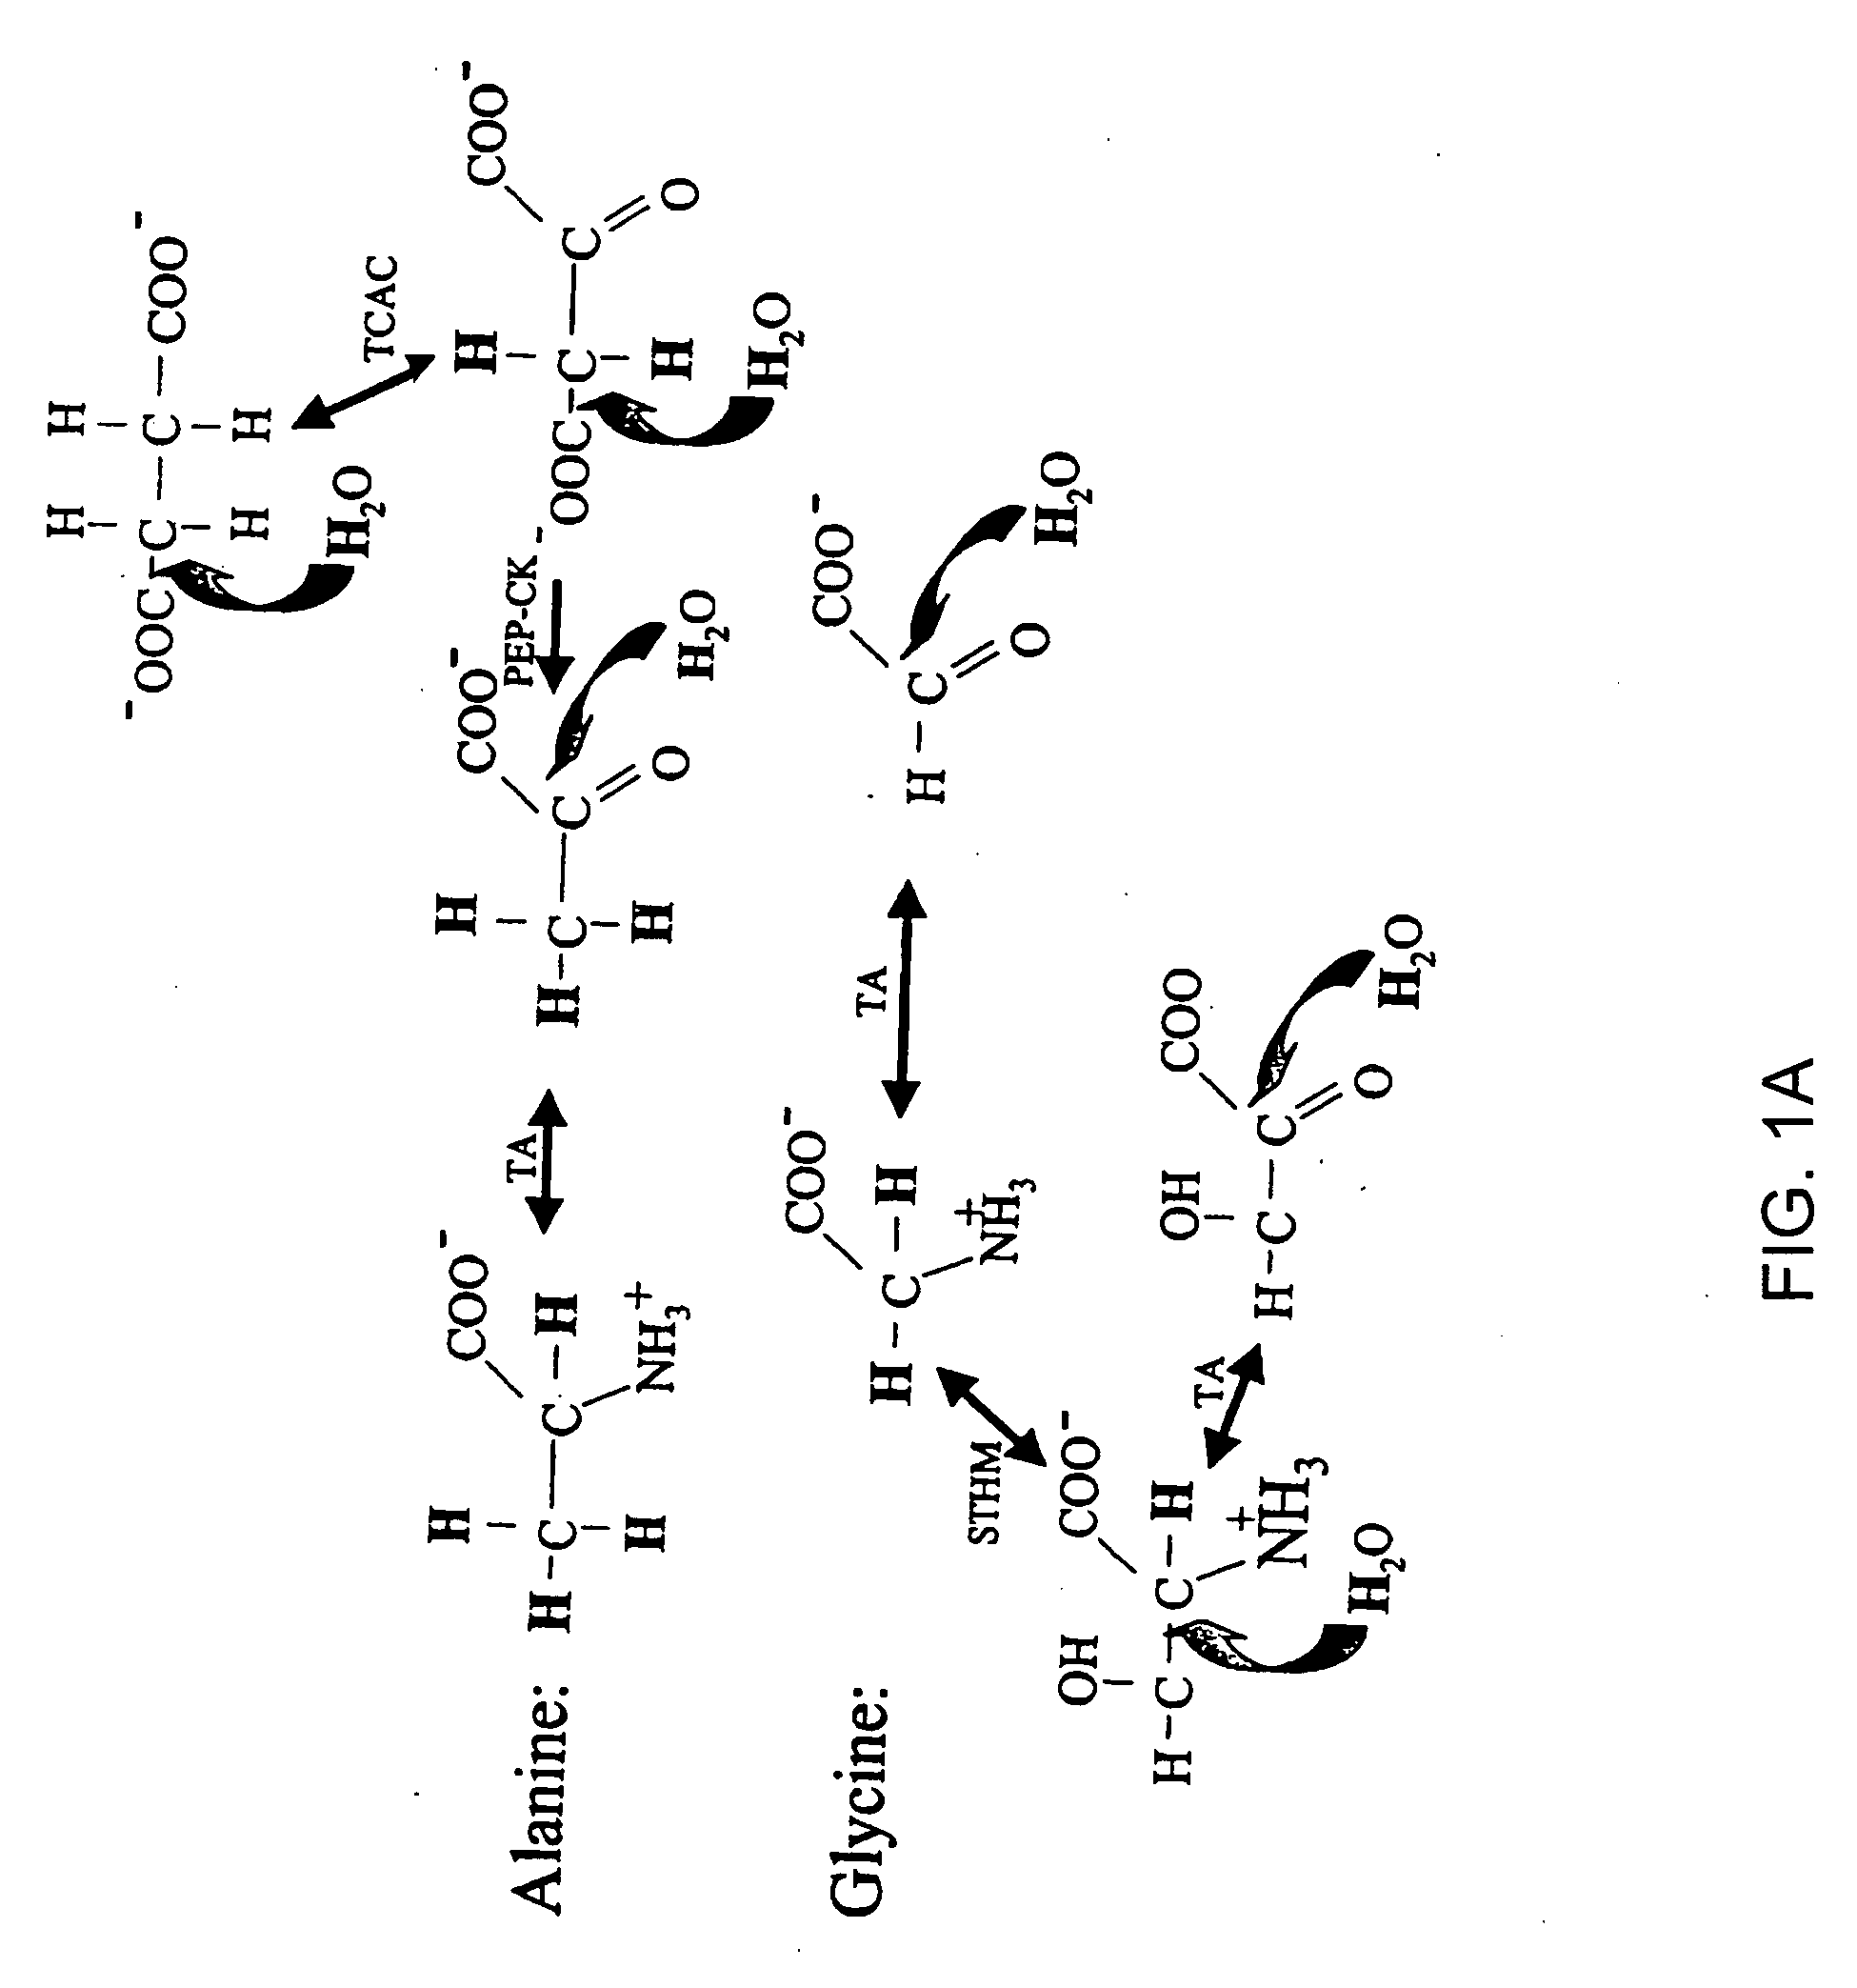
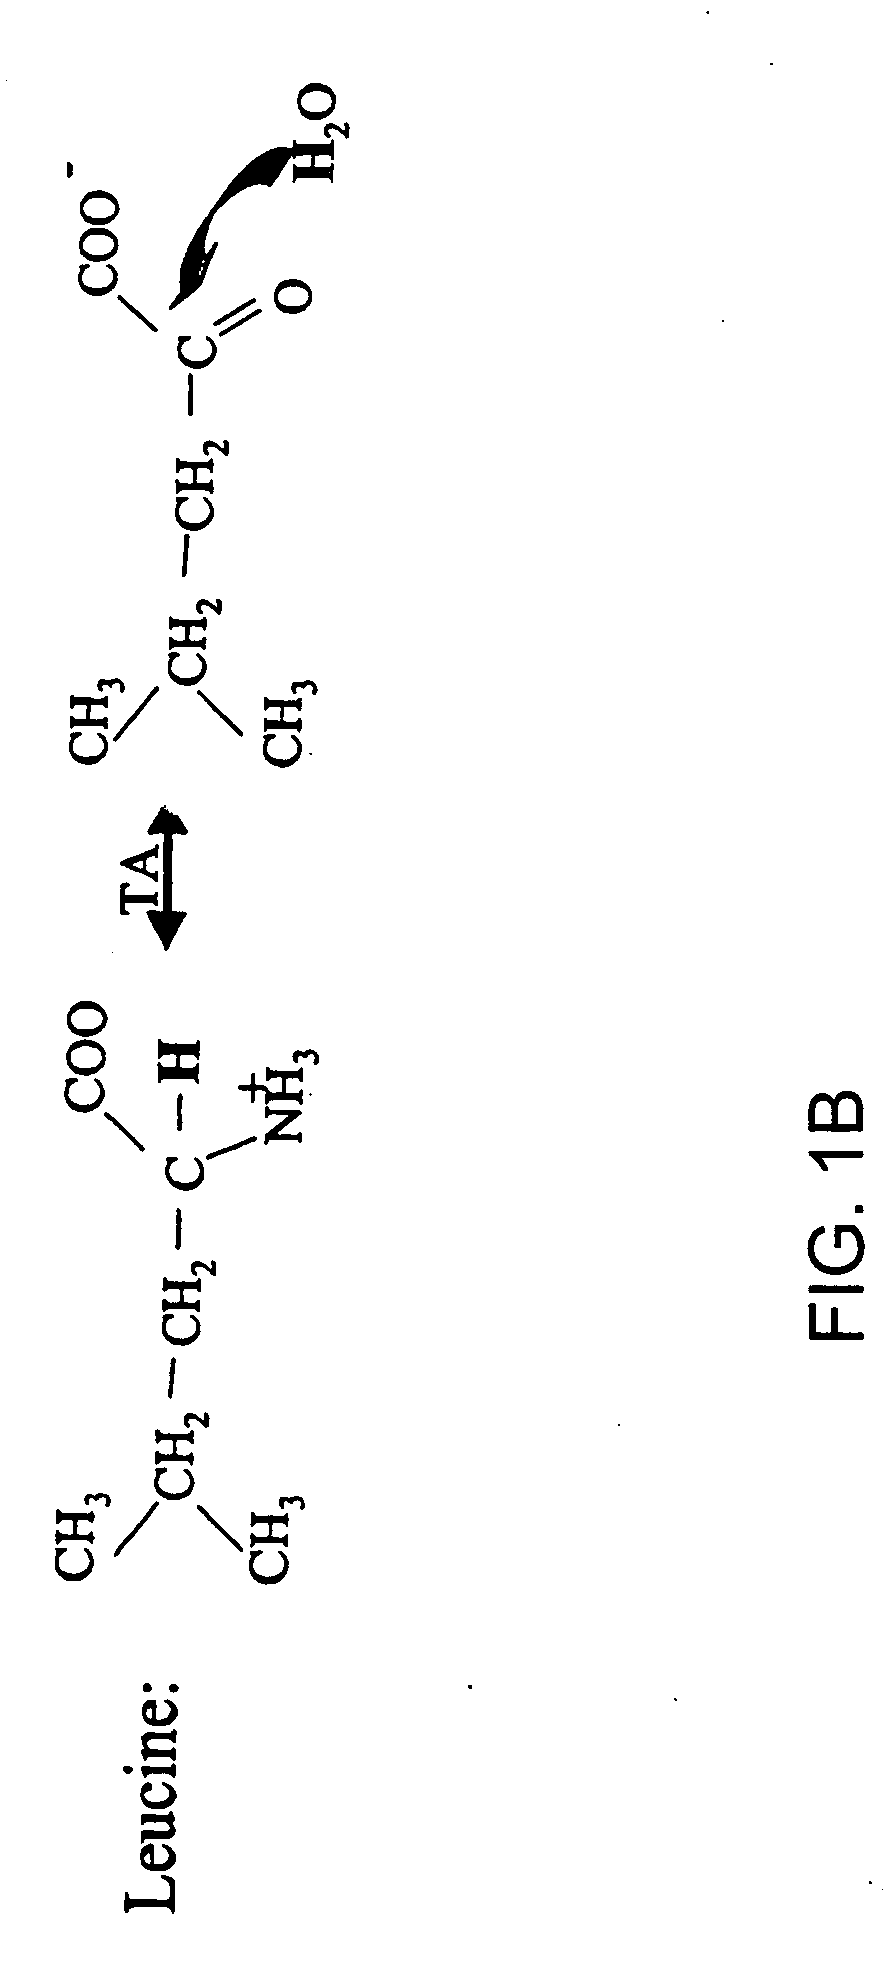
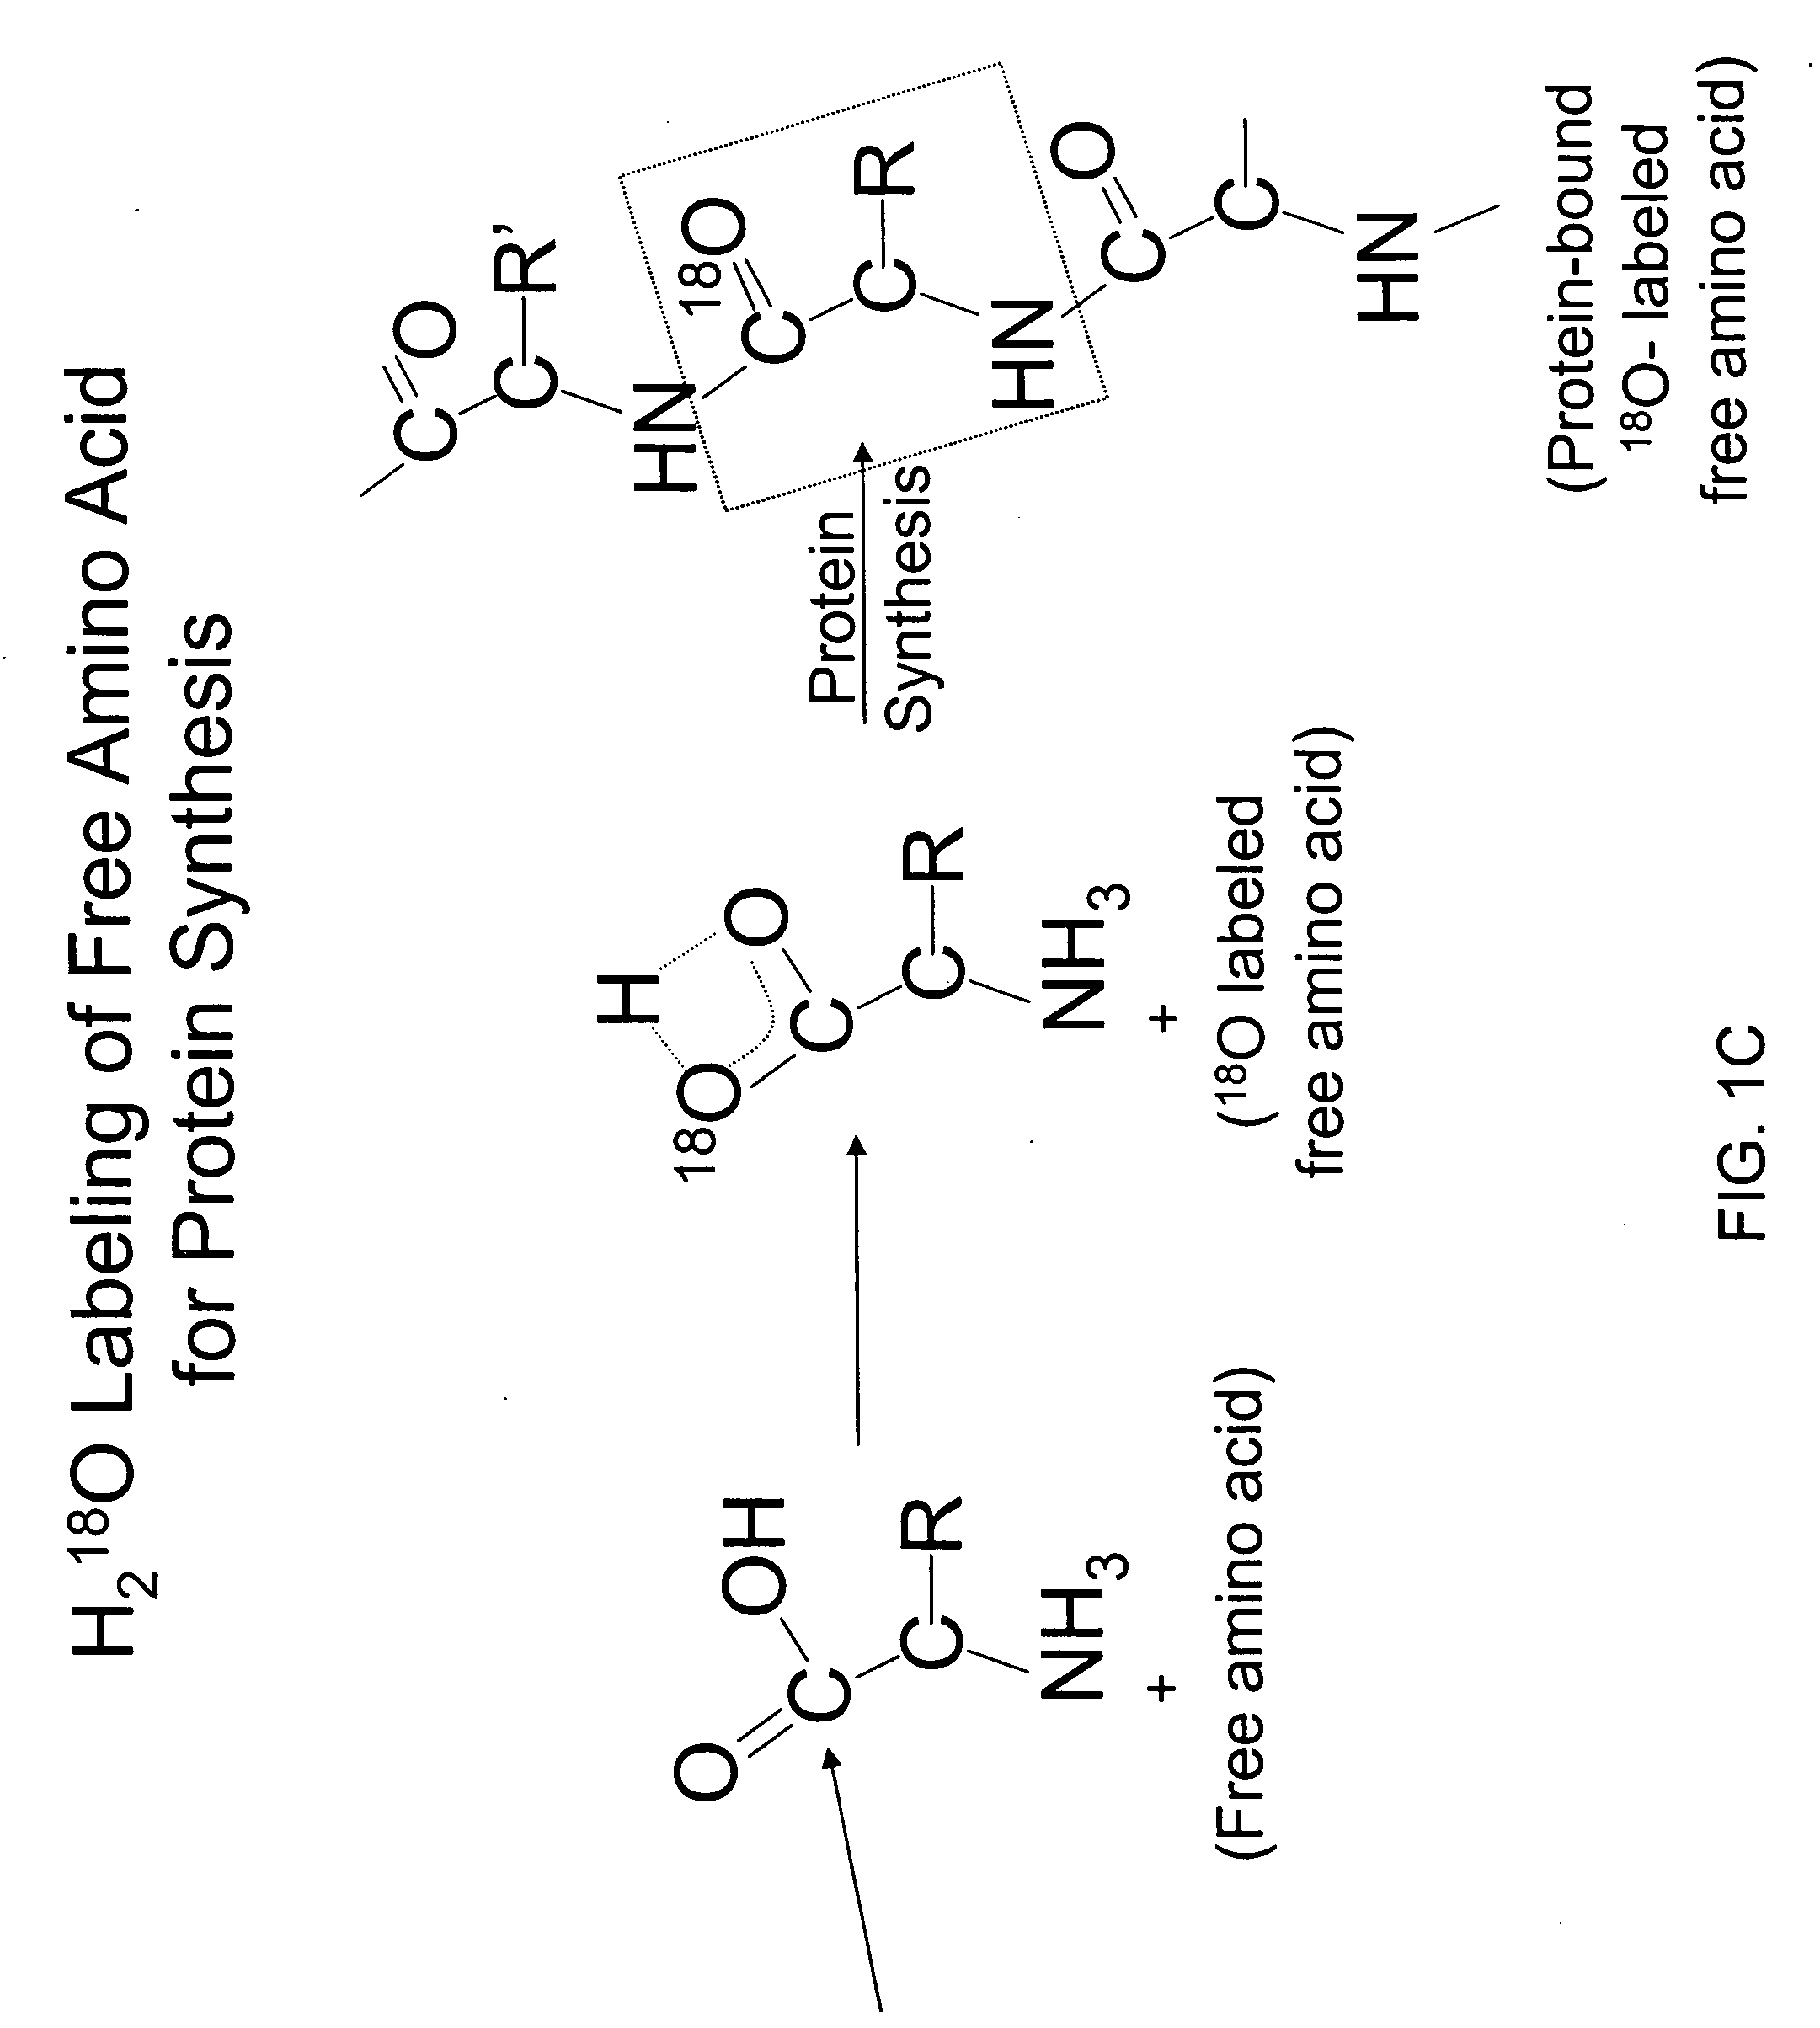
The occurrence of mitochondrial biogenesis independent of somatic growth of tissues can be very important, for example, in the training response of muscle to aerobic exercise. The ratio of mtDNA synthesis to cellular protein or genomic DNA synthesis reveals growth-independent mitochondrial biogenesis and turnover, and represents a biomarker of aerobic fitness. Synthesis rates of mtDNA and cellular proteins or genomic DNA are measured concurrently by administering labeled water and detecting the incorporation of the isotope label in the mtDNA and cellular proteins or genomic DNA (for example, see FIGS. 1 and 2).

Sprague-Dawley rats (wt 210-350 g) from Simonsen were housed in wire cages, 3 per cage with a 12 hour light / dark cycle. All procedures were approved by the UC Berkeley Office of Laboratory Animal Care. Purina rat chow was provided ad libitum. There were 2 groups of rats, a young male growing group...


PUM

PropertyMeasurementUnit
Molar concentrationaaaaaaaaaa
mass isotopomer distribution analysisaaaaaaaaaa
liquid scintillation countingaaaaaaaaaa

Abstract

The invention relates to techniques for measuring and comparing relative molecular flux rates of different biological molecules by administering isotope-labeled water to one or more tissues or individuals and comparing the molecular flux rates of two or more biological molecules, including biological molecules in different chemical classes. The methods find use in several applications including diagnosing, prognosing, or monitoring a disease, disorder, or condition, the in vivo high-throughput screening of chemical entities and biological factors for therapeutic effects in various disease models, and the in vivo high-throughput screening of chemical entities and biological factors for toxic effects.

Description

FIELD OF INVENTION This invention relates to techniques for measuring and comparing relative molecular flux rates of the same or different classes of biological molecules in living systems. More particularly, it relates to techniques of administering isotope-labeled water to one or more tissues or individuals, and comparing the relative molecular flux rates of two or more biological molecules relevant to disease or to the effects of drug therapies on disease, even if the biological molecules are of different chemical classes. BACKGROUND In the field of drug development and discovery, there has been a long-recognized need for functional biochemical markers to validate the hypothesized phenotypic consequences of hypothesized gene or protein targets and of candidate drugs. Because of rapid technologic advances in the tools for identifying candidate targets and drugs in recent years, in particular the development of highly efficient genomic and proteomic tools for identifying potentia...

Claims


Application Information

Patent Timeline
Patent Type & Authority Applications(United States)
IPC IPC(8): A61K51/00C07H15/00C07H21/02C07H21/04C12Q1/00C12Q1/02C12Q1/68G01NG01N33/50
CPCG01N33/502G01N2800/52G01N33/5088
Inventor HELLERSTEIN, MARC K.
Owner RGT UNIV OF CALIFORNIA
Why Eureka
Try Eureka